echarts一些配置项的使用
前言:我是自己最近写项目用到的,我做个整理;
一. 基本使用
1.具有大小(宽高)的div ,id唯一;
例如:
<div id="crewEchart"></div>2.在项目中引入:
import * as echarts from "echarts";3.写一个关于他的方法,在mounted的时候调用:
mounted() {this.setEcharts()//你自己起一个功能相关的名字就行;}4.在methods中写他的配置项:
methods:{setWarnEcharts(){},
}
二.配置项
以折线图为例:
1.图:
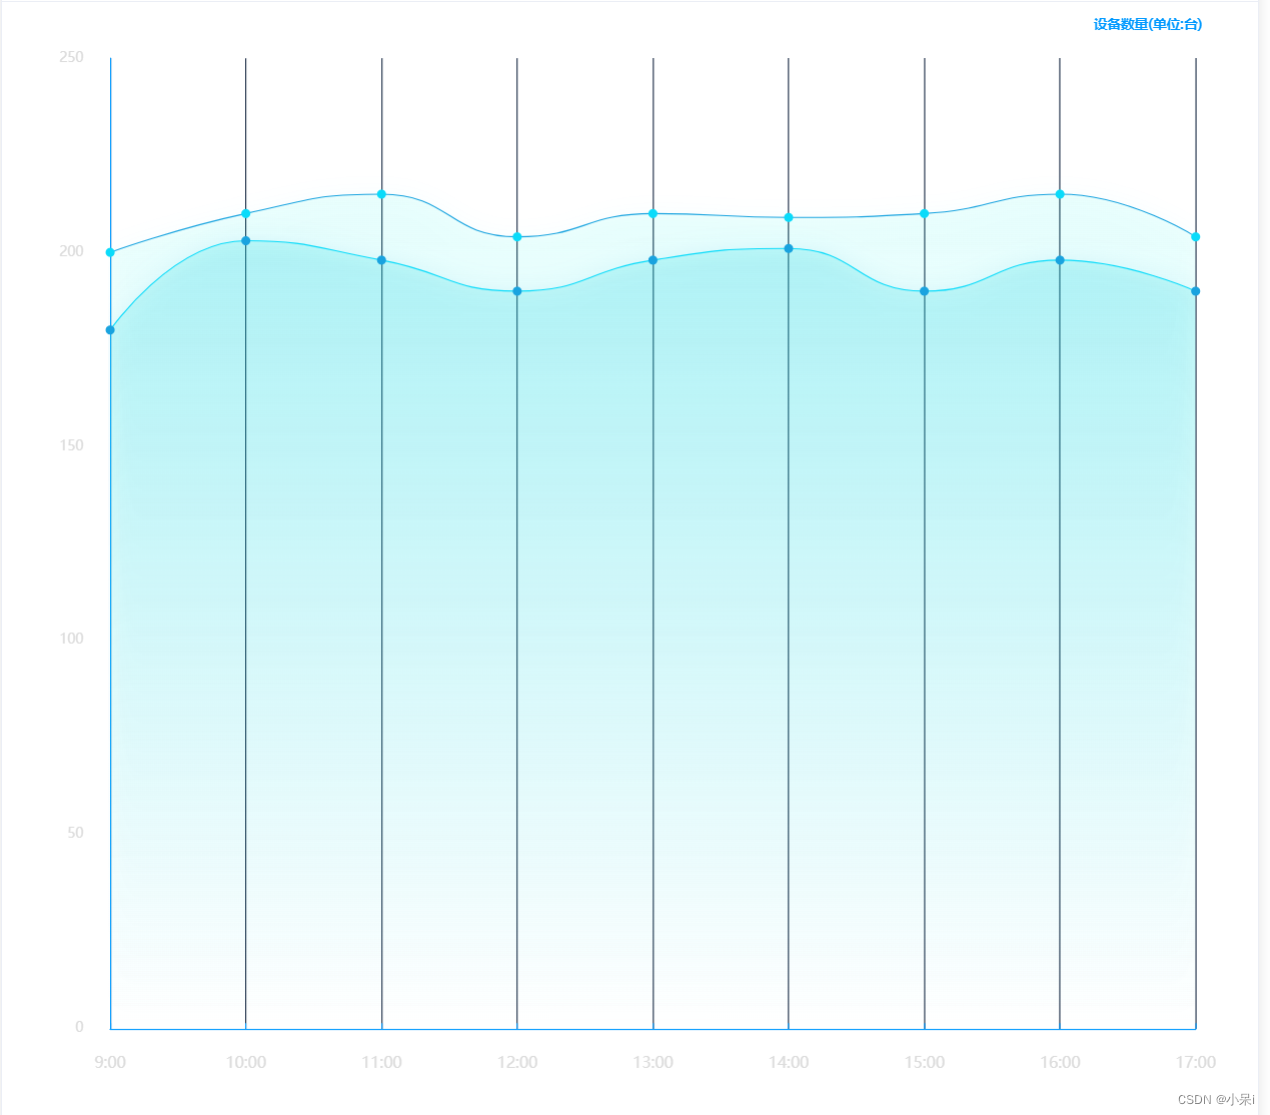
2.代码:
methods:{setWarnEcharts(){let xLabel =['9:00', '10:00', '11:00', '12:00', '13:00', '14:00', '15:00', '16:00', '17:00']
let online = ["180", "203", "198", "190", "198", "201", "190", "198", "190"]
let sum = ["200", "210", "215", "204", "210", "209", "210", "215", "204",]option = {title: {text: '设备数量(单位:台)',top: 10,right: '4%',bottom: '2%',textStyle: {color: '#0099FF',fontSize: 12,fontFamily: 'Microsoft YaHei'}},grid: {top: 50,left: '6%',right: '5%',bottom: '8%',containLabel: true},tooltip: {trigger: 'axis',backgroundColor:'transparent',axisPointer: {lineStyle: {type: 'solid',width: 3,color: {type: 'linear',x: 0,y: 0,x2: 0,y2: 1,colorStops: [{offset: 0,color: 'rgba(126,199,255,0)' // 0% 处的颜色}, {offset: 0.5,color: 'rgba(126,199,255,1)' // 100% 处的颜色}, {offset: 1,color: 'rgba(126,199,255,0)' // 100% 处的颜色}],global: false // 缺省为 false}},},formatter: (p) => {let dom = `<div style="width: 100px;height: 50px;;color:#fff;position: relative;"><svg style="position: absolute;top: 50%;left: 50%;transform: translateX(-50%) translateY(-50%);" class="svg" xmlns="http://www.w3.org/2000/svg" width="100" height="71" viewBox="0 0 84 55"><defs><style>.cls-1 {fill: #07172c;fill-opacity: 0.8;stroke: #a7d8ff;stroke-linejoin: round;stroke-opacity: 0.2;stroke-width: 1px;fill-rule: evenodd;}</style></defs><path id="矩形_419" data-name="矩形 419" class="cls-1" d="M266,595h74v50H266V624.046L261,620l5-3.984V595Z"transform="translate(-258.5 -592.5)" /></svg><div style="padding: 4px 8px 4px 14px;display: flex;justify-content: center;align-items: center;flex-direction: column;position: relative;z-index: 1;"><div style="margin-bottom: 4px;width:100%;display:${p[0]?'flex':'none'};justify-content:space-between;align-items:center;"><span style="font-size:14px;color:#7ec7ff;">${p[0]?p[0].seriesName:''}</span><span style="font-size:14px;color:#fff;">${p[0]?p[0].data:''}</span></div><div style="width:100%;height:100%;display:${p[1]?'flex':'none'};justify-content:space-between;align-items:center;"><span style="font-size:14px;color:#7ec7ff;">${p[1]?p[1].seriesName:''}</span><span style="font-size:14px;color:#fff;">${p[1]?p[1].data:''}</span></div></div></div>`return dom}},xAxis: [{type: 'category',boundaryGap: false,axisLine: { //坐标轴轴线相关设置。数学上的x轴lineStyle: {color: '#0099FF'},},axisLabel: { //坐标轴刻度标签的相关设置textStyle: {show: true,color: '#DBDBDB',padding: 16,fontSize: 14},formatter: function(data) {return data}},splitLine: {show: true,lineStyle: {color: '#192a44'},},axisTick: {show: true,inside: true},data: xLabel}],yAxis: [{//name: '数量',nameTextStyle: {color: "#7ec7ff",fontSize: 16,padding: 10},min: 0,splitLine: {show: false,lineStyle: {color: '#2AF4F7'},},axisLine: {show: true,lineStyle: {color: "#0099FF"},},axisLabel: {show: true,textStyle: {color: '#DBDBDB',padding: 16},formatter: function(value) {if (value === 0) {return value}return value}},axisTick: {show: false,},}],series: [{name: '在线:',type: 'line',symbol: 'circle', showAllSymbol: true,symbolSize: 8,smooth: true,lineStyle: {normal: {width: 1,color: "rgba(10,219,250,1)", // 线条颜色},//borderColor: 'rgba(0,0,0,.4)',},itemStyle: {color: "rgba(25,163,223,1)",borderColor: "#646ace",borderWidth: 0},tooltip: {show: true},areaStyle: { //区域填充样式normal: {//线性渐变,前4个参数分别是x0,y0,x2,y2(范围0~1);相当于图形包围盒中的百分比。如果最后一个参数是‘true’,则该四个值是绝对像素位置。color: new echarts.graphic.LinearGradient(0, 0, 0, 1, [{offset: 0,color: "rgba(50,228,228,0.3)"},{offset: 1,color: "rgba(50,228,228,0)"}], false),shadowColor: 'rgba(25,163,223,0.5)', //阴影颜色shadowBlur: 20 //shadowBlur设图形阴影的模糊大小。配合shadowColor,shadowOffsetX/Y, 设置图形的阴影效果。}},data: online}, {name: '总数:',type: 'line',symbol: 'circle', showAllSymbol: true,symbolSize: 8,smooth: true,lineStyle: {normal: {width: 1,color: "#19a3df", // 线条颜色},borderColor: 'rgba(0,0,0,.4)',},itemStyle: {color: "rgba(10,219,250,1)",borderColor: "#646ace",borderWidth: 0},tooltip: {show: true},areaStyle: { //区域填充样式normal: {stack: true,//线性渐变,前4个参数分别是x0,y0,x2,y2(范围0~1);相当于图形包围盒中的百分比。如果最后一个参数是‘true’,则该四个值是绝对像素位置。color: new echarts.graphic.LinearGradient(0, 0, 0, 1, [{offset: 0,color: "rgba(10,810,224,0.1)"},{offset: 1,color: "rgba(10,810,224,0)"}], false),shadowColor: 'rgba(10,219,250, 0.5)', //阴影颜色shadowBlur: 20 //shadowBlur设图形阴影的模糊大小。配合shadowColor,shadowOffsetX/Y, 设置图形的阴影效果。}},data: sum}]
};let len = 0
setInterval(()=>{if(len === xLabel.length){len = 0}myChart.dispatchAction({type: 'showTip',seriesIndex: 0,dataIndex: len,})len ++
}, 1000)},
}
三.单项介绍
1.以上图为例,简单介绍几个修改echarts的方法
主要是通过修改option来调整echarts图
1.修改标题:
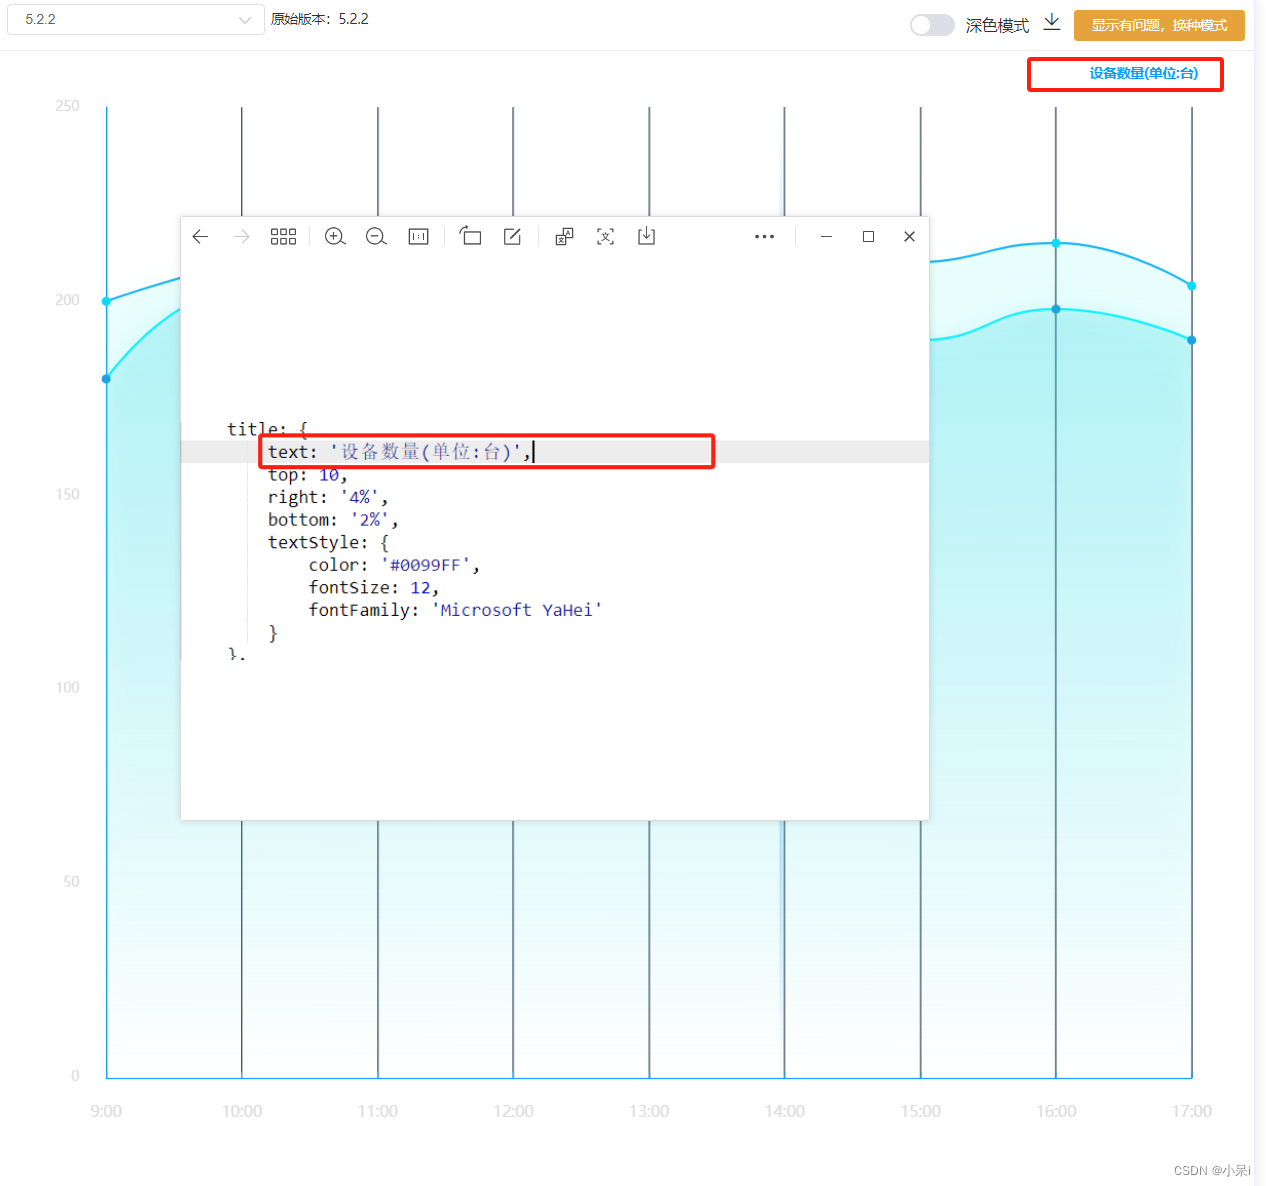
title: {text: '设备数量(单位:台)',//修改文字内容top: 10,//文字位置right: '4%',bottom: '2%',textStyle: {//文字样式color: '#0099FF',//文字颜色fontSize: 12,//文字大小fontFamily: 'Microsoft YaHei'//文字字体}},2.grid网格
grid: {//这个是调整echarts图片整体的位置top: 50,//距离上面多少left: '6%',//左边right: '5%',//右边bottom: '8%',//下面containLabel: true,//我不知道这个},3.tooltip提示信息

tooltip: {//提示信息,当鼠标放在图表上展示的内容,红框选中部分trigger: 'axis',backgroundColor:'red',axisPointer: {lineStyle: {//线的样式,绿框选中部分type: 'solid',width: 3,color: {type: 'linear',x: 0,y: 0,x2: 0,y2: 1,colorStops: [{offset: 0,color: 'rgba(126,199,255,0)' // 0% 处的颜色}, {offset: 0.5,color: 'rgba(126,199,255,1)' // 100% 处的颜色}, {offset: 1,color: 'rgba(126,199,255,0)' // 100% 处的颜色}],global: false // 缺省为 false}},},formatter: (p) => {//这个可以用来自定义let dom = `<div style="width: 100px;height: 50px;;color:#fff;position: relative;"><svg style="position: absolute;top: 50%;left: 50%;transform: translateX(-50%) translateY(-50%);" class="svg" xmlns="http://www.w3.org/2000/svg" width="100" height="71" viewBox="0 0 84 55"><defs><style>.cls-1 {fill: #07172c;fill-opacity: 0.8;stroke: #a7d8ff;stroke-linejoin: round;stroke-opacity: 0.2;stroke-width: 1px;fill-rule: evenodd;}</style></defs><path id="矩形_419" data-name="矩形 419" class="cls-1" d="M266,595h74v50H266V624.046L261,620l5-3.984V595Z"transform="translate(-258.5 -592.5)" /></svg><div style="padding: 4px 8px 4px 14px;display: flex;justify-content: center;align-items: center;flex-direction: column;position: relative;z-index: 1;"><div style="margin-bottom: 4px;width:100%;display:${p[0]?'flex':'none'};justify-content:space-between;align-items:center;"><span style="font-size:14px;color:#7ec7ff;">${p[0]?p[0].seriesName:''}</span><span style="font-size:14px;color:#fff;">${p[0]?p[0].data:''}</span></div><div style="width:100%;height:100%;display:${p[1]?'flex':'none'};justify-content:space-between;align-items:center;"><span style="font-size:14px;color:#7ec7ff;">${p[1]?p[1].seriesName:''}</span><span style="font-size:14px;color:#fff;">${p[1]?p[1].data:''}</span></div></div></div>`return dom}},4.x轴设置: xAxis
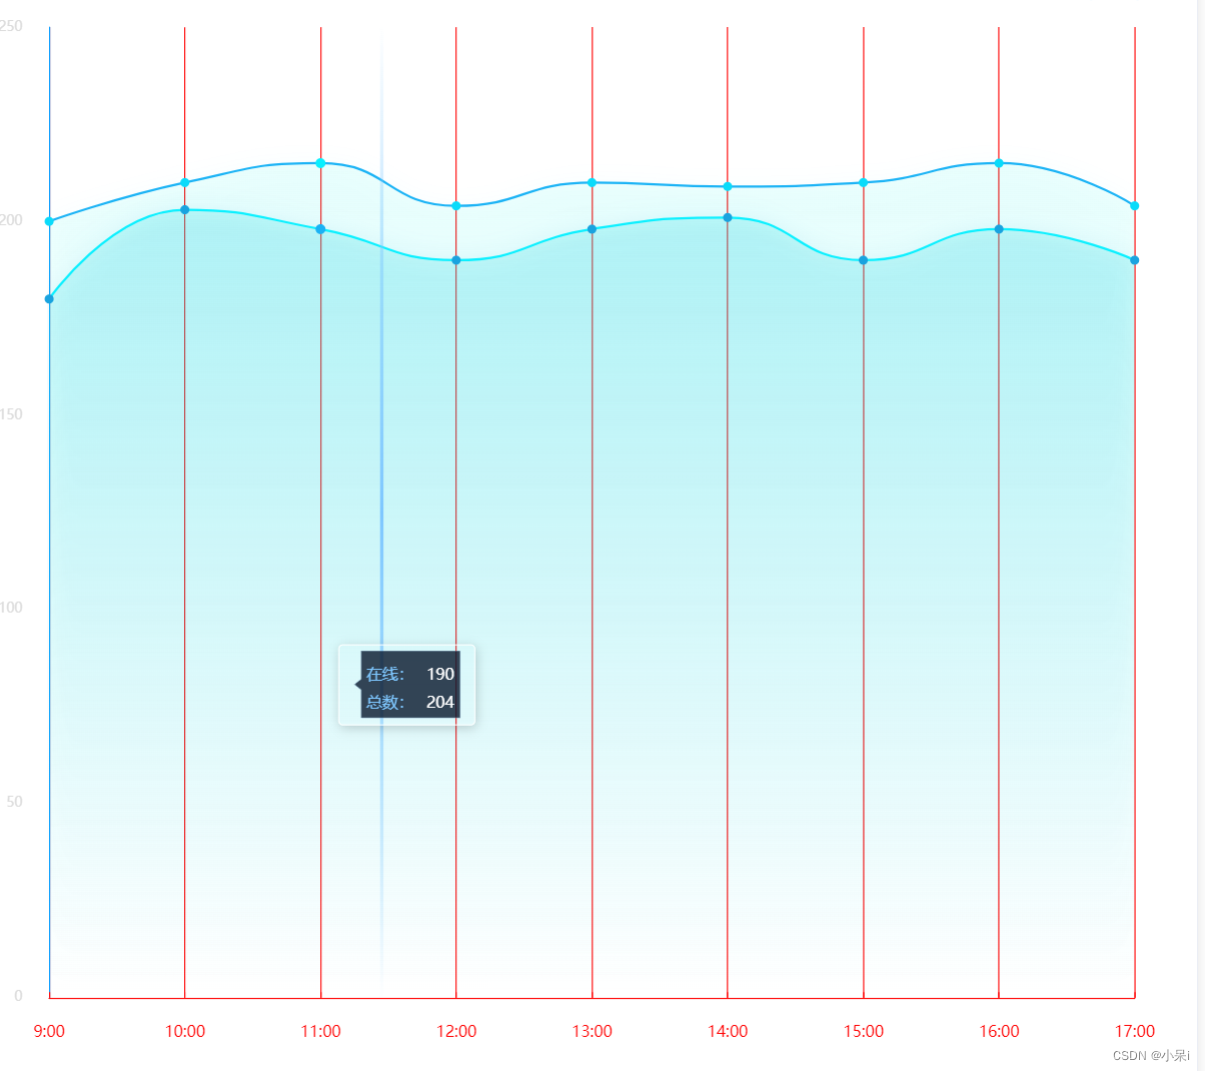
xAxis: [{type: 'category',boundaryGap: false,axisLine: { //坐标轴轴线相关设置。数学上的x轴lineStyle: {color: 'red',//x轴线的颜色},},axisLabel: { //坐标轴刻度标签的相关设置textStyle: {//x轴文字的样式设置show: true,color: 'red',//x轴文字的颜色padding: 16,fontSize: 14},formatter: function(data) {return data}},splitLine: {show: true,lineStyle: {color: 'red',//竖线颜色},},axisTick: {show: true,inside: true},data: xLabel,//x轴数据}],5.y轴设置:yAxis
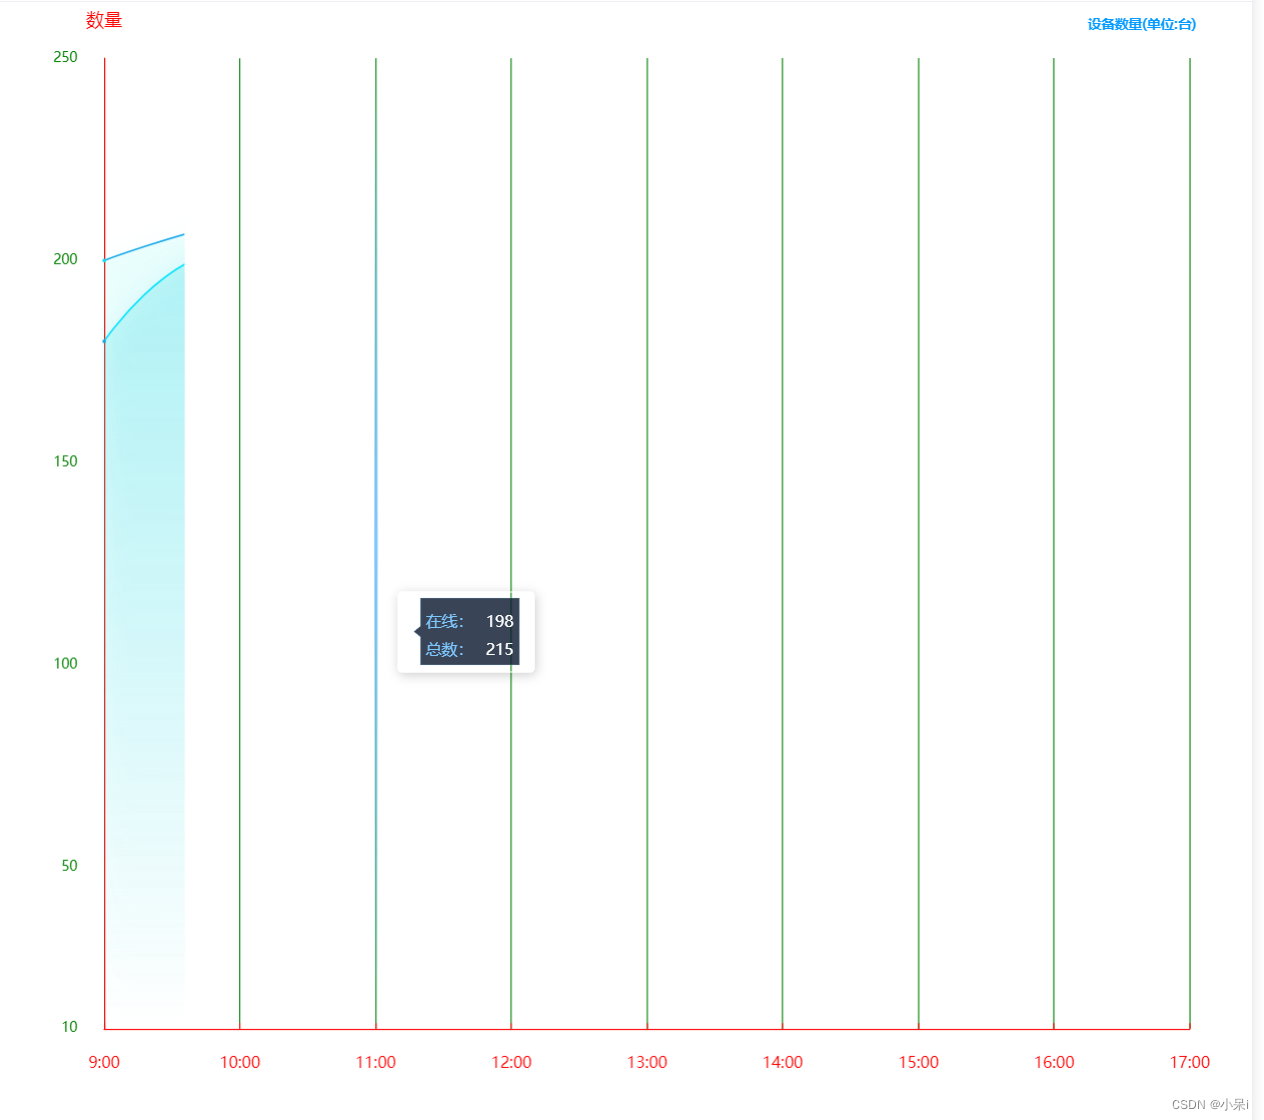
yAxis: [{name: '数量',//y轴名字nameTextStyle: {//y轴文字样式设置color: "#7ec7ff",fontSize: 16,padding: 10},min: 10,//y轴的最小值splitLine: {show: false,lineStyle: {color: '#2AF4F7'},},axisLine: {//y轴线的颜色show: true,lineStyle: {color: "#0099FF"},},axisLabel: {show: true,textStyle: {color: 'green',//y轴文字的颜色padding: 16},formatter: function(value) {//这里可以自定义,对y轴数据进行处理if (value === 0) {return value}return value}},axisTick: {show: false,},}],6.series 主要是调整他,折线图 饼图 等等,上面设置了横纵坐标,接下来设置内容...

series: [{//一个{}表示第一条数据name: '在线1111:',type: 'line',symbol: 'circle', showAllSymbol: true,symbolSize: 8,smooth: true,lineStyle: {normal: {width: 1,color: "red", // 线条颜色},//borderColor: 'rgba(0,0,0,.4)',},itemStyle: {color: "yellow",borderColor: "#646ace",borderWidth: 0},tooltip: {show: true},areaStyle: { //区域填充样式normal: {//线性渐变,前4个参数分别是x0,y0,x2,y2(范围0~1);相当于图形包围盒中的百分比。如果最后一个参数是‘true’,则该四个值是绝对像素位置。color: new echarts.graphic.LinearGradient(0, 0, 0, 1, [{offset: 0,color: "rgba(50,228,228,0.3)"},{offset: 1,color: "rgba(50,228,228,0)"}], false),shadowColor: 'rgba(25,163,223,0.5)', //阴影颜色shadowBlur: 20 //shadowBlur设图形阴影的模糊大小。配合shadowColor,shadowOffsetX/Y, 设置图形的阴影效果。}},data: online}, {name: '总数2222:',type: 'line',symbol: 'circle', showAllSymbol: true,symbolSize: 8,smooth: true,lineStyle: {normal: {width: 1,color: "#19a3df", // 线条颜色},borderColor: 'rgba(0,0,0,.4)',},itemStyle: {color: "rgba(10,219,250,1)",borderColor: "#646ace",borderWidth: 0},tooltip: {show: true},areaStyle: { //区域填充样式normal: {stack: true,//线性渐变,前4个参数分别是x0,y0,x2,y2(范围0~1);相当于图形包围盒中的百分比。如果最后一个参数是‘true’,则该四个值是绝对像素位置。color: new echarts.graphic.LinearGradient(0, 0, 0, 1, [{offset: 0,color: "rgba(10,810,224,0.1)"},{offset: 1,color: "rgba(10,810,224,0)"}], false),shadowColor: 'rgba(10,219,250, 0.5)', //阴影颜色shadowBlur: 20 //shadowBlur设图形阴影的模糊大小。配合shadowColor,shadowOffsetX/Y, 设置图形的阴影效果。}},data: sum}]7.还有饼图的两个属性 radius和 center
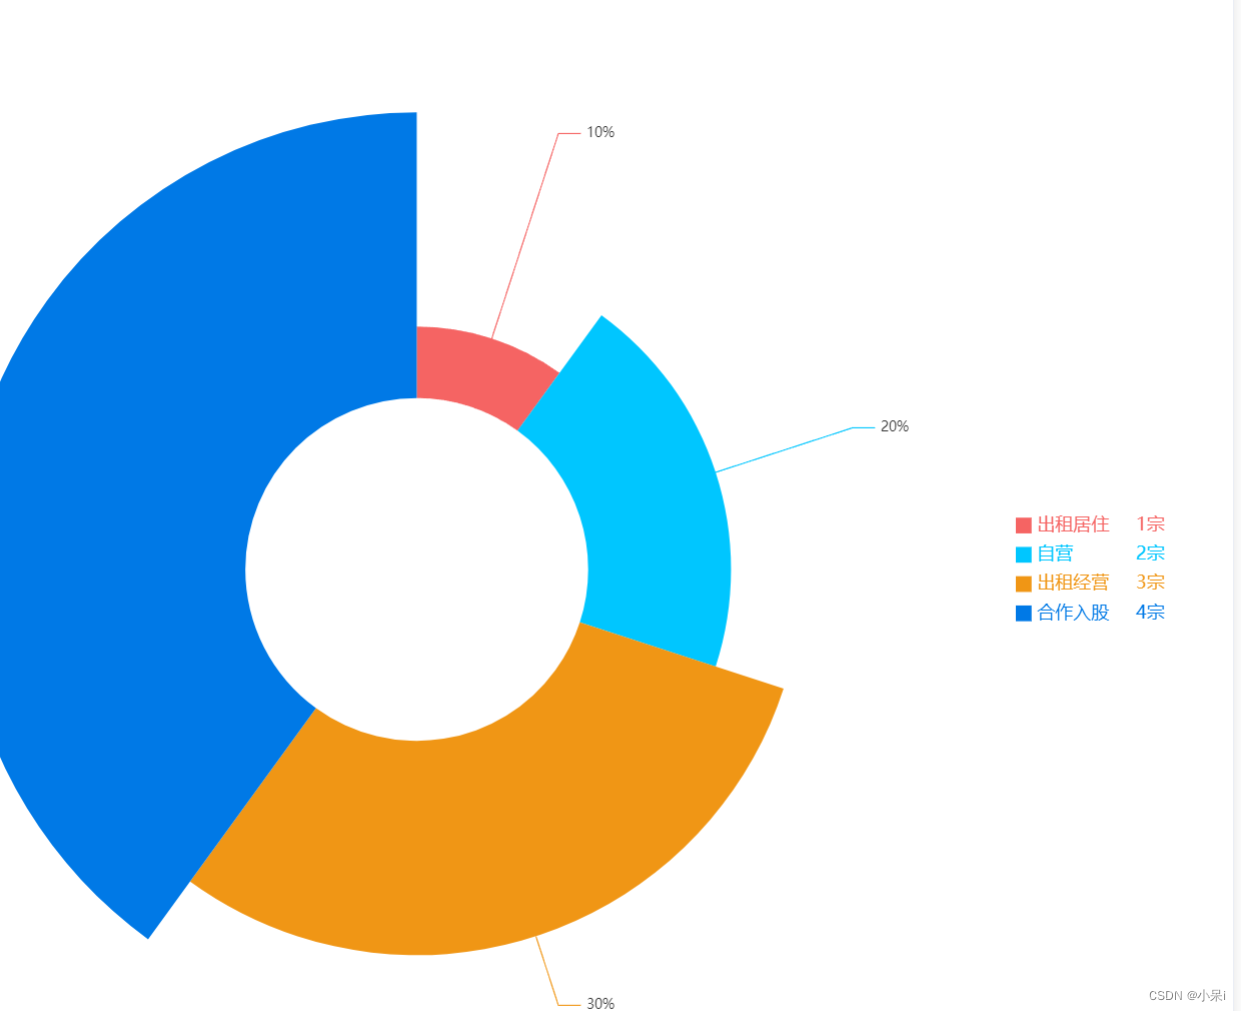
let datas = [{name: "出租居住",value: 1,},{name: "自营",value: 2,},{name: "出租经营",value: 3,},{name: "合作入股",value: 4,},];var option = {color: ["#F56463", "#00C6FF", "#F09615", "#0079E6"],legend: {itemHeight: 14,itemWidth: 14,icon: "rect",orient: "vertical",top: "center",right: "5%",textStyle: {align: "left",color: "#",verticalAlign: "middle",rich: {name: {width:80, fontSize: 16,},value: { width:20, align:"right",fontFamily: "Medium",fontSize: 16,},rate: {width:10,align:"right",fontSize: 16,},},},data: datas,formatter: (name) => {if (datas.length) {const item = datas.filter((item) => item.name === name)[0];return `{name|${name}}{value| ${item.value}} {rate| 宗}`;}},},tooltip: {trigger: "item",formatter: "{d}%",},series: [{name: "",type: "pie",radius: ["30%", "80%"],center: ["35%", "50%"],roseType: "radius",label: {formatter: "{d}%",},labelLine: {length: 1,length2: 20,},data: datas,},],};radius:["里面的圆的大小","外圆大小"];
center: ["echarts距离左边的距离", "echarts距离上边的距离"],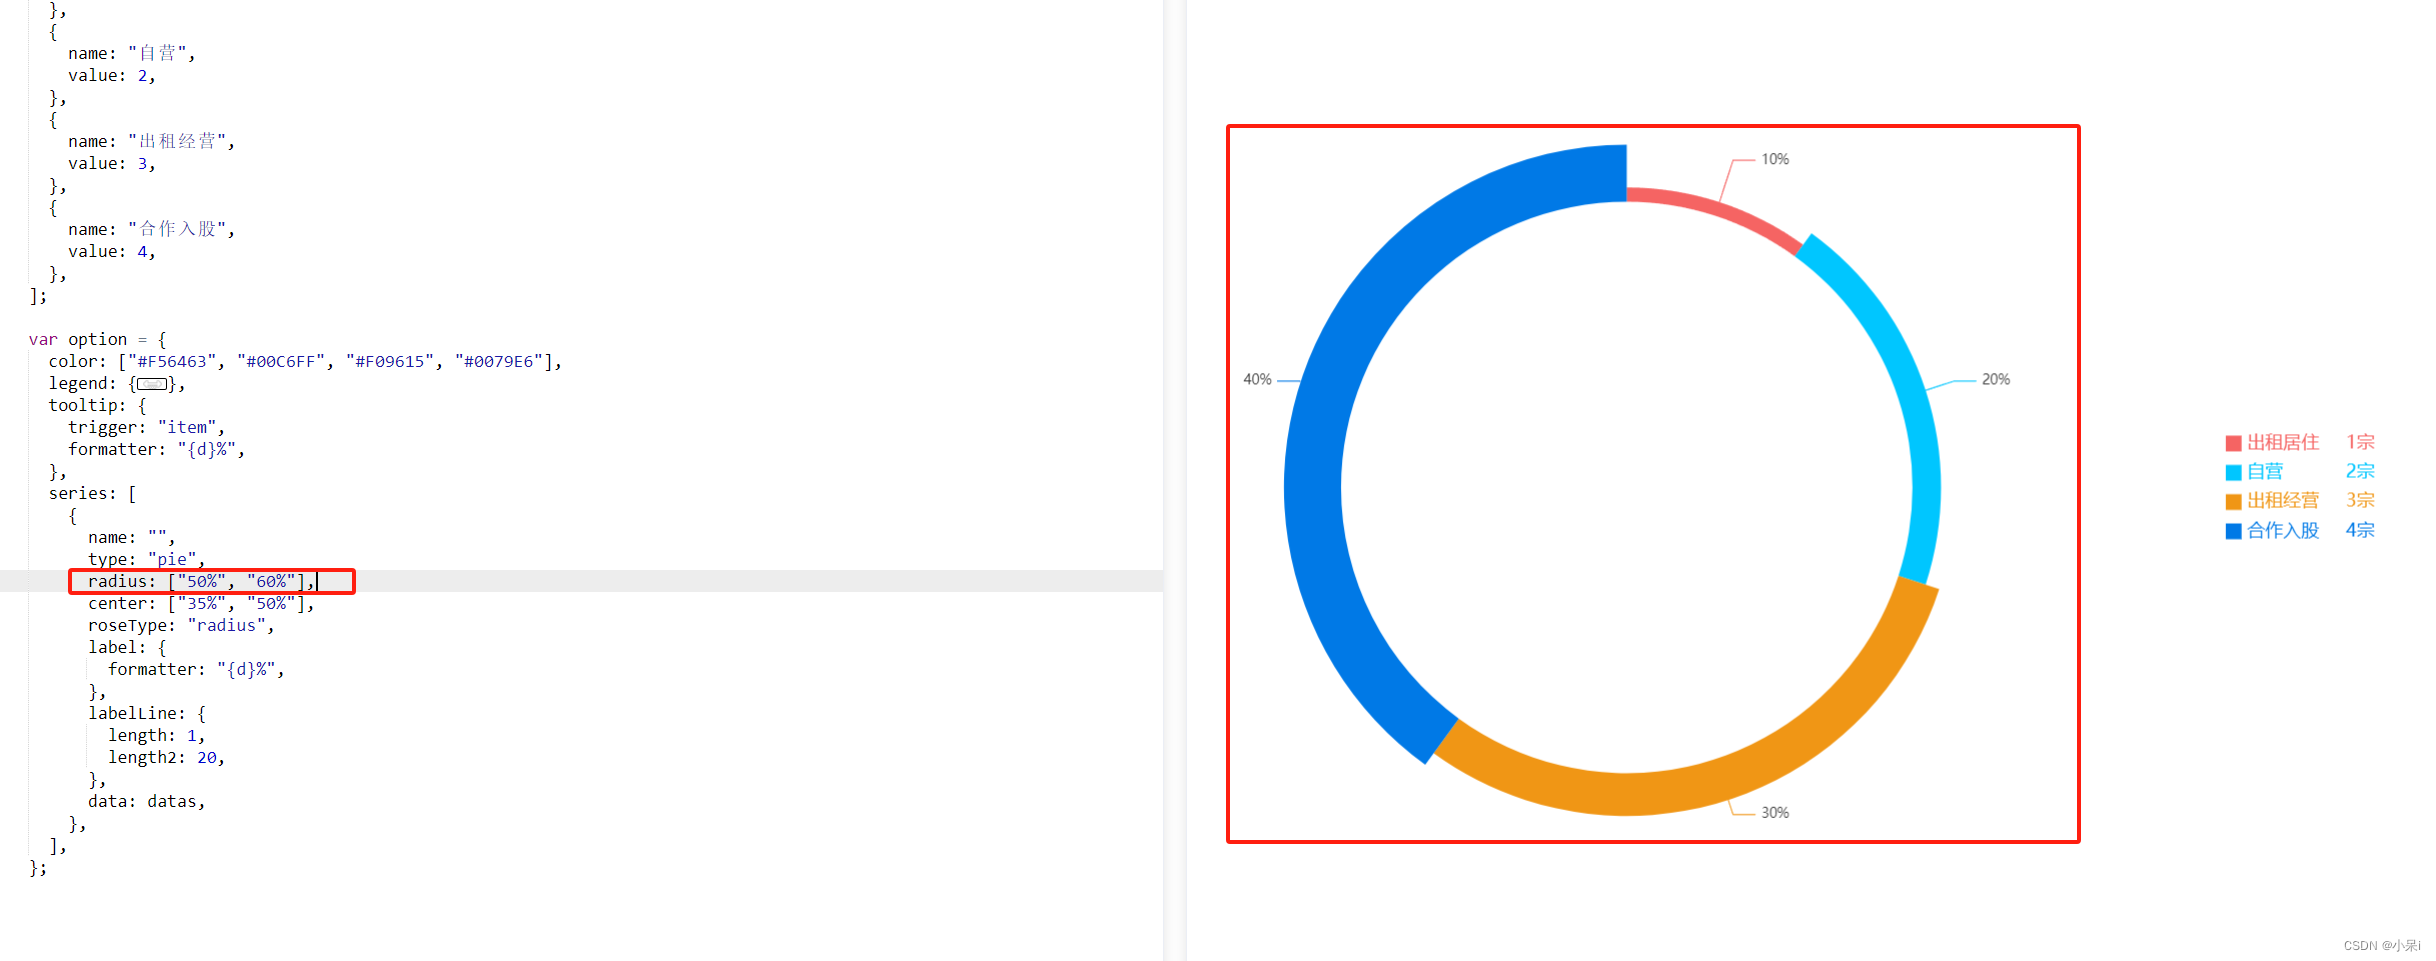
相关文章:
echarts一些配置项的使用
前言:我是自己最近写项目用到的,我做个整理; 一. 基本使用 1.具有大小(宽高)的div ,id唯一; 例如: <div id"crewEchart"></div> 2.在项目中引入: import * as echarts from "echarts"; 3.写一个关于他的方法,在mounted的时候调用: moun…...
(安全解析函数,解析yaml)(防止yaml文件中包含恶意代码))
python yaml库:safe_load()(安全解析函数,解析yaml)(防止yaml文件中包含恶意代码)
文章目录 Python YAML: 使用 safe_load 进行安全解析什么是 safe_load?如何使用 safe_load?为什么选择 safe_load 而非 load? Python YAML: 使用 safe_load 进行安全解析 YAML (YAML Ain’t Markup Language) 是一种人类可读的数据序列化标准。它被广泛用于配置文件、多语言…...
小程序:下拉刷新+上拉加载+自定义导航栏
下拉刷新 : <scroll-view scroll-y"true" 允许纵向滚动 refresher-enabled"true" 开启自定义下拉刷新 默认为false :refresher-triggered&quo…...
判断两个二叉树是否相等
bool isSameTree(struct TreeNode* p, struct TreeNode* q) {//两个都为空if(pNULL&&qNULL){return true;}//有一个为空if(pNULL||qNULL){return false;}//两个不为空,但值不相同if(p->val!q->val){return false;}//值相同return isSameTree(p->le…...
springcloud----检索中间件 ElasticSearch 分布式场景的运用
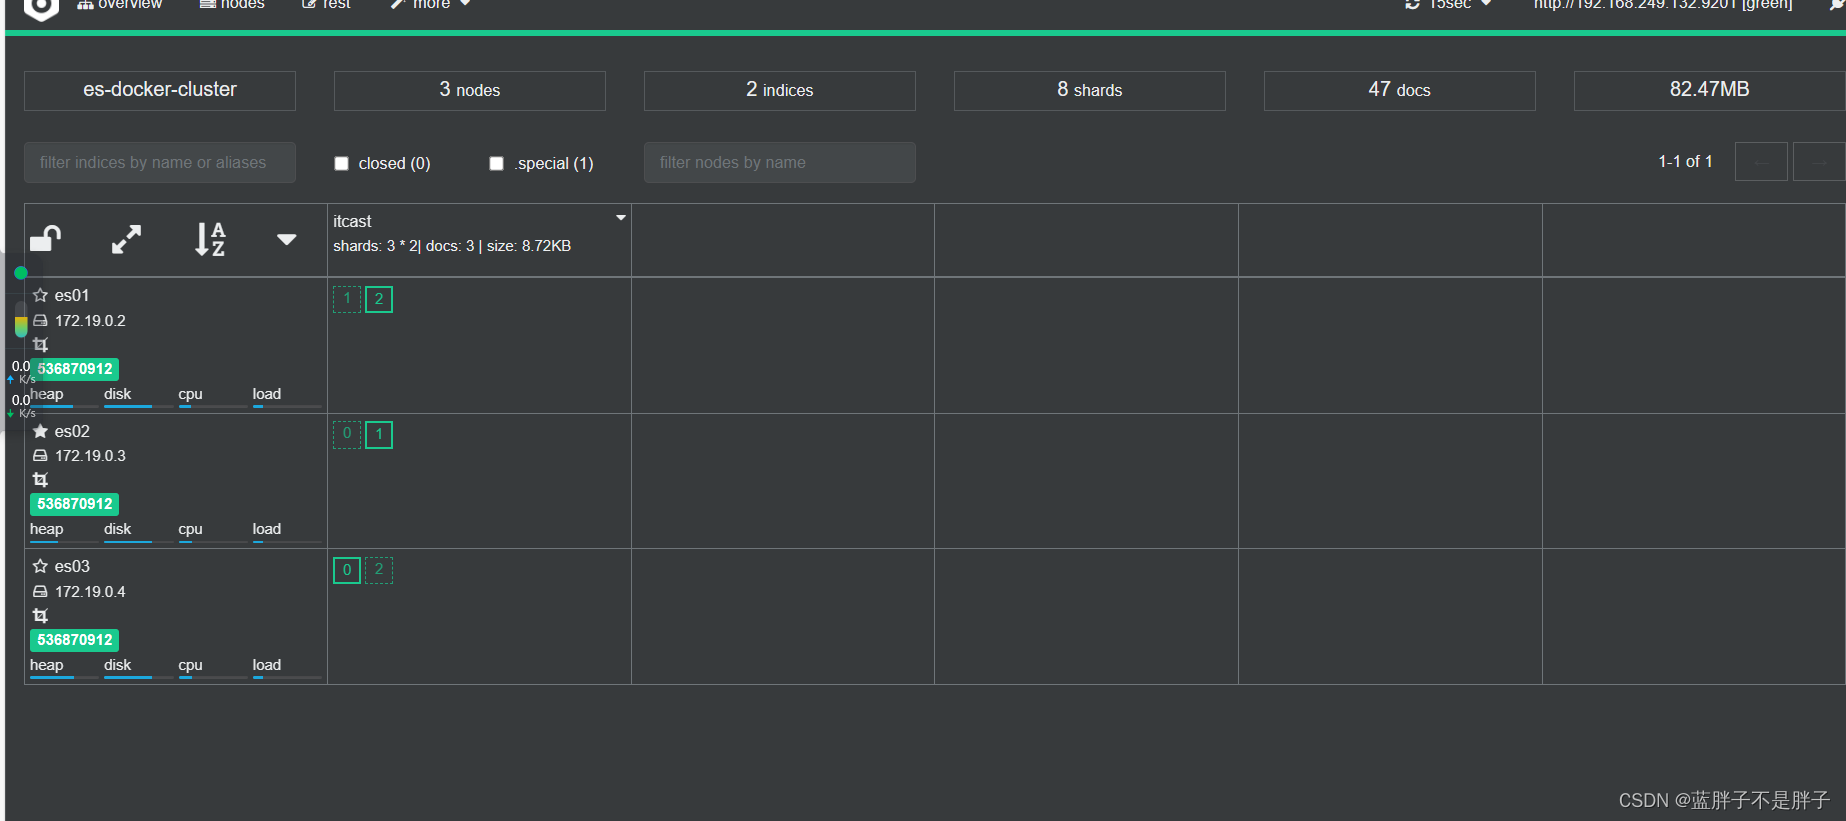
如果对es的基础知识有不了解的可以看 es看这个文章就会使用了 1.分布式集群场景下的使用 单机的elasticsearch做数据存储,必然面临两个问题:海量数据存储问题、单点故障问题。 海量数据存储问题:将索引库从逻辑上拆分为N个分片(…...

qt创建线程类并实现通信 C++
需求描述: 通过VS创建了一个QT项目,我需要一个线程类去实时获取设备取流的图像,并将图像传给qt的类用于在QLabel上显示。 实现: 头文件: //include ...省略//Qt界面的类Your_Project class Your_Project : public Q…...

【elasticsearch】使用自建证书搭建elasticsearch8.0.1集群
概述 本文将分享使用自建证书搭建加密的es集群,如果想使用rpm包安装,前期的搭建过程请参考上面一篇文章https://blog.csdn.net/margu_168/article/details/133344675。后续的操作与使用tar包安装的类似,只是需要注意目录的区别。 es8.0.1安…...
一篇文章带你用动态规划解决打家劫舍问题
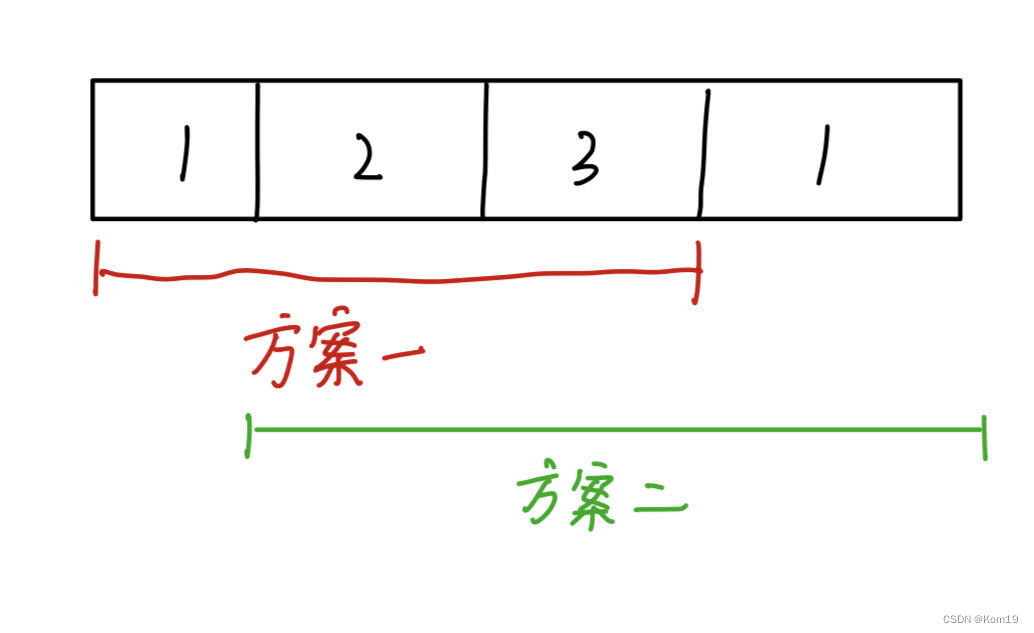
动态规划的解题步骤可以分为以下五步,大家先好好记住 1.创建dp数组以及明确dp数组下标的含义 2.制定递推公式 3.初始化 4.遍历顺序 5.验证结果 根据打家劫舍的题意:两个直接相连的房子在同一天晚上被打劫会触发警报 所以我们制定出核心策略——偷东…...
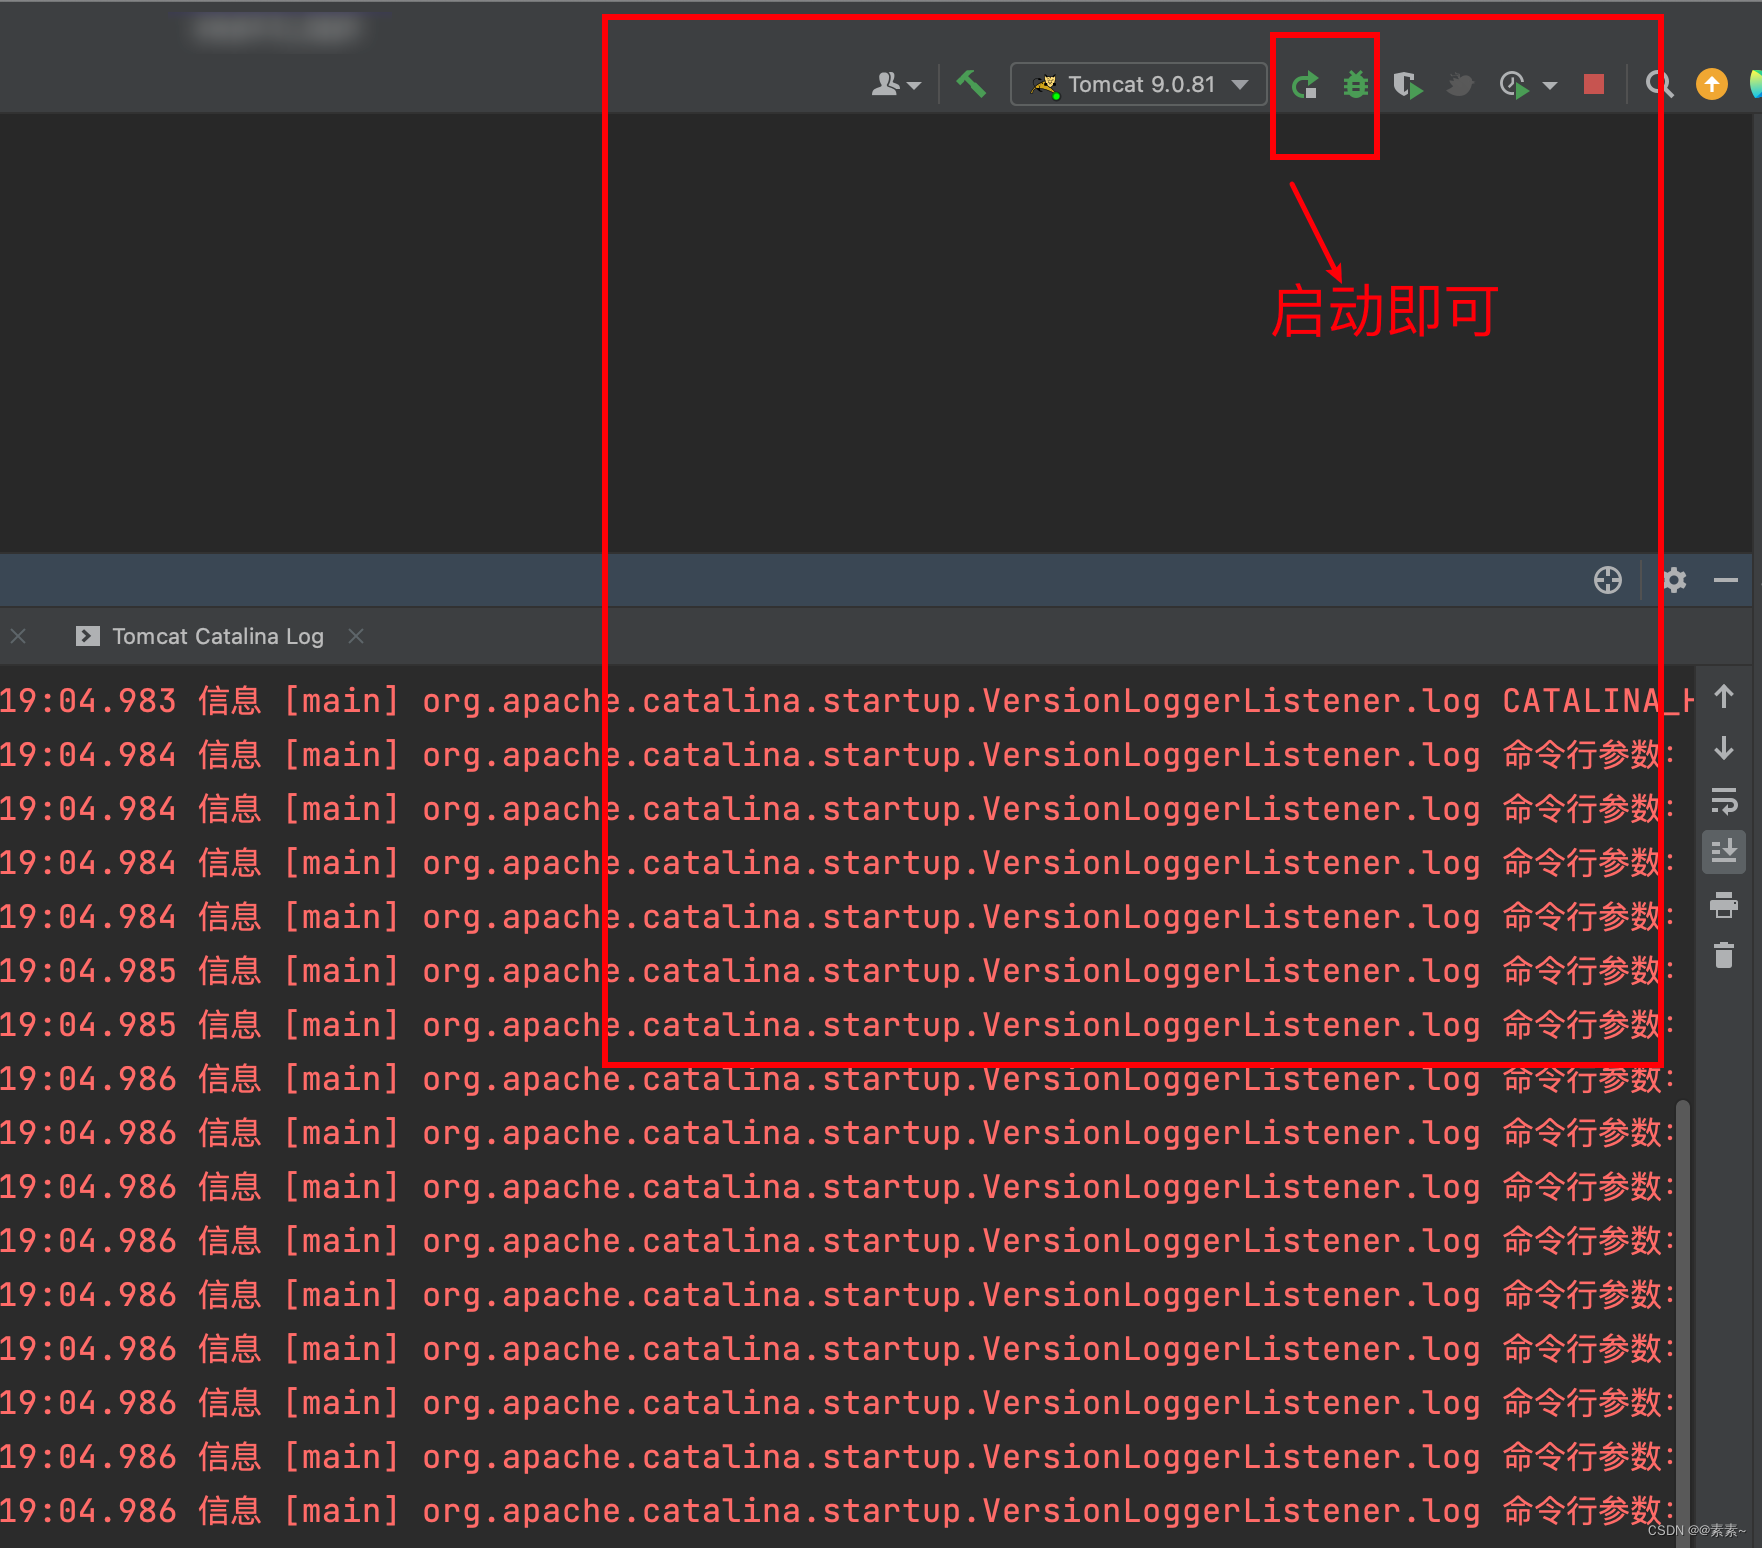
idea中导入eclipse的javaweb项目——tomact服务(保姆级别)
idea中导入eclipse的javaweb项目——tomact服务(保姆级别) 1. 导入项目2. Project Settings下的各种配置步骤2.1 检查/修改 jdk 的引入2.2 配置Modules-Dependencies2.2.1 删掉eclipse相关的多余配置2.2.2 删掉jar包2.2.3 添加tomcat的依赖 2.3 配置Libr…...

【开源】给ChatGLM写个,Java对接的SDK
作者:小傅哥 - 百度搜 小傅哥bugstack 博客:bugstack.cn 沉淀、分享、成长,让自己和他人都能有所收获!😄 大家好,我是技术UP主小傅哥。 清华大学计算机系的超大规模训练模型 ChatGLM-130B 使用效果非常牛&…...

基于Pytest+Allure+Excel的接口自动化测试框架
1. Allure 简介 简介 Allure 框架是一个灵活的、轻量级的、支持多语言的测试报告工具,它不仅以 Web 的方式展示了简介的测试结果,而且允许参与开发过程的每个人可以从日常执行的测试中,最大限度地提取有用信息。 Allure 是由 Java 语言开发的…...
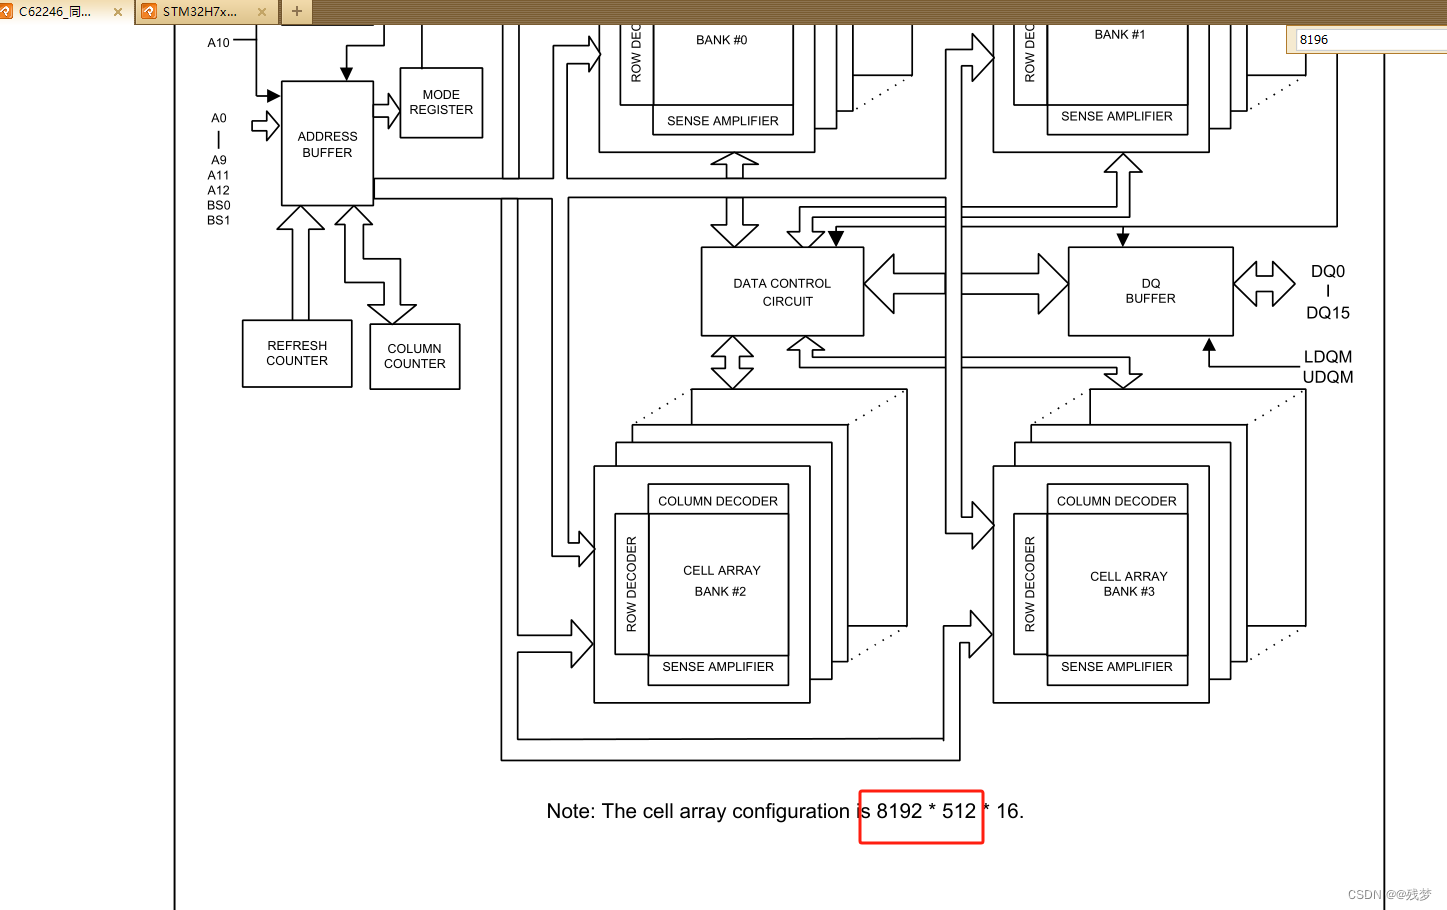
20.2 FMC驱动SDRAM的时序初始化实现及内存测试
继续上一篇的话题,写到SDRAM通过CubeMx配置后,在工程代码编写时直接引用的是我事先写好的时序初始化、内存测试文件,而未对其进行详细的解释,所以本篇文章就来娓娓道来。不多说,开始吧 SDRAM的初始化流程简述 SDRAM初…...

联想电脑一键重装系统Win10操作方法
很多用户都会利用重装系统的方法,来解决系统崩溃、病毒感染等问题。但是,很多新手用户不知道联想电脑Win10系统重装的详细方法步骤,下面小编给大家详细介绍关于联想电脑Win10系统重装的操作方法,帮助大家轻松快速地完成系统的重装…...
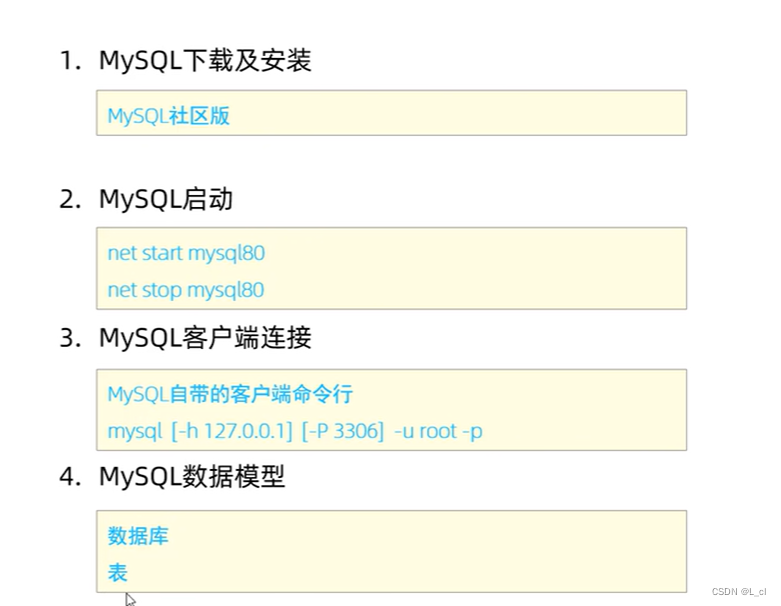
Mysql数据库 1.概述
Mysql内容概述 1. Mysql概述 数据库相关概念: 名称 全称 简称 数据库 存储数据的仓库,数据是有组织的进行存储 …...

Qt编程,文件操作、UDP通信
目录 1、文件类 QFile 2、 UPD/TCP网络编程 1、##UDP客户端 2、##UDP服务器端 1、文件类 QFile QFile file(filename); file.exists() file.setFileName(filename1); file.fileName() file.bytesAvailable() file.size() file.copy("2.txt") file1.errorString(…...
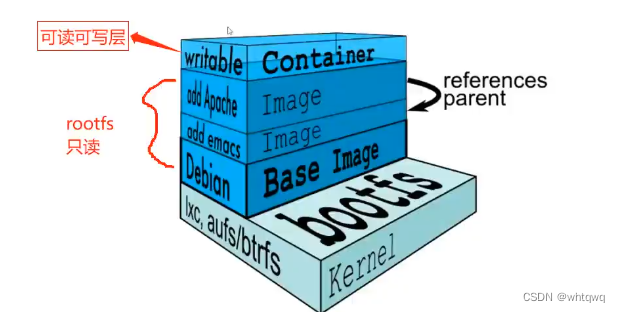
Docker 的数据管理和Dockerfile镜像的创建
目录 Docker 的数据管理 管理 Docker 容器中数据的方式 端口映射 容器互联(使用centos镜像) Docker 镜像的创建 Dockerfile 操作常用的指令 编写 Dockerfile 时格式 Dockerfile 案例 Docker 的数据管理 管理 Docker 容器中数据的方式 管理 Doc…...

[python] 利用 Pydoc 快速生成整个 Python 项目的文档
如何写注释 class MyClass:"""This is a simple example class.Attributes:param1 (int): The first parameter.param2 (str): The second parameter."""def __init__(self, param1, param2):"""The constructor for MyClass.:p…...

Maven 配置指南
目录 一、配置本地存储库 二、配置并行Artifact 解析 三、安全和部署设置 四、将镜像用于存储库 五、Profiles 六、可选配置 七、Settings 八、安全性 九、工具链 Maven配置发生在3个级别: 项目-大多数静态配置发生在pom.xml中安装-这是为Maven安装添加的…...

第十八章 类和对象——多态
一、多态的基本概念 多态是C面向对象三大特性之一 多态分为两类 静态多态: 函数重载 和 运算符重载属于静态多态,复用函数名 动态多态: 派生类和虚函数实现运行时多态 静态多态和动态多态区别: 静态多态的函数地址早绑定 - 编译阶段确定函数地址 动…...
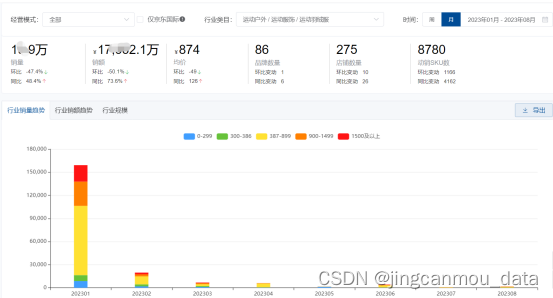
京东数据平台:2023年服饰行业销售数据分析
最近看到有些消费机构分析,不少知名的运动品牌都把“主战场”放到了冲锋衣,那么羽绒服市场就比较危险了。但其实羽绒服市场也有机会点可寻。 先来说冲锋衣。的确,从今年的销售数据以及增长情况,冲锋衣的确会是今年冬天的大热门品…...

打破平台壁垒:Windows上安装APK文件的完整解决方案
打破平台壁垒:Windows上安装APK文件的完整解决方案 【免费下载链接】APK-Installer An Android Application Installer for Windows 项目地址: https://gitcode.com/GitHub_Trending/ap/APK-Installer 你是否曾想过在Windows电脑上直接运行安卓应用ÿ…...
)
用Python和OpenCV手把手教你搞定自动驾驶图像坐标系转换(附NuScenes数据集实战代码)
用Python和OpenCV手把手教你搞定自动驾驶图像坐标系转换(附NuScenes数据集实战代码) 自动驾驶技术的核心在于让车辆"看懂"周围环境,而坐标系转换正是连接物理世界与数字世界的桥梁。想象一下,当一辆自动驾驶汽车行驶在…...

AI智能体密钥安全管理:AgentVault架构解析与实战指南
1. 项目概述:一个为AI智能体打造的“保险箱”最近在折腾AI智能体(Agent)应用开发的朋友,估计都绕不开一个核心痛点:如何安全、可靠地管理智能体运行过程中需要用到的各种密钥、凭证和敏感数据?无论是调用Op…...

OpenClaw 小龙虾智能体联动 DeepSeek 大模型部署实操攻略
前置准备 获取小龙虾open claw一键安装包(www.totom.top)并安装电脑端已成功安装并正常启动OpenClaw,右上角 Gateway 状态显示在线设备网络通畅,可正常访问 DeepSeek 开放平台拥有可接收验证码的手机号 / 微信,用于平…...

开源技能图谱工具SkillPort:Go语言构建的知识管理利器
1. 项目概述:一个技能图谱与知识管理的开源利器 最近在整理个人技术栈和团队知识库时,我一直在寻找一个能直观展示技能关联、又能深度管理学习路径的工具。市面上的笔记软件要么太“平”,只能线性记录;要么太“重”,像…...

从单一AI到智能体集群:构建模块化AI协作系统的核心原理与实践
1. 项目概述:当AI学会“开会”,一个开源智能体集群的诞生最近在GitHub上看到一个挺有意思的项目,叫daveshap/OpenAI_Agent_Swarm。光看名字,你可能会觉得这又是一个调用OpenAI API的简单封装库。但如果你点进去,花上十…...

手把手教你用SystemVerilog Interface搭建一个可复用的DMA寄存器验证环境
基于SystemVerilog Interface构建模块化DMA验证环境的工程实践 在数字IC验证领域,DMA(直接内存访问)控制器作为关键IP核,其寄存器验证环境的搭建效率直接影响项目进度。传统验证方法中信号连接冗长、时序控制分散的问题ÿ…...

CC2530与ESP8266物联网网关:ZigBee转Wi-Fi通信协议转换实战
1. 项目概述:当ZigBee遇上Wi-Fi最近在折腾一个智能家居的传感器节点,核心是TI的CC2530 ZigBee芯片。这玩意儿功耗低、组网方便,是很多低功耗传感网络的绝佳选择。但问题来了,ZigBee网络的数据最终怎么方便地送到我们手机上去看呢&…...

量子退火与经典优化结合的金融投资组合优化实践
1. 量子退火与经典优化结合的金融投资组合优化实践在金融投资领域,如何构建最优投资组合一直是核心挑战。传统方法如现代投资组合理论(MPT)和均值-方差优化(MVO)虽然奠定了理论基础,但在处理大规模资产配置时往往面临计算效率瓶颈。近年来,量…...

ARM Cortex-X系列处理器参数配置与性能优化指南
1. ARM Cortex-X系列处理器参数配置概述在移动计算和嵌入式系统领域,ARM Cortex-X系列处理器代表了ARM架构中的高性能核心设计。作为芯片设计工程师,我经常需要对这些处理器的参数进行精细调整,以实现最佳的性能和能效平衡。处理器参数配置本…...