Prometheus各类监控及监控指标和告警规则
目录
linux docker监控
linux 系统进程监控
linux 系统os监控
windows 系统os监控
配置文件&告警规则
Prometheus配置文件
node_alert.rules
docker_container.rules
mysql_alert.rules
vmware.rules
Alertmanager告警规则
consoul注册服务
Dashboard JSON文件
linux docker监控
获取的是docker stats命令的统计结果,可以页面方式展示出来。
cadvisor.tar
上传cadvisor.tar包,导入后修改tag,运行容器
docker load -i cadvisor.tardocker tag gcr.io/cadvisor/cadvisor:latest google/cadvisor:latestdocker run -d --volume=/:/rootfs:ro --volume=/var/run:/var/run:rw --volume=/sys:/sys:ro --volume=/var/lib/docker/:/var/lib/docker:ro --publish=8080:8080 --name=cadvisor google/cadvisor:latest容器运行后如下:

访问cadvisor http://ip:8080

linux 系统进程监控
通过正则、绝对路径、名字等获取指定进程的运行状况
process-exporter-0.7.5.linux-amd64.tar.gz
参考我的另一篇文章
Prometheus监控主机进程-CSDN博客
默认端口 9256
linux 系统os监控
通过exporter获取当前系统的Cpu、内存、硬盘等OS资源
node_exporter放到指定路径后
cat /etc/systemd/system/node-exporter.service
[Unit]
Description=Prometheus Node exporter
After=network.target[Service]
ExecStart=/opt/monitoring/node_exporter[Install]
WantedBy=multi-user.target
默认端口:9100
windows 系统os监控
通过exporter获取当前系统的Cpu、内存、硬盘等OS资源
windows_exporter-0.26.0-amd64.msi
1.关闭防火墙
2.管理员模式双击执行
3.services.msc服务管理检查windows-exporter服务自动启动即可
默认端口:9182
配置文件&告警规则
/opt/monitor/prometheus目录下
Prometheus配置文件
cat /opt/monitor/prometheus/prometheus.yml
# my global config
global:scrape_interval:     10s # By default, scrape targets every 15 seconds.scrape_timeout: 5sevaluation_interval: 10s # By default, scrape targets every 15 seconds.# scrape_timeout is set to the global default (10s).# Attach these labels to any time series or alerts when communicating with# external systems (federation, remote storage, Alertmanager).external_labels:monitor: 'zqa_monitor'# Load and evaluate rules in this file every 'evaluation_interval' seconds.
rule_files:- 'node_alert.rules'- 'mysql_alert.rules'- 'docker_container.rules'# - "first.rules"# - "second.rules"# alert
alerting:alertmanagers:- scheme: httpstatic_configs:- targets:- "alertmanager:9093"# A scrape configuration containing exactly one endpoint to scrape:
# Here it's Prometheus itself.
scrape_configs:# The job name is added as a label `job=<job_name>` to any timeseries scraped from this config.- job_name: 'prometheus'# Override the global default and scrape targets from this job every 5 seconds.scrape_interval: 5sstatic_configs:- targets: ['localhost:9090']#- job_name: 'cadvisor'# Override the global default and scrape targets from this job every 5 seconds.# scrape_interval: 5s#dns_sd_configs:#- names:#  - 'tasks.cadvisor'#  type: 'A'#  port: 8080#static_configs:#     - targets: ['10.33.70.218:8080']- job_name: 'node-exporter'# Override the global default and scrape targets from this job every 5 seconds.scrape_interval: 5sstatic_configs:- targets: ['10.100.10.100:9182']consul_sd_configs:- server: '10.33.70.203:8500'services: ['node-exporter-dev']- job_name: 'mysql-exporter'scrape_interval: 5sstatic_configs:- targets: ['10.33.70.218:9104', '10.33.70.166:9104', '10.33.70.224:9104']- job_name: 'postgres-exporter'scrape_interval: 5sstatic_configs:- targets: ['123.57.190.129:9187']- job_name: 'vsphere-exporter'scrape_interval: 5sstatic_configs:- targets: ['10.33.70.22:9272']- job_name: 'es-exporter'scrape_interval: 5sstatic_configs:- targets: ['123.57.216.51:9114']- job_name: 'pushgateway'scrape_interval: 30sstatic_configs:- targets: ['39.104.94.83:19091']labels:instance: pushgatewayhonor_labels: true- job_name: "cadvisor"scrape_interval: 10smetrics_path: '/metrics'static_configs:- targets: ["47.93.21.11:8080]#- job_name: 'kafka-exporter'#  scrape_interval: 5s#  static_configs:#       - targets: [ '10.100.7.1:9308']#  - job_name: 'pushgateway'
#    scrape_interval: 10s
#    dns_sd_configs:
#    - names:
#      - 'tasks.pushgateway'
#      type: 'A'
#      port: 9091#     static_configs:
#          - targets: ['node-exporter:9100']
node_alert.rules
groups:
- name: zqaalertrules:- alert:  机器宕机expr: up == 0for: 2mlabels:severity: criticalannotations:summary: "Instance {{ $labels.instance }} down"description: "{{ $labels.instance }} of job {{ $labels.job }} has been down for more than 2 minutes."- alert: 负载率expr: node_load1 > 8for: 5mlabels:severity: warningannotations:summary: "Instance {{ $labels.instance }} under high load"description: "{{ $labels.instance }} of job {{ $labels.job }} is under high load."- alert: 可用内存小于5%expr: node_memory_MemAvailable_bytes / node_memory_MemTotal_bytes * 100 < 5for: 10mlabels:severity: warningannotations:summary: Host out of memory (instance {{ $labels.instance }})description: "节点内存告警 (< 5% left)\n  VALUE = {{ $value }}\n  LABELS = {{ $labels }}"- alert:  磁盘使用率expr: (100 - ((node_filesystem_avail_bytes{device!~'rootfs'} * 100) / node_filesystem_size_bytes{device!~'rootfs'}) > 90)for: 5mlabels:severity: Highannotations:summary: "{{$labels.instance}}: High Disk usage detected"description: "{{$labels.instance}}: 硬盘使用率大于 90% (当前值:{{ $value }})"- alert: Cpu使用率expr: 100 - (avg by(instance) (rate(node_cpu_seconds_total{mode="idle"}[10m])) * 100) > 95for: 10mlabels:severity: warningannotations:summary: "{{$labels.instance}}: High Cpu usage detected"description: "{{$labels.instance}}: CPU 使用率大于 95% (current value is:{{ $value }})"# - alert: 进程恢复#   expr: ceil(time() - max by(instance, groupname) (namedprocess_namegroup_oldest_start_time_seconds)) < 60#   for: 0s#   labels:#     severity: warning#   annotations:#     summary: "进程重启"#     description: "进程{{ $labels.groupname }}在{{ $value }}秒前重启过"- alert: 进程退出告警# expr: max by(instance, groupname) (rate(namedprocess_namegroup_oldest_start_time_seconds{groupname=~"^vsftpd.*|^proxy.*|^goproxy.*|^lizhu_monitor*|^lizhu_agent*|^lizhurunner*"}[5m])) < 0expr: namedprocess_namegroup_num_procs{groupname=~"^vsftpd.*|^proxy.*|^goproxy.*|^lizhu_monitor*|^lizhu_agent*|^lizhurunner*"} == 0for: 30slabels:severity: warningannotations:summary: "进程退出"description: "进程{{ $labels.groupname }}退出了"  #  - alert: 进程退出告警
#    expr: max_over_time(namedprocess_namegroup_oldest_start_time_seconds{groupname=~"^vsftpd.*|^proxy.*|^goproxy.*|^lizhu_monitor.*|^lizhu_agent.*|^lizhurunner.*"}[1d]) < (time() - 10*60)
#    for: 1s
#    labels:
#      severity: warning
#    annotations:
#      description: 进程组 {{ $labels.groupname }} 中的进程在最近10分钟内退出了
#      summary: 进程退出#- alert: 机器硬盘读取速率#  expr: sum by (instance) (rate(node_disk_read_bytes_total[2m])) / 1024 / 1024 > 200#  for: 5m#  labels:#    severity: warning#  annotations:#    summary: Host unusual disk read rate (instance {{ $labels.instance }})#    description: "Disk is probably reading too much data (> 50 MB/s)\n  VALUE = {{ $value }}\n  LABELS = {{ $labels }}"#- alert: 机器硬盘写入速率#  expr: sum by (instance) (rate(node_disk_written_bytes_total[2m])) / 1024 / 1024 > 120#  for: 2m#  labels:#    severity: warning#  annotations:#    summary: Host unusual disk write rate (instance {{ $labels.instance }})#    description: "Disk is probably writing too much data VALUE = {{ $value }}\n  LABELS = {{ $labels }}"- alert: HostOomKillDetectedexpr: increase(node_vmstat_oom_kill[1m]) > 0for: 0mlabels:severity: warningannotations:summary: Host OOM kill detected (instance {{ $labels.instance }})description: "OOM kill detected\n  VALUE = {{ $value }}\n  LABELS = {{ $labels }}"- alert: Esxi主机连接丢失expr: vmware_host_power_state != 1for: 1m labels:severity: criticalannotations:summary: "Esxi 物理机IP: {{ $labels.host_name }} 丢失连接"description: "VMware host {{ $labels.host_name }} is not connected to the virtualization platform."
docker_container.rules
groups:
- name: zqaalertrules:- alert: ContainerAbsentexpr: absent(container_last_seen)for: 5mlabels:severity: warningannotations:summary: "无容器 容器:{{$labels.instance }}"description: "5分钟检查容器不存在,当前值为:{{ $value }}"- alert: ContainerCpuUsageexpr: (sum(rate(container_cpu_usage_seconds_total{name!=""}[3m])) BY(instance, name)*100 ) > 300for: 2mlabels:severity: warningannotations:summary: "容器cpu使用率告警,容器:{{$labels.instance }}"description: "容器cpu使用率超过300%,当前值为:{{ $value }}"- alert: ContainerMemoryUsageexpr: (sum(container_memory_working_set_bytes{name!=""})BY (instance, name) /sum(container_spec_memory_limit_bytes > 0) BY (instance, name) * 100 ) > 80for: 2mlabels:severity: warningannotations:summary: "容器内存使用率告警,容器:{{$labels.instance }}"description: "容器内存使用率超过80%,当前值为:{{ $value }}"- alert: ContainerVolumeIOUsageexpr: (sum(container_fs_io_current{name!=""}) BY (instance, name) * 100) >80 for: 2mlabels:severity: warningannotations:summary: "容器存储IO使用率告警,容器:{{$labels.instance }}"description: "容器存储IO使用率超过80%,当前值为:{{ $value }}"- alert: ContainerHighThrottleRateexpr: rate(container_cpus_cfs_throttled_seconds_total[3m]) > 1 for: 2mlabels:severity: warningannotations:summary: "容器限制告警,容器:{{$labels.instance }}"description: "容器被限制,当前值为:{{ $value }}"
mysql_alert.rules
groups:
- name: zqaalertrules:- alert:  Mysql 宕机expr: mysql_up == 0for: 1mlabels:severity: criticalannotations:summary: MySQL down (instance {{ $labels.instance }})description: "MySQL instance is down on {{ $labels.instance }}\n  VALUE = {{ $value }}\n  LABELS = {{ $labels }}"- alert: MysqlTooManyConnections(>80%)expr: max_over_time(mysql_global_status_threads_connected[1m]) / mysql_global_variables_max_connections * 100 > 80for: 2mlabels:severity: warningannotations:summary: MySQL too many connections (> 80%) (instance {{ $labels.instance }})description: "More than 80% of MySQL connections are in use on {{ $labels.instance }}\n  VALUE = {{ $value }}\n  LABELS = {{ $labels }}"- alert: MysqlHighThreadsRunningexpr: max_over_time(mysql_global_status_threads_running[1m]) / mysql_global_variables_max_connections * 100 > 60for: 2mlabels:severity: warningannotations:summary: MySQL high threads running (instance {{ $labels.instance }})description: "More than 60% of MySQL connections are in running state on {{ $labels.instance }}\n  VALUE = {{ $value }}\n  LABELS = {{ $labels }}"- alert: Mysql慢查询expr: increase(mysql_global_status_slow_queries[1m]) > 0for: 60mlabels:severity: warningannotations:summary: MySQL slow queries (instance {{ $labels.instance }})description: "MySQL server mysql has some new slow query.\n  VALUE = {{ $value }}\n  LABELS = {{ $labels }}"
vmware.rules
- name: VMware Host Connection Staterules:- alert: HostDisconnectedexpr: vmware_host_power_state == "connected"for: 5m # 规定主机连接状态必须持续5分钟才会触发警报labels:severity: warningannotations:summary: "VMware host {{ $labels.instance }} disconnected"description: "VMware host {{ $labels.instance }} is not connected to the virtualization platform."
Alertmanager告警规则
通过定义组来监控组内机器
cat vim /opt/monitor/alertmanager/config.yml
global:resolve_timeout: 5msmtp_from: 'ops@xxx.com'smtp_smarthost: 'smtp.feishu.cn:465'smtp_auth_username: 'ops@xxx.com'smtp_auth_password: 'ydWhsFDk3pF50TZg'smtp_require_tls: falsesmtp_hello: 'ZQA监控告警'route:group_by: ['zqaalert']group_wait: 60s # 在触发第一个警报后,等待相同分组内的所有警报的最长时间group_interval: 10m   # 系统每隔10分钟检查一次是否有新的警报需要处理repeat_interval: 60m  # 在发送警报通知后,在重复发送通知之间等待的时间。设置为1小时意味着如果同一组内的警报在 1小时再次触发receiver: 'web.hook'
receivers:
#- name: 'web.hook.prometheusalert'
- name: 'web.hook'webhook_configs:- url: 'http://10.33.70.22:9094/prometheusalert?type=fs&tpl=prometheus-fs&fsurl=https://open.feishu.cn/open-apis/bot/v2/hook/7fe7f42d-242b-42eb-837c-028cfc84adb8'
consoul注册服务
* */1 * * * ip addr | awk '/^[0-9]+: / {}; /inet.*global/ {print gensub(/(.*)\/(.*)/, "\\1", "g", $2)}' |grep "10.33"|head -1|xargs -i curl -X PUT -d '{"id": "node-exporter-{}","name": "node-exporter-dev","address": "{}","port": 9100,"tags": ["env-dev"],"checks": [{"http": "http://{}:9100/metrics", "interval": "5s"}]}' http://consul.intra.xxx.net/v1/agent/service/register有现成的consoul容器,运行即可
Dashboard JSON文件
以下是我认为比较好用的 grafana 的 dashboards文件
Grafana dashboards | Grafana Labs


相关文章:
Prometheus各类监控及监控指标和告警规则
目录 linux docker监控 linux 系统进程监控 linux 系统os监控 windows 系统os监控 配置文件&告警规则 Prometheus配置文件 node_alert.rules docker_container.rules mysql_alert.rules vmware.rules Alertmanager告警规则 consoul注册服务 Dashboard JSON…...

G120 EPos配置方案及应用场景
EPos功能就是基本定位器功能,它可计算出轴的运行特性,使轴以时间最佳的方式移动到目标位置。EPos功能主要包括:设定值 直接给定(MDI)功能、 选择程序段功能、回参考点功能、点动功能、运行到固定挡块功能。 EPos功能通过处理给定的加速度、速度和位置值生成运行特性曲线,…...

定制化爬虫管理:为企业量身打造的数据抓取方案
在数据驱动的时代,企业如何高效、安全地获取互联网上的宝贵信息?定制化爬虫管理服务应运而生,成为解锁专属数据宝藏的金钥匙。本文将深入探讨定制化爬虫管理如何为企业量身打造数据抓取方案,揭秘其在海量信息中精准捕获价值数据的…...

Javascript面试基础6【每日更新10】
Gulp gulp是前端开发过程中一种基于流的代码构建工具,是自动化项目的构建利器;它不仅能对网站资源进行优化,而且在开发过程中很多重复的任务能够使用正确的工具自动完成 Gulp的核心概念:流 流,简单来说就是建立在面向对象基础上的一种抽象的…...
CTF Web信息搜集 25000字详解
目录 前言信息收集常见信息分类域名信息whois备案CDN子域名解析记录 旁站C段服务器信息端口服务器类型数据库类型waf防火墙 网站信息备份文件备份文件常见的后缀名备份文件常见的文件名gedit备份文件vim备份文件收集方法 敏感目录CMS类型(指纹识别)探针泄…...

MSPM0G3507之电赛小车
一、前言 本文没什么技术分享,纯聊天。以下内容均为笔者的浅薄理解,有不对的地方还请多多包涵。 二、相关配置 主控单元:MSPM0G3507SPTR(48角) 编译环境:Keil5.33、5.39(推荐)都可 …...

linux运维一天一个shell命令之vmstat详解
概念 vmstat 是 Linux 系统中一个非常有用的工具,主要用于报告系统的虚拟内存、进程、CPU 活动和 IO 性能等信息。以下是对 vmstat 工具的详细解释: 基本语法 vmstat [options] [delay [count]]delay:更新的时间间隔(以秒为单…...

前端开发调试工具推荐分类整理
具体前往:前端调试工具分类整理汇总...

http协议与nginx
动态页面与静态页面的差别: (1)URL不同 静态⻚⾯链接⾥没有“?” 动态⻚⾯链接⾥包含“?” (2)后缀不同 (开发语⾔不同) 静态⻚⾯⼀般以 .html .htm .xml 为后缀 动态⻚⾯⼀般以 .php .jsp .py等为后…...

一款国外开发的高质量WordPress下载站模板主题
5play下载站是由国外站长开发的一款WordPress主题,主题简约大方,为v1.8版本, 该主题模板中包含了上千个应用,登录后台以后只需要简单的三个步骤就可以轻松发布apk文章, 我们只需要在WordPress后台中导入该主题就可以…...

Laravel为什么会成为最优雅的PHP框架
Laravel之所以成为最优雅的PHP框架之一,是因为它提供了一系列的优点,包括简洁的语法、强大的功能集、高度模块化和可扩展性、优雅的ORM、内置认证系统、丰富的社区支持和测试友好等。这些优点使得Laravel在PHP框架中脱颖而出,成为了很多开发者的首选框架。 官网:https://l…...

孤儿进程的例子
先让父进程死亡,子进程的父进程会被操作系统管理 先使用gcc编译代码, 执行代码后用 ps -p <进程号> -f 查看进程 #include <stdio.h> #include <stdlib.h> #include <sys/types.h> #include <unistd.h>int main() {pid_t pid;// 创建…...

CSS前端面试题——怎么用CSS实现一个宽高自适应的正方形?
方法一:使用 padding 方案 这种方法通过设置元素的 padding 属性来实现宽高比例相等的正方形。假设我们希望正方形的边长为相对于父容器的百分比值,比如50% .square {width: 50%; /* 可以是任意宽度,这里假设为父元素宽度的50% */padding-t…...

谷粒商城实战笔记-56~57-商品服务-API-三级分类-修改-拖拽功能完成
文章目录 一,56-商品服务-API-三级分类-修改-拖拽功能完成二,57-商品服务-API-三级分类-修改-批量拖拽效果1,增加按钮2,多次拖拽一次保存完整代码 在构建商品服务API中的三级分类修改功能时,拖拽排序是一个直观且高效的…...

Shader入门精要总结(二)矩阵
1. 矩阵乘法 一个rn的矩阵A和一个nc的矩阵B相乘,它们的结果AB将会是一个rc大小的矩阵,不满足此规则不能相乘 矩阵乘法满足一些性质 矩阵乘法不满足交换律 即AB≠BA矩阵乘法满足结合律 (AB)CA(BC) 2. 特殊矩阵 方块矩阵 指行和列数目相等的矩阵&#…...

基于CentOS Stream 9平台安装MySQL Community Server 9.0.1 Innovation
1. 安装之前 1.1 查看系统版本 cat /etc/redhat-releaseCentOS Stream release 9 1.2 查看cpu架构 lscpu架构: x86_64 CPU 运行模式: 32-bit, 64-bit 2. 官网下载 https://dev.mysql.com/downloads/mysql/ 要多看看 官方9.0文档:https://d…...

正则采集器之五——商品匹配规则
需求设计 实现分析 系统通过访问URL得到html代码,通过正则表达式匹配html,通过反向引用来得到商品的标题、图片、价格、原价、id,这部分逻辑在java中实现。 匹配商品的正则做成可视化编辑,因为不同网站的结构不同,同…...

一键切换阿里yum源(包括其他系统repo镜像查找方法)
一键切换阿里yum源 示例命令其他系统repo镜像GitHub文档 示例命令 # 备份旧源 mv CentOS-Base.repo CentOS-Base.repo.bak # 添加新源(阿里镜像源) wget -O /etc/yum.repos.d/CentOS-Base.repo http://mirrors.aliyun.com/repo/Centos-7.repo其他系统repo镜像 这里的示例是用…...

Fiddler学习笔记
目录 前言 简介 原理 界面 前言 测试可以使用fiddler工具,通过抓包的方式修改前端参数和模拟后端返回,快速定位缺陷。 简介 Fiddler是HTTP协议调试代理工具,可以记录并检查所有客户端和服务器之间的HTTP和HTTPS请求,允许监视…...

【Vue3】watch 监视多种类型数据
【Vue3】watch 监视多种类型数据 背景简介开发环境开发步骤及源码 背景 随着年龄的增长,很多曾经烂熟于心的技术原理已被岁月摩擦得愈发模糊起来,技术出身的人总是很难放下一些执念,遂将这些知识整理成文,以纪念曾经努力学习奋斗…...
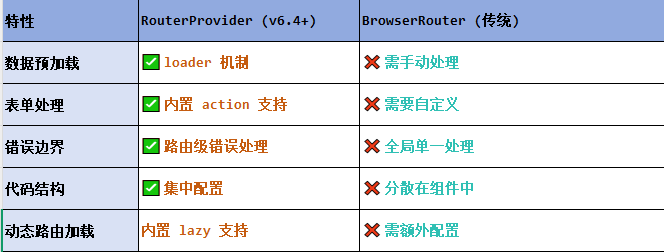
React第五十七节 Router中RouterProvider使用详解及注意事项
前言 在 React Router v6.4 中,RouterProvider 是一个核心组件,用于提供基于数据路由(data routers)的新型路由方案。 它替代了传统的 <BrowserRouter>,支持更强大的数据加载和操作功能(如 loader 和…...

Qt Widget类解析与代码注释
#include "widget.h" #include "ui_widget.h"Widget::Widget(QWidget *parent): QWidget(parent), ui(new Ui::Widget) {ui->setupUi(this); }Widget::~Widget() {delete ui; }//解释这串代码,写上注释 当然可以!这段代码是 Qt …...

HTML 列表、表格、表单
1 列表标签 作用:布局内容排列整齐的区域 列表分类:无序列表、有序列表、定义列表。 例如: 1.1 无序列表 标签:ul 嵌套 li,ul是无序列表,li是列表条目。 注意事项: ul 标签里面只能包裹 li…...
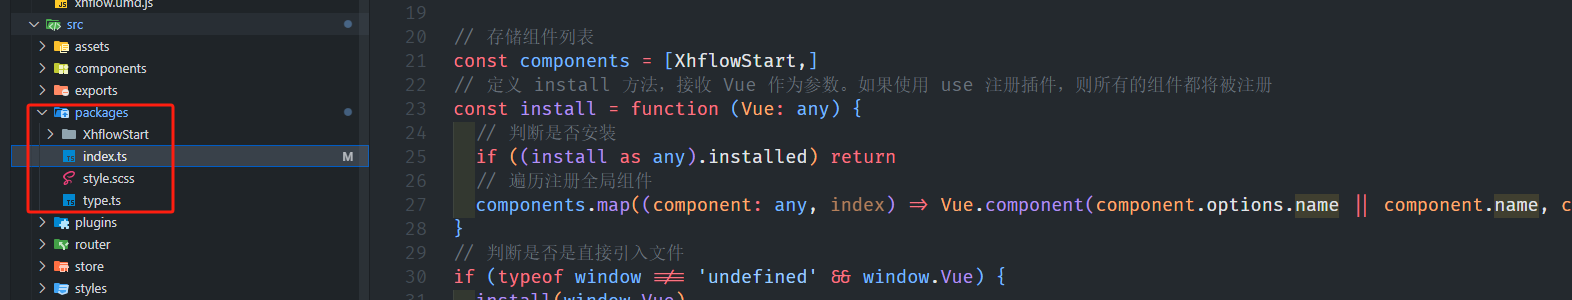
基于当前项目通过npm包形式暴露公共组件
1.package.sjon文件配置 其中xh-flowable就是暴露出去的npm包名 2.创建tpyes文件夹,并新增内容 3.创建package文件夹...
MySQL 8.0 OCP 英文题库解析(十三)
Oracle 为庆祝 MySQL 30 周年,截止到 2025.07.31 之前。所有人均可以免费考取原价245美元的MySQL OCP 认证。 从今天开始,将英文题库免费公布出来,并进行解析,帮助大家在一个月之内轻松通过OCP认证。 本期公布试题111~120 试题1…...

论文笔记——相干体技术在裂缝预测中的应用研究
目录 相关地震知识补充地震数据的认识地震几何属性 相干体算法定义基本原理第一代相干体技术:基于互相关的相干体技术(Correlation)第二代相干体技术:基于相似的相干体技术(Semblance)基于多道相似的相干体…...

在Ubuntu24上采用Wine打开SourceInsight
1. 安装wine sudo apt install wine 2. 安装32位库支持,SourceInsight是32位程序 sudo dpkg --add-architecture i386 sudo apt update sudo apt install wine32:i386 3. 验证安装 wine --version 4. 安装必要的字体和库(解决显示问题) sudo apt install fonts-wqy…...

AGain DB和倍数增益的关系
我在设置一款索尼CMOS芯片时,Again增益0db变化为6DB,画面的变化只有2倍DN的增益,比如10变为20。 这与dB和线性增益的关系以及传感器处理流程有关。以下是具体原因分析: 1. dB与线性增益的换算关系 6dB对应的理论线性增益应为&…...

从 GreenPlum 到镜舟数据库:杭银消费金融湖仓一体转型实践
作者:吴岐诗,杭银消费金融大数据应用开发工程师 本文整理自杭银消费金融大数据应用开发工程师在StarRocks Summit Asia 2024的分享 引言:融合数据湖与数仓的创新之路 在数字金融时代,数据已成为金融机构的核心竞争力。杭银消费金…...
Rust 开发环境搭建
环境搭建 1、开发工具RustRover 或者vs code 2、Cygwin64 安装 https://cygwin.com/install.html 在工具终端执行: rustup toolchain install stable-x86_64-pc-windows-gnu rustup default stable-x86_64-pc-windows-gnu 2、Hello World fn main() { println…...