【图像分割】图像检测(分割、特征提取)、各种特征(面积等)的测量和过滤(Matlab代码实现)
💥💥💞💞欢迎来到本博客❤️❤️💥💥
🏆博主优势:🌞🌞🌞博客内容尽量做到思维缜密,逻辑清晰,为了方便读者。
⛳️座右铭:行百里者,半于九十。
📋📋📋本文目录如下:🎁🎁🎁
目录
💥1 概述
📚2 运行结果
🎉3 参考文献
🌈4 Matlab代码实现

💥1 概述
【图像分割】图像检测(分割、特征提取)、各种特征(面积等)的测量和过滤
本文提供了一个适合初学者的教程,旨在演示图像检测(分割、特征提取)以及各种特征(如面积)的测量和过滤(只提取某些对象)。
首先,该教程介绍了如何找到图像中的所有对象(硬币),然后根据指定的直径过滤结果,筛选出特定直径的对象。通过一个简单的示例,展示了阈值处理、标记和区域属性的基本概念。
对于那些刚开始接触 MATLAB 图像处理功能的同学来说,这个教程是一个很好的起点。在他们深入学习更复杂的算法之前,可以通过这个教程加深对基本概念和技术的理解。
为了完成这个教程,需要安装图像处理工具箱,因为它演示了该工具箱提供的某些功能。同时,教程使用了工具箱自带的一个名为“硬币”的示例图像作为演示对象。
该教程的优点在于,它提供了一种直观和实用的方法,帮助初学者理解如何使用 MATLAB 对图像进行处理和分析。通过学习如何进行图像分割、特征提取和过滤,读者将受益于这些基本概念,并能够应用它们解决更为复杂的图像处理问题。这个教程对于那些有兴趣进一步探索图像处理领域的学生、研究人员和工程师来说,都是一个很好的起点。
📚2 运行结果

部分代码:
% Read in a standard MATLAB demo image of coins (US nickles and dimes, which are 5 cent and 10 cent coins). This image ships with MATLAB.
baseFileName = 'coins.png';
folder = fileparts(which(baseFileName)); % Determine where demo folder is (works with all versions).
fullFileName = fullfile(folder, baseFileName);
fprintf('Full File Name = "%s".\n', fullFileName);
if ~exist(fullFileName, 'file')% It doesn't exist in the current folder.% Look on the search path.if ~exist(baseFileName, 'file')% It doesn't exist on the search path either.% Alert user that we can't find the image.warningMessage = sprintf('Error: the input image file\n%s\nwas not found.\nClick OK to exit the demo.', fullFileName);uiwait(warndlg(warningMessage));fprintf(1, 'Finished running BlobsDemo.m.\n');return;end% Found it on the search path. Construct the file name.fullFileName = baseFileName; % Note: don't prepend the folder.
end
% If we get here, we should have found the image file.
originalImage = imread(fullFileName);
% Check to make sure that it is grayscale, just in case the user substituted their own image.
[rows, columns, numberOfColorChannels] = size(originalImage);
if numberOfColorChannels > 1promptMessage = sprintf('Your image file has %d color channels.\nThis demo was designed for grayscale images.\nDo you want me to convert it to grayscale for you so you can continue?', numberOfColorChannels);button = questdlg(promptMessage, 'Continue', 'Convert and Continue', 'Cancel', 'Convert and Continue');if strcmp(button, 'Cancel')fprintf(1, 'Finished running BlobsDemo.m.\n');return;end% Do the conversion using standard book formulaoriginalImage = rgb2gray(originalImage);
end% Display the grayscale image.
subplot(3, 3, 1);
imshow(originalImage);
% Maximize the figure window.
hFig1 = gcf;
hFig1.Units = 'normalized';
hFig1.WindowState = 'maximized'; % Go to full screen.
hFig1.NumberTitle = 'off'; % Get rid of "Figure 1"
hFig1.Name = 'Demo by Image Analyst'; % Put this into title bar.
% Force it to display RIGHT NOW (otherwise it might not display until it's all done, unless you've stopped at a breakpoint.)
drawnow;
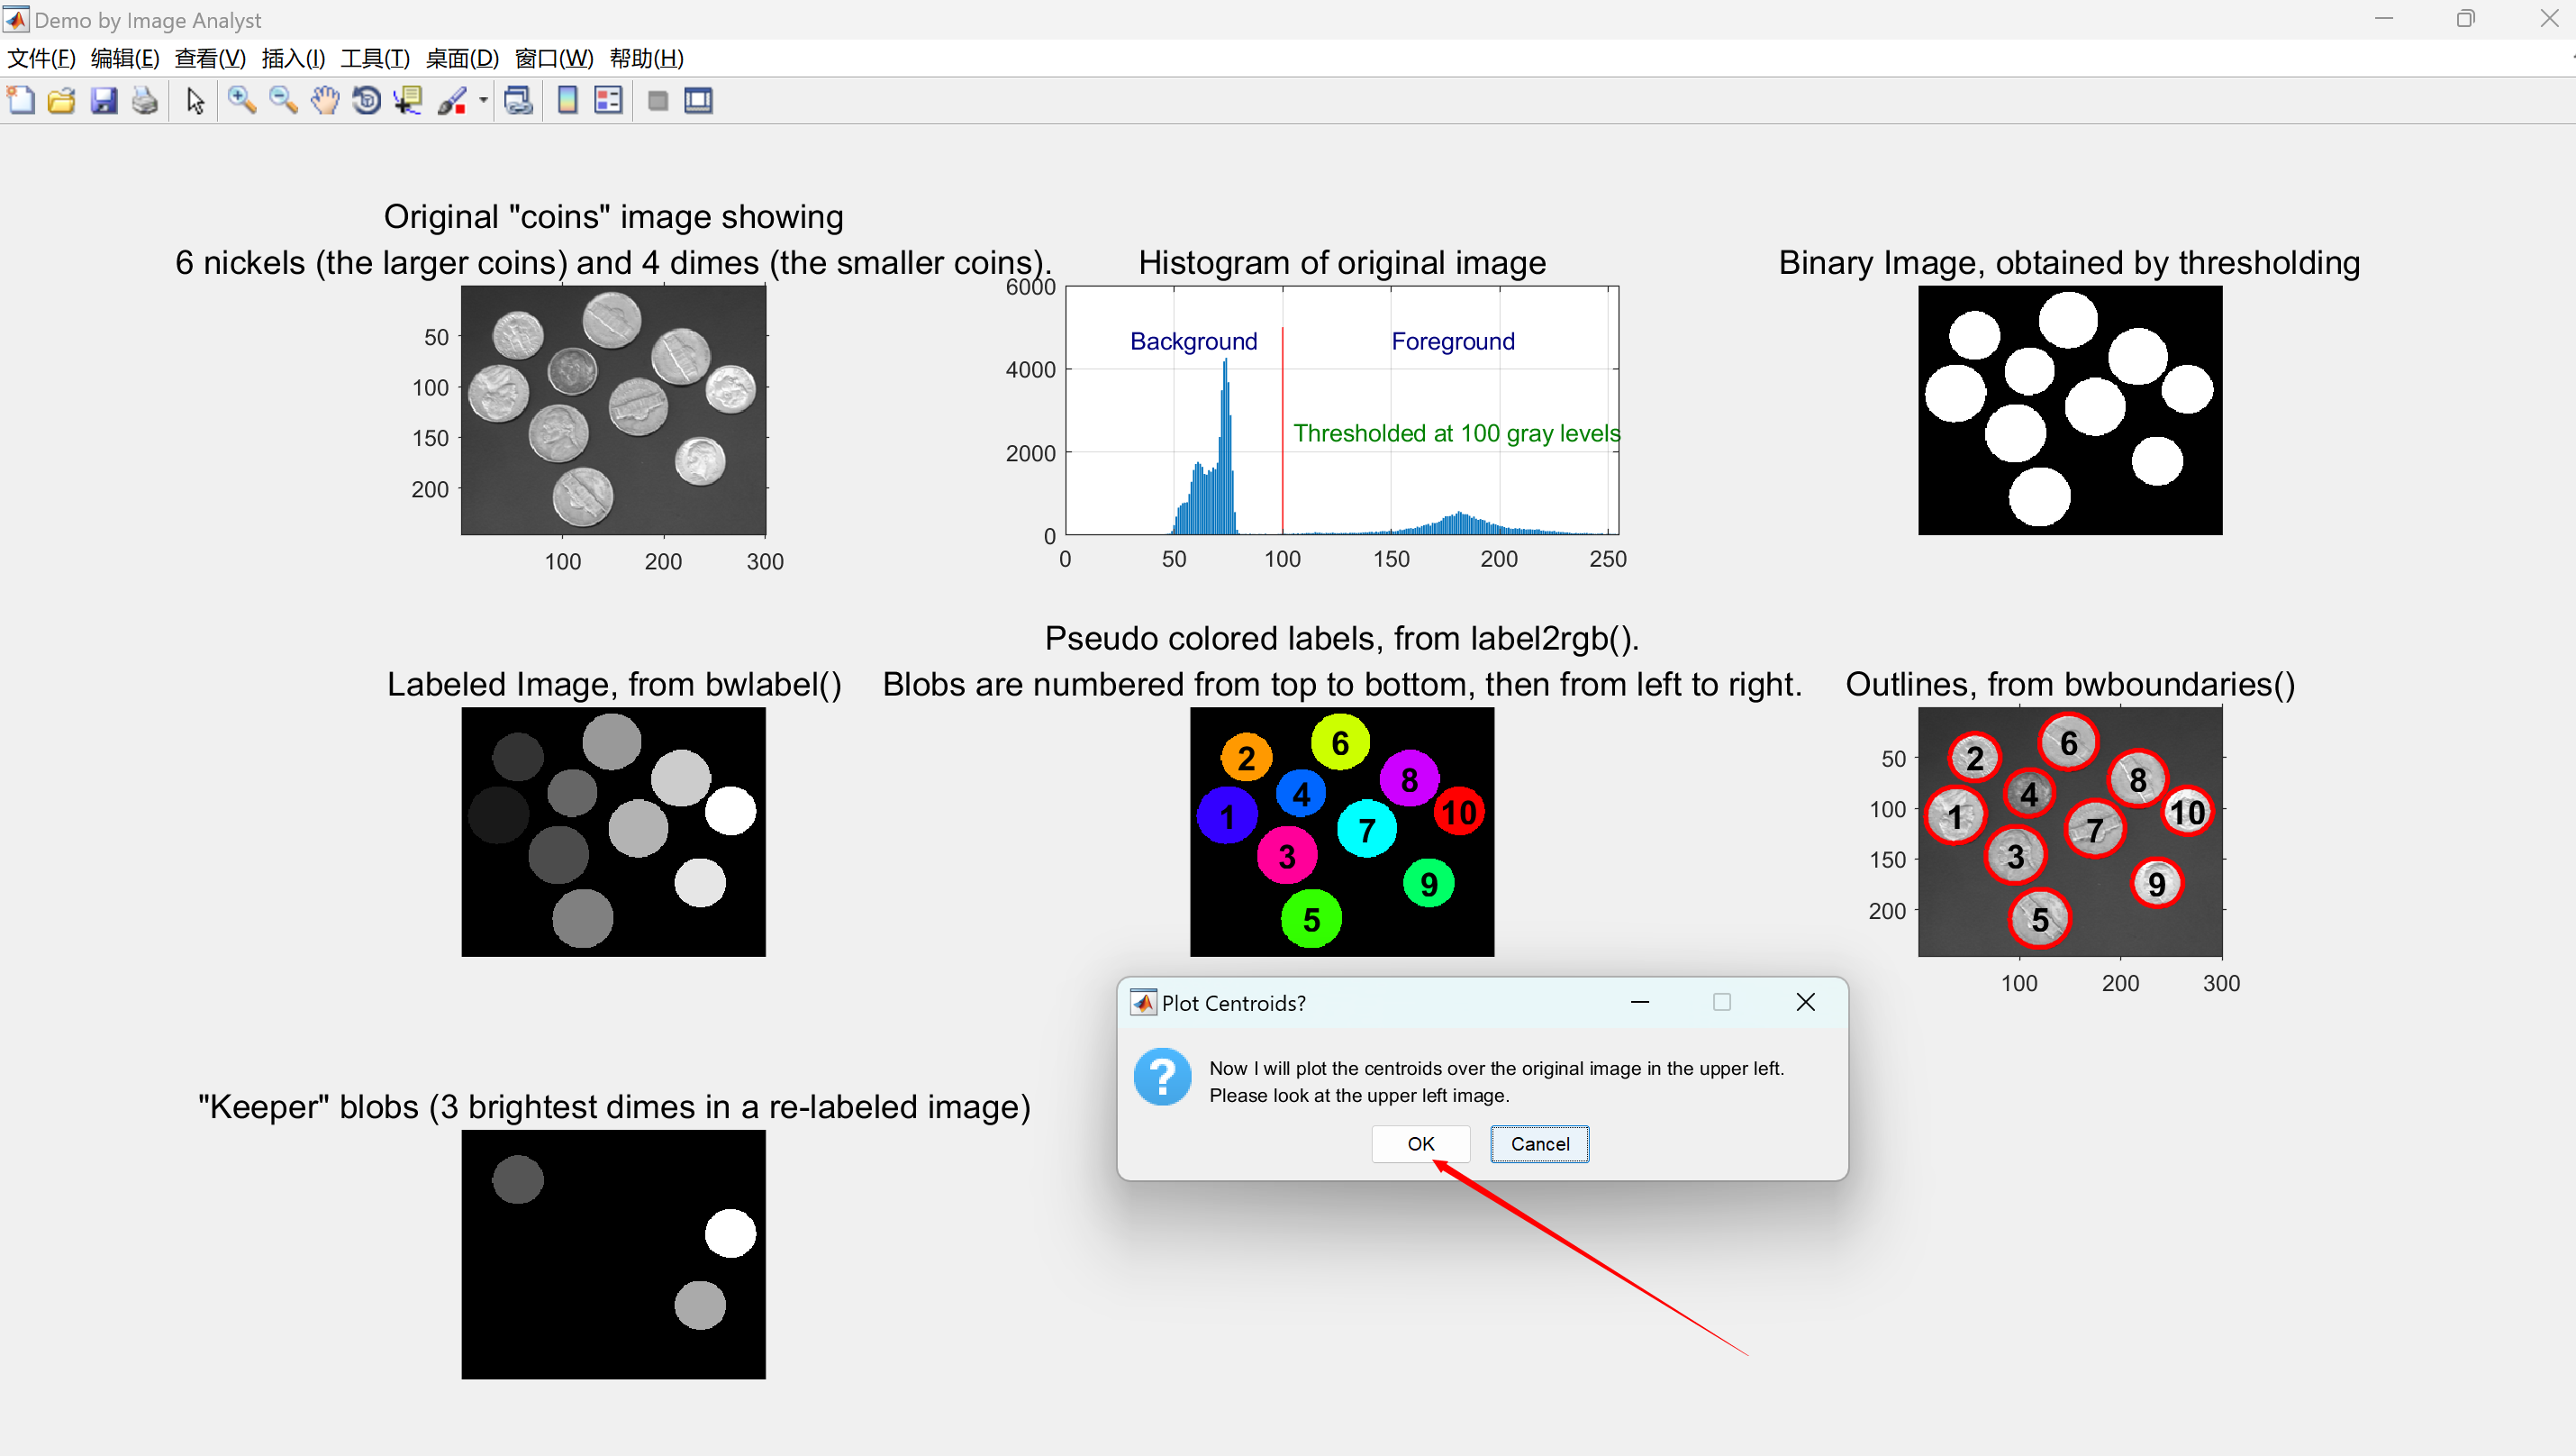
caption = sprintf('Original "coins" image showing\n6 nickels (the larger coins) and 4 dimes (the smaller coins).');
title(caption, 'FontSize', captionFontSize);
axis('on', 'image'); % Make sure image is not artificially stretched because of screen's aspect ratio.% Just for fun, let's get its histogram and display it.
[pixelCount, grayLevels] = imhist(originalImage);
subplot(3, 3, 2);
bar(pixelCount);
title('Histogram of original image', 'FontSize', captionFontSize);
xlim([0 grayLevels(end)]); % Scale x axis manually.
grid on;%------------------------------------------------------------------------------------------------------------------------------------------------------
% Threshold the image to get a binary image (only 0's and 1's) of class "logical."
% Method #1: using im2bw()
% normalizedThresholdValue = 0.4; % In range 0 to 1.
% thresholdValue = normalizedThresholdValue * max(max(originalImage)); % Gray Levels.
% binaryImage = im2bw(originalImage, normalizedThresholdValue); % One way to threshold to binary
% Method #2: using a logical operation.
thresholdValue = 100;
binaryImage = originalImage > thresholdValue; % Bright objects will be chosen if you use >.
% ========== IMPORTANT OPTION ============================================================
% Use < if you want to find dark objects instead of bright objects.
% binaryImage = originalImage < thresholdValue; % Dark objects will be chosen if you use <.% Do a "hole fill" to get rid of any background pixels or "holes" inside the blobs.
binaryImage = imfill(binaryImage, 'holes');% Show the threshold as a vertical red bar on the histogram.
hold on;
maxYValue = ylim;
line([thresholdValue, thresholdValue], maxYValue, 'Color', 'r');
% Place a text label on the bar chart showing the threshold.
annotationText = sprintf('Thresholded at %d gray levels', thresholdValue);
% For text(), the x and y need to be of the data class "double" so let's cast both to double.
text(double(thresholdValue + 5), double(0.5 * maxYValue(2)), annotationText, 'FontSize', 10, 'Color', [0 .5 0]);
text(double(thresholdValue - 70), double(0.94 * maxYValue(2)), 'Background', 'FontSize', 10, 'Color', [0 0 .5]);
text(double(thresholdValue + 50), double(0.94 * maxYValue(2)), 'Foreground', 'FontSize', 10, 'Color', [0 0 .5]);% Display the binary image.
subplot(3, 3, 3);
imshow(binaryImage);
title('Binary Image, obtained by thresholding', 'FontSize', captionFontSize);%------------------------------------------------------------------------------------------------------------------------------------------------------
% Identify individual blobs by seeing which pixels are connected to each other. This is called "Connected Components Labeling".
% Each group of connected pixels will be given a label, a number, to identify it and distinguish it from the other blobs.
% Do connected components labeling with either bwlabel() or bwconncomp().
[labeledImage, numberOfBlobs] = bwlabel(binaryImage, 8); % Label each blob so we can make measurements of it
% labeledImage is an integer-valued image where all pixels in the blobs have values of 1, or 2, or 3, or ... etc.
subplot(3, 3, 4);
imshow(labeledImage, []); % Show the gray scale image.
title('Labeled Image, from bwlabel()', 'FontSize', captionFontSize);
drawnow;% Let's assign each blob a different color to visually show the user the distinct blobs.
coloredLabels = label2rgb (labeledImage, 'hsv', 'k', 'shuffle'); % pseudo random color labels
% coloredLabels is an RGB image. We could have applied a colormap instead (but only with R2014b and later)
subplot(3, 3, 5);
imshow(coloredLabels);
axis image; % Make sure image is not artificially stretched because of screen's aspect ratio.
caption = sprintf('Pseudo colored labels, from label2rgb().\nBlobs are numbered from top to bottom, then from left to right.');
title(caption, 'FontSize', captionFontSize);%======================================================================================================================================================
% MAIN PART IS RIGHT HERE!!!
% Get all the blob properties.
props = regionprops(labeledImage, originalImage, 'all');
% Or, if you want, you can ask for only a few specific measurements. This will be faster since we don't have to compute everything.
% props = regionprops(labeledImage, originalImage, 'MeanIntensity', 'Area', 'Perimeter', 'Centroid', 'EquivDiameter');
numberOfBlobs = numel(props); % Will be the same as we got earlier from bwlabel().
%======================================================================================================================================================%------------------------------------------------------------------------------------------------------------------------------------------------------
% PLOT BOUNDARIES.
% Plot the borders of all the coins on the original grayscale image using the coordinates returned by bwboundaries().
% bwboundaries() returns a cell array, where each cell contains the row/column coordinates for an object in the image.
subplot(3, 3, 6);
imshow(originalImage);
title('Outlines, from bwboundaries()', 'FontSize', captionFontSize);
axis('on', 'image'); % Make sure image is not artificially stretched because of screen's aspect ratio.
% Here is where we actually get the boundaries for each blob.
boundaries = bwboundaries(binaryImage); % Note: this is a cell array with several boundaries -- one boundary per cell.
% boundaries is a cell array - one cell for each blob.
% In each cell is an N-by-2 list of coordinates in a (row, column) format. Note: NOT (x,y).
% Column 1 is rows, or y. Column 2 is columns, or x.
numberOfBoundaries = size(boundaries, 1); % Count the boundaries so we can use it in our for loop
% Here is where we actually plot the boundaries of each blob in the overlay.
hold on; % Don't let boundaries blow away the displayed image.
for k = 1 : numberOfBoundariesthisBoundary = boundaries{k}; % Get boundary for this specific blob.x = thisBoundary(:,2); % Column 2 is the columns, which is x.y = thisBoundary(:,1); % Column 1 is the rows, which is x.plot(x, y, 'r-', 'LineWidth', 2); % Plot boundary in red.
end
hold off;%------------------------------------------------------------------------------------------------------------------------------------------------------
% Print out the measurements to the command window, and display blob numbers on the image.
textFontSize = 14; % Used to control size of "blob number" labels put atop the image.
% Print header line in the command window.
fprintf(1,'Blob # Mean Intensity Area Perimeter Centroid Diameter\n');
% Extract all the mean diameters into an array.
% The "diameter" is the "Equivalent Circular Diameter", which is the diameter of a circle with the same number of pixels as the blob.
% Enclosing in brackets is a nice trick to concatenate all the values from all the structure fields (every structure in the props structure array).
blobECD = [props.EquivDiameter];
% Loop over all blobs printing their measurements to the command window.
for k = 1 : numberOfBlobs % Loop through all blobs.% Find the individual measurements of each blob. They are field of each structure in the props strucutre array.% You could use the bracket trick (like with blobECD above) OR you can get the value from the field of this particular structure.% I'm showing you both ways and you can use the way you like best.meanGL = props(k).MeanIntensity; % Get average intensity.blobArea = props(k).Area; % Get area.blobPerimeter = props(k).Perimeter; % Get perimeter.blobCentroid = props(k).Centroid; % Get centroid one at a time% Now do the printing of this blob's measurements to the command window.fprintf(1,'#%2d %17.1f %11.1f %8.1f %8.1f %8.1f % 8.1f\n', k, meanGL, blobArea, blobPerimeter, blobCentroid, blobECD(k));% Put the "blob number" labels on the grayscale image that is showing the red boundaries on it.text(blobCentroid(1), blobCentroid(2), num2str(k), 'FontSize', textFontSize, 'FontWeight', 'Bold', 'HorizontalAlignment', 'center', 'VerticalAlignment', 'middle');
end%------------------------------------------------------------------------------------------------------------------------------------------------------
% Now, I'll show you a way to get centroids into an N -by-2 array directly from props,
% rather than accessing them as a field of the props strcuture array.
% We can get the centroids of ALL the blobs into 2 arrays,
% one for the centroid x values and one for the centroid y values.
allBlobCentroids = vertcat(props.Centroid); % A 10 row by 2 column array of (x,y) centroid coordinates.
centroidsX = allBlobCentroids(:, 1); % Extract out the centroid x values into their own vector.
centroidsY = allBlobCentroids(:, 2); % Extract out the centroid y values into their own vector.
% Put the labels on the rgb labeled image also.
subplot(3, 3, 5);
for k = 1 : numberOfBlobs % Loop through all blobs.% Place the blob label number at the centroid of the blob.text(centroidsX(k), centroidsY(k), num2str(k), 'FontSize', textFontSize, 'FontWeight', 'Bold', 'HorizontalAlignment', 'center', 'VerticalAlignment', 'middle');
end%------------------------------------------------------------------------------------------------------------------------------------------------------
% Now I'll demonstrate how to select certain blobs based using the ismember() function and extract them into new subimages.
% Let's say that we wanted to find only those blobs
% with an intensity between 150 and 220 and an area less than 2000 pixels.
% This would give us the three brightest dimes (the smaller coin type).
allBlobIntensities = [props.MeanIntensity];
allBlobAreas = [props.Area];
subplot(3, 3, 7);
histogram(allBlobAreas);
% Get a list of the blobs that meet our criteria and we need to keep.
% These will be logical indices - lists of true or false depending on whether the feature meets the criteria or not.
% for example [1, 0, 0, 1, 1, 0, 1, .....]. Elements 1, 4, 5, 7, ... are true, others are false.
allowableIntensityIndexes = (allBlobIntensities > 150) & (allBlobIntensities < 220);
allowableAreaIndexes = allBlobAreas < 2000; % Take the small objects.
% Now let's get actual indexes, rather than logical indexes, of the features that meet the criteria.
% for example [1, 4, 5, 7, .....] to continue using the example from above.
keeperIndexes = find(allowableIntensityIndexes & allowableAreaIndexes);
% Extract only those blobs that meet our criteria, and
% eliminate those blobs that don't meet our criteria.
% Note how we use ismember() to do this. Result will be an image - the same as labeledImage but with only the blobs listed in keeperIndexes in it.
keeperBlobsImage = ismember(labeledImage, keeperIndexes);
% Re-label with only the keeper blobs kept.
labeledDimeImage = bwlabel(keeperBlobsImage, 8); % Label each blob so we can make measurements of it
% Now we're done. We have a labeled image of blobs that meet our specified criteria.
subplot(3, 3, 7);
imshow(labeledDimeImage, []);
axis image;
title('"Keeper" blobs (3 brightest dimes in a re-labeled image)', 'FontSize', captionFontSize);
elapsedTime = toc;
fprintf('Blob detection and measurement took %.3f seconds.\n', elapsedTime)%------------------------------------------------------------------------------------------------------------------------------------------------------
% Plot the centroids in the overlay above the original image in the upper left axes.
% Dimes will have a red cross, nickels will have a blue X.
message = sprintf('Now I will plot the centroids over the original image in the upper left.\nPlease look at the upper left image.');
reply = questdlg(message, 'Plot Centroids?', 'OK', 'Cancel', 'Cancel');
% Note: reply will = '' for Upper right X, 'OK' for OK, and 'Cancel' for Cancel.
if strcmpi(reply, 'Cancel')return;
end
subplot(3, 3, 1);
hold on; % Don't blow away image.
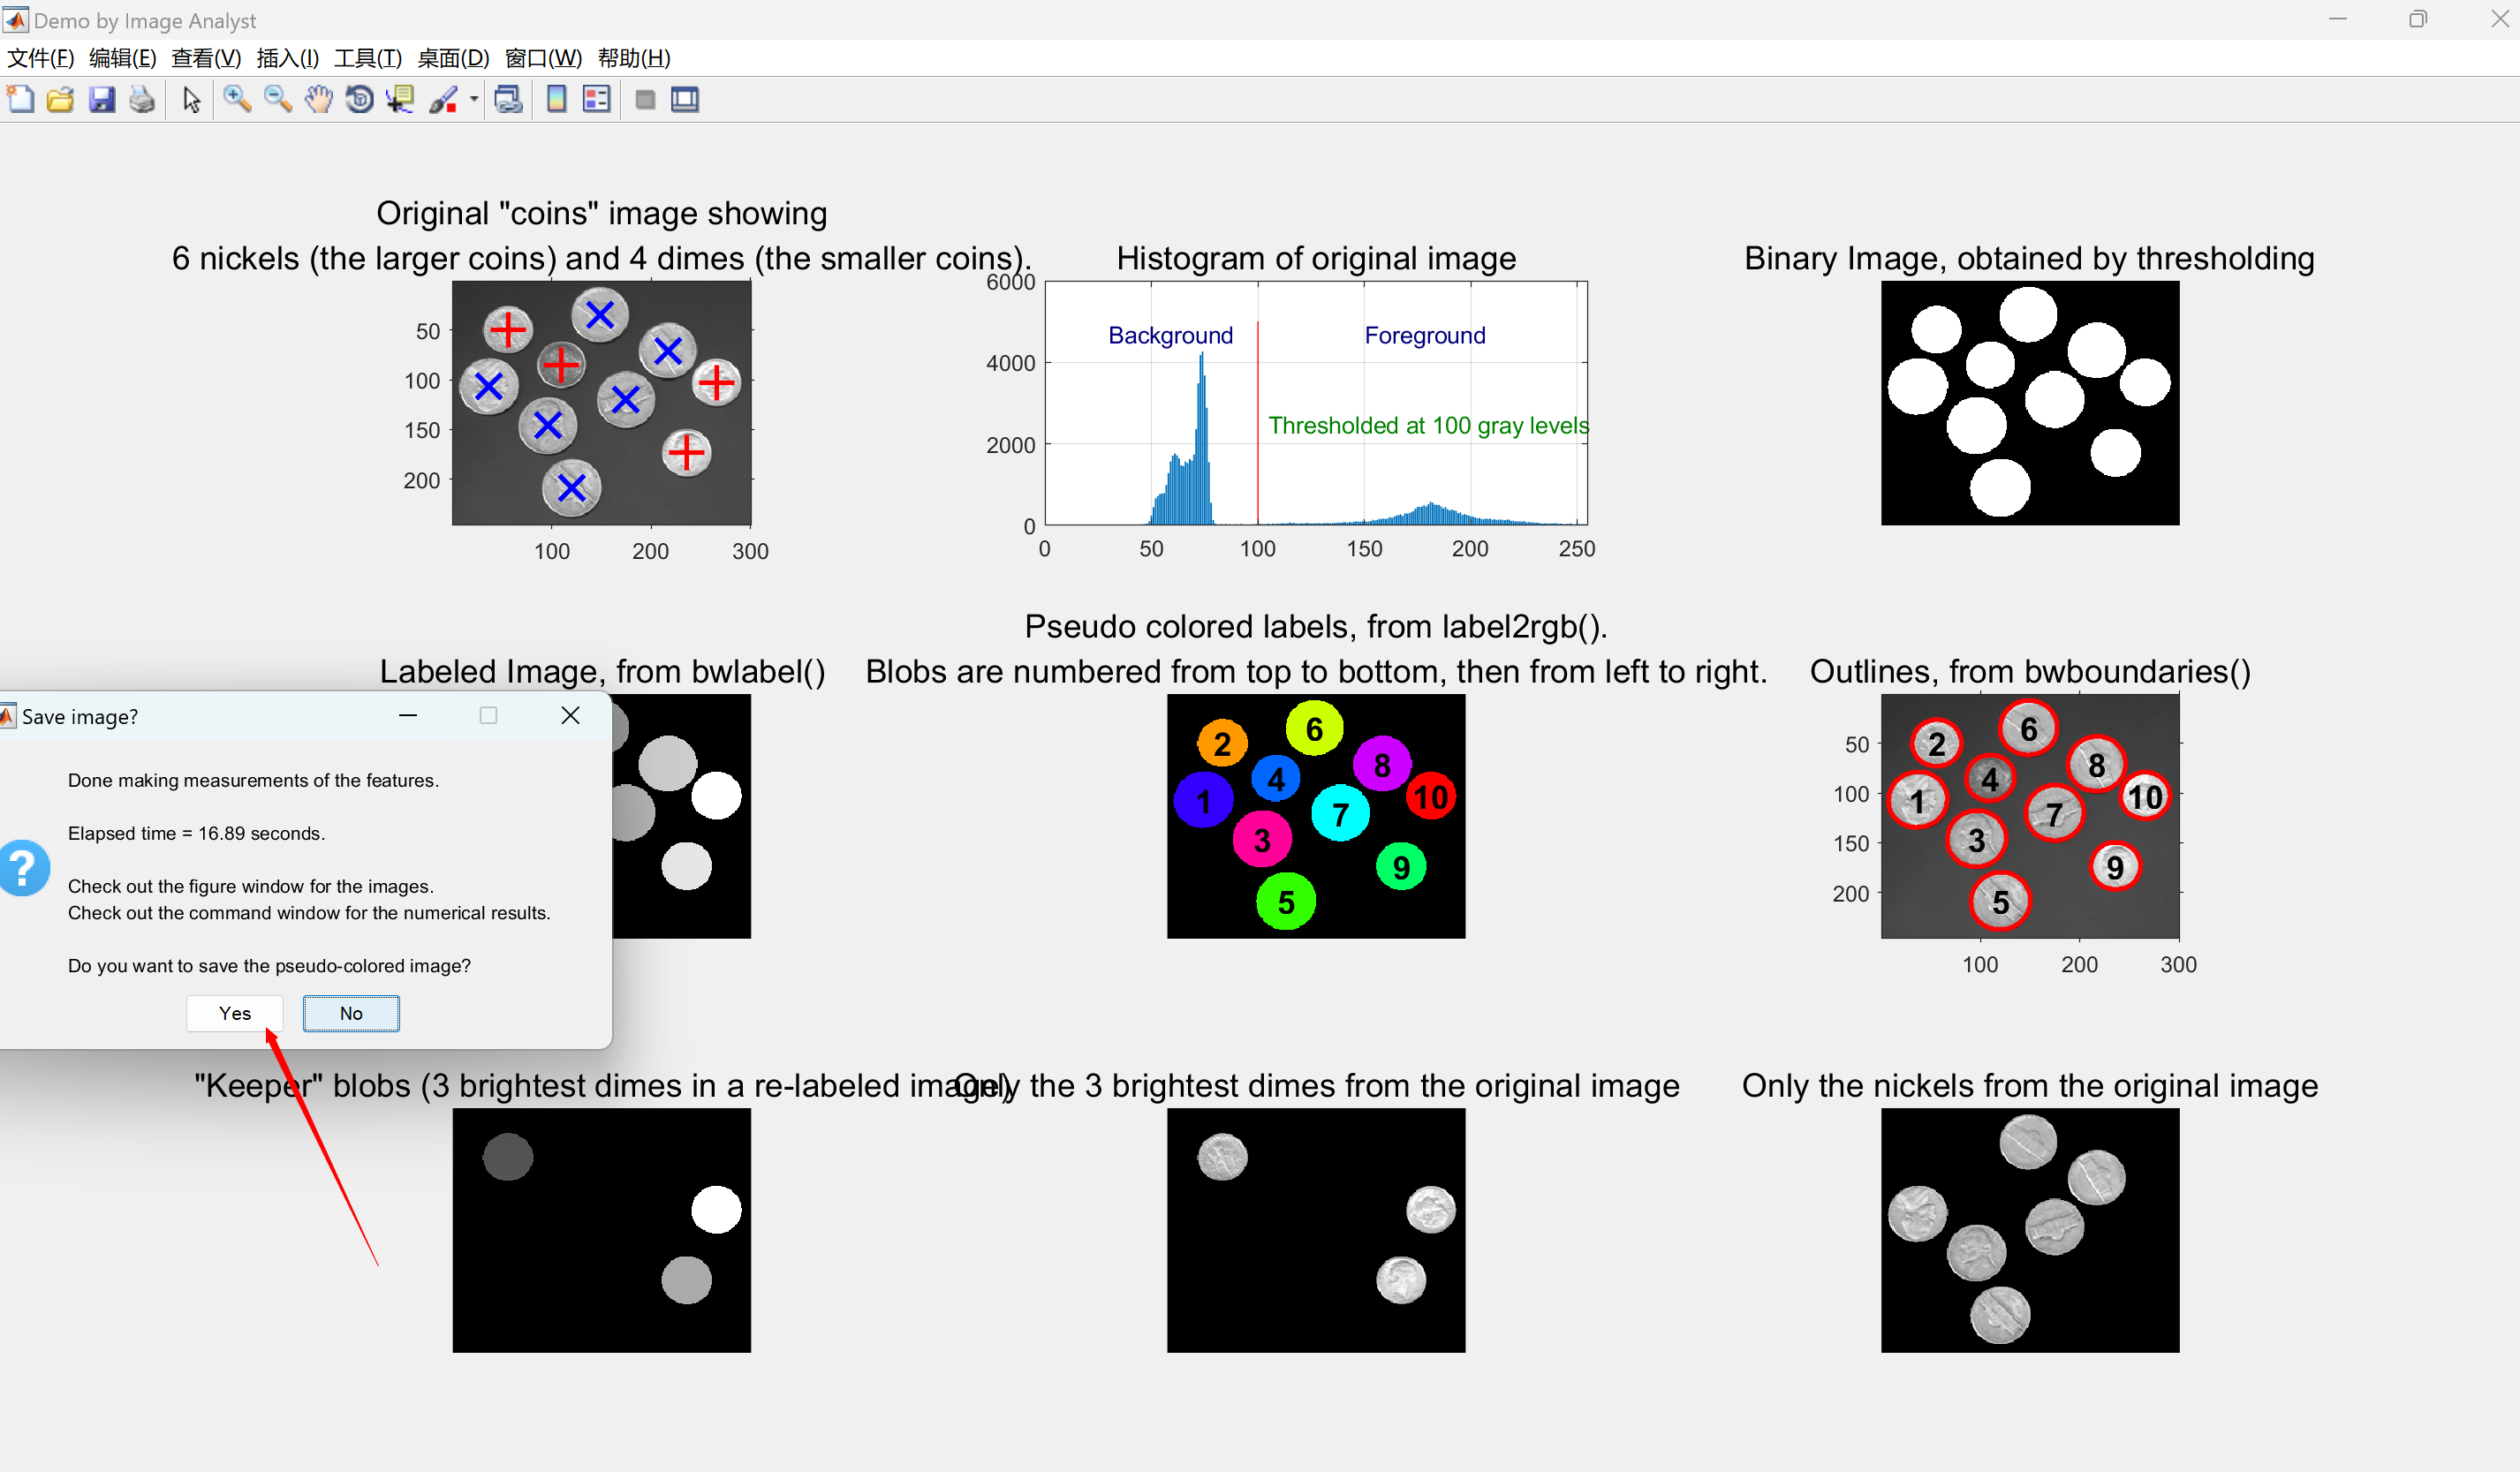
for k = 1 : numberOfBlobs % Loop through all keeper blobs.% Identify if blob #k is a dime or nickel.itsADime = allBlobAreas(k) < 2200; % Dimes are small.if itsADime% Plot dimes with a red +.plot(centroidsX(k), centroidsY(k), 'r+', 'MarkerSize', 15, 'LineWidth', 2);else% Plot nickels with a blue x.plot(centroidsX(k), centroidsY(k), 'bx', 'MarkerSize', 15, 'LineWidth', 2);end
end%------------------------------------------------------------------------------------------------------------------------------------------------------
% Now use the keeper blobs as a mask on the original image so we will get a masked gray level image.
% This will keep the regions in the mask as original but erase (blacken) everything else (outside of the mask regions).
% This will let us display the original image in the regions of the keeper blobs.
maskedImageDime = originalImage; % Simply a copy at first.
maskedImageDime(~keeperBlobsImage) = 0; % Set all non-keeper pixels to zero.
subplot(3, 3, 8);
imshow(maskedImageDime);
axis image;
title('Only the 3 brightest dimes from the original image', 'FontSize', captionFontSize);%------------------------------------------------------------------------------------------------------------------------------------------------------
% Now let's get the nickels (the larger coin type).
keeperIndexes = find(allBlobAreas > 2000); % Take the larger objects.
% Note how we use ismember to select the blobs that meet our criteria. Get a binary image with only nickel regions present.
nickelBinaryImage = ismember(labeledImage, keeperIndexes);
% Let's get the nickels from the original grayscale image, with the other non-nickel pixels blackened.
% In other words, we will create a "masked" image.
maskedImageNickel = originalImage; % Simply a copy at first.
maskedImageNickel(~nickelBinaryImage) = 0; % Set all non-nickel pixels to zero.
subplot(3, 3, 9);
imshow(maskedImageNickel, []);
axis image;
title('Only the nickels from the original image', 'FontSize', captionFontSize);%------------------------------------------------------------------------------------------------------------------------------------------------------
% WE'RE BASICALLY DONE WITH THE DEMO NOW.
elapsedTime = toc;
% Alert user that the demo is done and give them the option to save an image.
message = sprintf('Done making measurements of the features.\n\nElapsed time = %.2f seconds.', elapsedTime);
message = sprintf('%s\n\nCheck out the figure window for the images.\nCheck out the command window for the numerical results.', message);
message = sprintf('%s\n\nDo you want to save the pseudo-colored image?', message);
reply = questdlg(message, 'Save image?', 'Yes', 'No', 'No');
% Note: reply will = '' for Upper right X, 'Yes' for Yes, and 'No' for No.
if strcmpi(reply, 'Yes')% Ask user for a filename.FilterSpec = {'*.PNG', 'PNG Images (*.png)'; '*.tif', 'TIFF images (*.tif)'; '*.*', 'All Files (*.*)'};DialogTitle = 'Save image file name';% Get the default filename. Make sure it's in the folder where this m-file lives.% (If they run this file but the cd is another folder then pwd will show that folder, not this one.thisFile = mfilename('fullpath');[thisFolder, baseFileName, ext] = fileparts(thisFile);DefaultName = sprintf('%s/%s.tif', thisFolder, baseFileName);[fileName, specifiedFolder] = uiputfile(FilterSpec, DialogTitle, DefaultName);if fileName ~= 0% Parse what they actually specified.[folder, baseFileName, ext] = fileparts(fileName);% Create the full filename, making sure it has a tif filename.fullImageFileName = fullfile(specifiedFolder, [baseFileName '.tif']);% Save the labeled image as a tif image.imwrite(uint8(coloredLabels), fullImageFileName);% Just for fun, read image back into the imtool utility to demonstrate that tool.tifimage = imread(fullImageFileName);imtool(tifimage, []);end
end%------------------------------------------------------------------------------------------------------------------------------------------------------
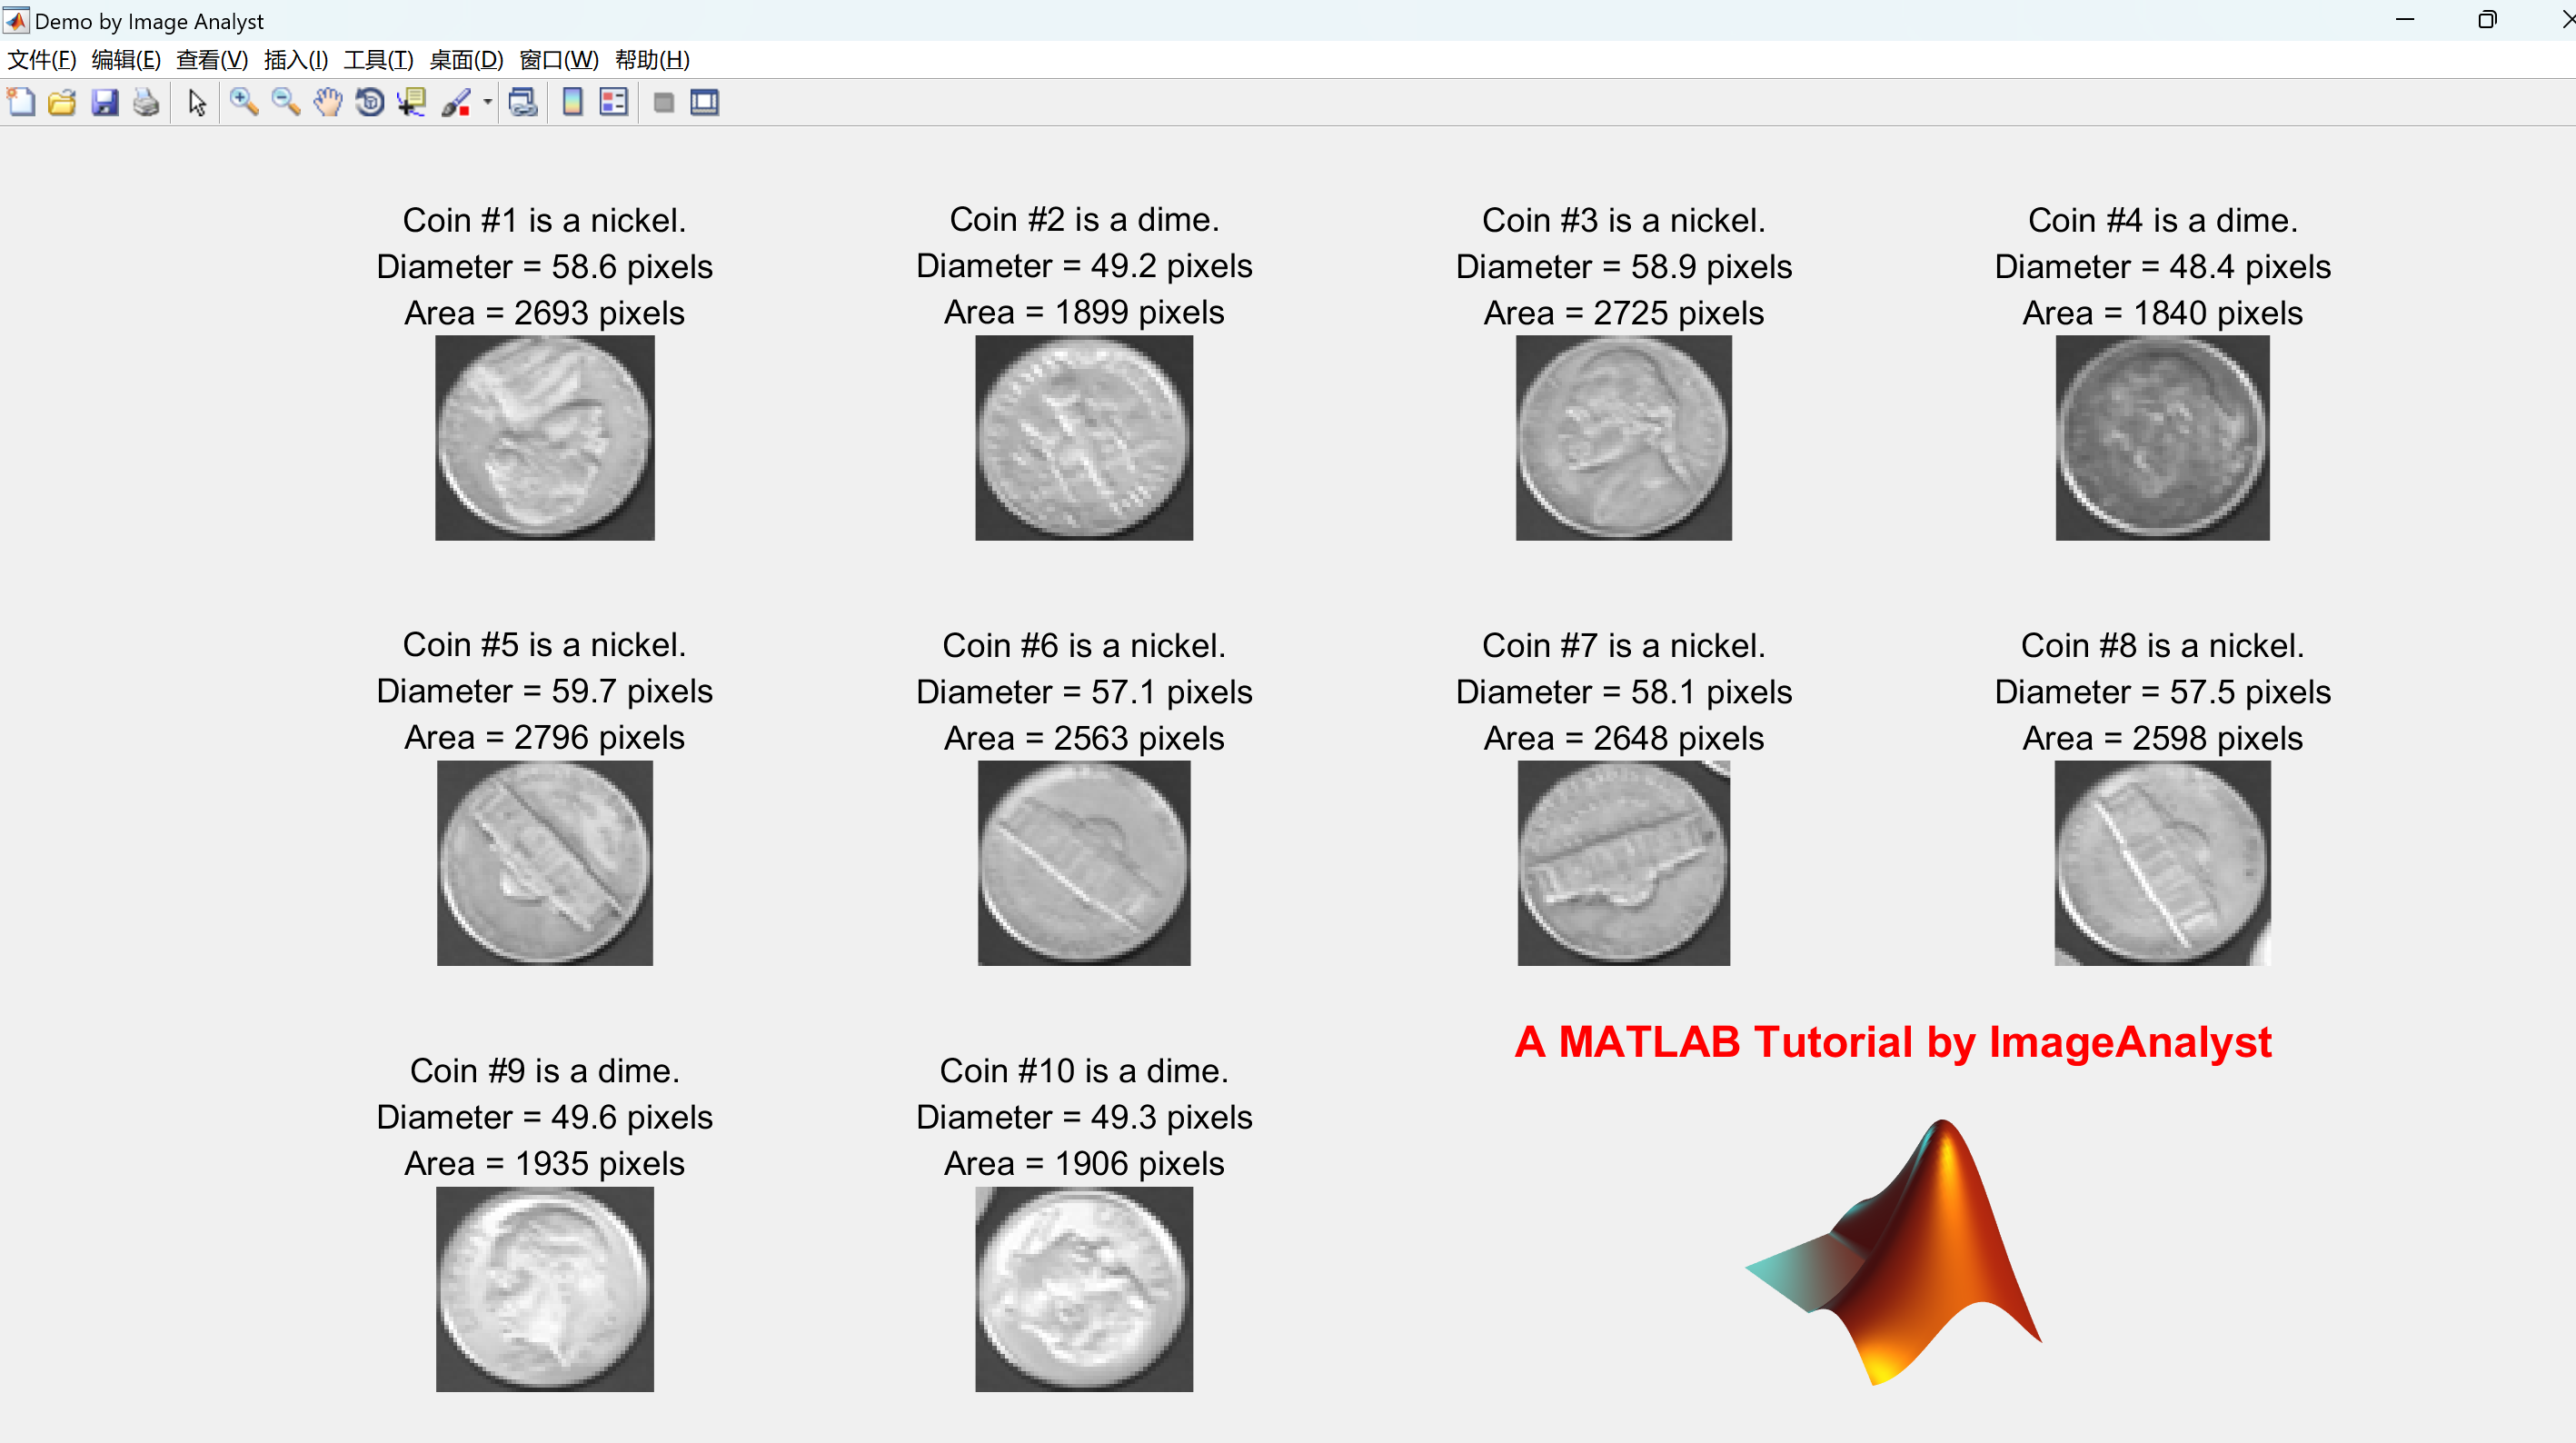
% OPTIONAL : CROP EACH COIN OUT TO A SEPARATE SUB-IMAGE ON A NEW FIGURE.
message = sprintf('Would you like to crop out each coin to individual images?');
reply = questdlg(message, 'Extract Individual Images?', 'Yes', 'No', 'Yes');
% Note: reply will = '' for Upper right X, 'Yes' for Yes, and 'No' for No.
if strcmpi(reply, 'Yes')% Maximize the figure window.hFig2 = figure; % Create a new figure window.hFig2.Units = 'normalized';hFig2.WindowState = 'maximized'; % Go to full screen.hFig2.NumberTitle = 'off'; % Get rid of "Figure 1"hFig2.Name = 'Demo by Image Analyst'; % Put this into title bar.for k = 1 : numberOfBlobs % Loop through all blobs.% Find the bounding box of each blob.thisBlobsBoundingBox = props(k).BoundingBox; % Get list of pixels in current blob.% Extract out this coin into it's own image.subImage = imcrop(originalImage, thisBlobsBoundingBox);% Determine if it's a dime (small) or a nickel (large coin).if props(k).Area > 2200coinType = 'nickel';elsecoinType = 'dime';end% Display the image with informative caption.subplot(3, 4, k);imshow(subImage);caption = sprintf('Coin #%d is a %s.\nDiameter = %.1f pixels\nArea = %d pixels', ...k, coinType, blobECD(k), props(k).Area);title(caption, 'FontSize', textFontSize);end%------------------------------------------------------------------------------------------------------------------------------------------------------% Display the MATLAB "peaks" logo.logoSubplot = subplot(3, 4, 11:12);caption = sprintf('A MATLAB Tutorial by ImageAnalyst');text(0.5,1.15, caption, 'Color','r', 'FontSize', 18, 'FontWeight','b', 'HorizontalAlignment', 'center', 'VerticalAlignment', 'middle') ;positionOfLowerRightPlot = get(logoSubplot, 'position');L = 40*membrane(1,25);logoax = axes('CameraPosition', [-193.4013, -265.1546, 220.4819],...'Box', 'off', ...'CameraTarget',[26, 26, 10], ...'CameraUpVector',[0, 0, 1], ...'CameraViewAngle',9.5, ...'DataAspectRatio', [1, 1, .9],...'Position', positionOfLowerRightPlot, ...'Visible','off', ...'XLim',[1, 51], ...'YLim',[1, 51], ...'ZLim',[-13, 40], ...'parent', gcf);axis(logoSubplot, 'off');s = surface(L, ...'EdgeColor','none', ...'FaceColor',[0.9, 0.2, 0.2], ...'FaceLighting','phong', ...'AmbientStrength',0.3, ...'DiffuseStrength',0.6, ...'Clipping','off',...'BackFaceLighting','lit', ...'SpecularStrength',1, ...'SpecularColorReflectance',1, ...'SpecularExponent',7, ...'Tag','TheMathWorksLogo', ...'parent',logoax);l1 = light('Position',[40, 100, 20], ...
% OPTIONAL : CROP EACH COIN OUT TO A SEPARATE SUB-IMAGE ON A NEW FIGURE.
message = sprintf('Would you like to crop out each coin to individual images?');
reply = questdlg(message, 'Extract Individual Images?', 'Yes', 'No', 'Yes');
% Note: reply will = '' for Upper right X, 'Yes' for Yes, and 'No' for No.
if strcmpi(reply, 'Yes')
% Maximize the figure window.
hFig2 = figure; % Create a new figure window.
hFig2.Units = 'normalized';
hFig2.WindowState = 'maximized'; % Go to full screen.
hFig2.NumberTitle = 'off'; % Get rid of "Figure 1"
hFig2.Name = 'Demo by Image Analyst'; % Put this into title bar.
for k = 1 : numberOfBlobs % Loop through all blobs.
% Find the bounding box of each blob.
thisBlobsBoundingBox = props(k).BoundingBox; % Get list of pixels in current blob.
% Extract out this coin into it's own image.
subImage = imcrop(originalImage, thisBlobsBoundingBox);
% Determine if it's a dime (small) or a nickel (large coin).
if props(k).Area > 2200
coinType = 'nickel';
else
coinType = 'dime';
end
% Display the image with informative caption.
subplot(3, 4, k);
imshow(subImage);
caption = sprintf('Coin #%d is a %s.\nDiameter = %.1f pixels\nArea = %d pixels', ...
k, coinType, blobECD(k), props(k).Area);
title(caption, 'FontSize', textFontSize);
end
%------------------------------------------------------------------------------------------------------------------------------------------------------
% Display the MATLAB "peaks" logo.
logoSubplot = subplot(3, 4, 11:12);
caption = sprintf('A MATLAB Tutorial by ImageAnalyst');
text(0.5,1.15, caption, 'Color','r', 'FontSize', 18, 'FontWeight','b', 'HorizontalAlignment', 'center', 'VerticalAlignment', 'middle') ;
positionOfLowerRightPlot = get(logoSubplot, 'position');
L = 40*membrane(1,25);
logoax = axes('CameraPosition', [-193.4013, -265.1546, 220.4819],...
'Box', 'off', ...
'CameraTarget',[26, 26, 10], ...
'CameraUpVector',[0, 0, 1], ...
'CameraViewAngle',9.5, ...
'DataAspectRatio', [1, 1, .9],...
'Position', positionOfLowerRightPlot, ...
🎉3 参考文献
文章中一些内容引自网络,会注明出处或引用为参考文献,难免有未尽之处,如有不妥,请随时联系删除。
[1]马寅.基于CCD的图像特征提取与识别[D].东北大学,2012.DOI:10.7666/d.J0120301.
[2]王妞,康辉英.基于图像检测的船舶特征分割与提取优化算法[J].舰船科学技术, 2018(4X):3.DOI:CNKI:SUN:JCKX.0.2018-08-049.
[3]尹聪.彩色图像人脸检测与特征提取认证[J].信息技术与信息化, 2009.DOI:JournalArticle/5af35bd8c095d718d80b8d86.
[4]罗文辉,王三武.基于面积和结构特征的水表图像二步分割方法[J].武汉理工大学学报:信息与管理工程版, 2006, 28(5):4.DOI:10.3963/j.issn.1007-144X.2006.05.014.
🌈4 Matlab代码实现
相关文章:
【图像分割】图像检测(分割、特征提取)、各种特征(面积等)的测量和过滤(Matlab代码实现)
💥💥💞💞欢迎来到本博客❤️❤️💥💥 🏆博主优势:🌞🌞🌞博客内容尽量做到思维缜密,逻辑清晰,为了方便读者。 ⛳️座右铭&a…...

Linux内核存在缺陷发行陷困境
导读Linux内核已经修复了本地特权esclation缺陷,但是几个上游分发版本例如Red Hat,Canonical和Debian发行版尚未发布更新。管理员应计划减轻Linux服务器和工作站本身的漏洞,并监控其更新计划的发布。 内核缺陷仍存在 在Linux内核4.10.1(CVE-…...
通过java向jar写入新文件
文章目录 原始需求分析实施步骤引入依赖核心编码运行效果 原始需求 有网友提问: 我想在程序中动态地向同一个jar包中添加文件,比如,我的可执行jar包是test.jar,我要在它运行时生成一些xml文件并将这些文件添加到test.jar中,请问如何实现&…...
uni-app_消息推送_华为厂商_unipush离线消息推送
文章目录 一、创建项目二、生成签名证书三、开通 unipush 推送服务四、客户端集成四、制作自定义调试基座五、开发者中心后台Web页面推送(仅支持在线推送)六、离线消息推送1、创建华为开发者账号2、开通推送服务3、创建项目4、添加应用5、添加SHA256证书…...
单元测试框架-Pytest(简单学习)
单元测试框架-Pytest Pytest是基于Python语言的单元测试框架,也是一个命令行的工具,比 unittest 测试框架更灵活。具有以下特点: 入门简单,易上手,官方文档丰富而且使用广泛,有大量的参数例子。 unittest…...
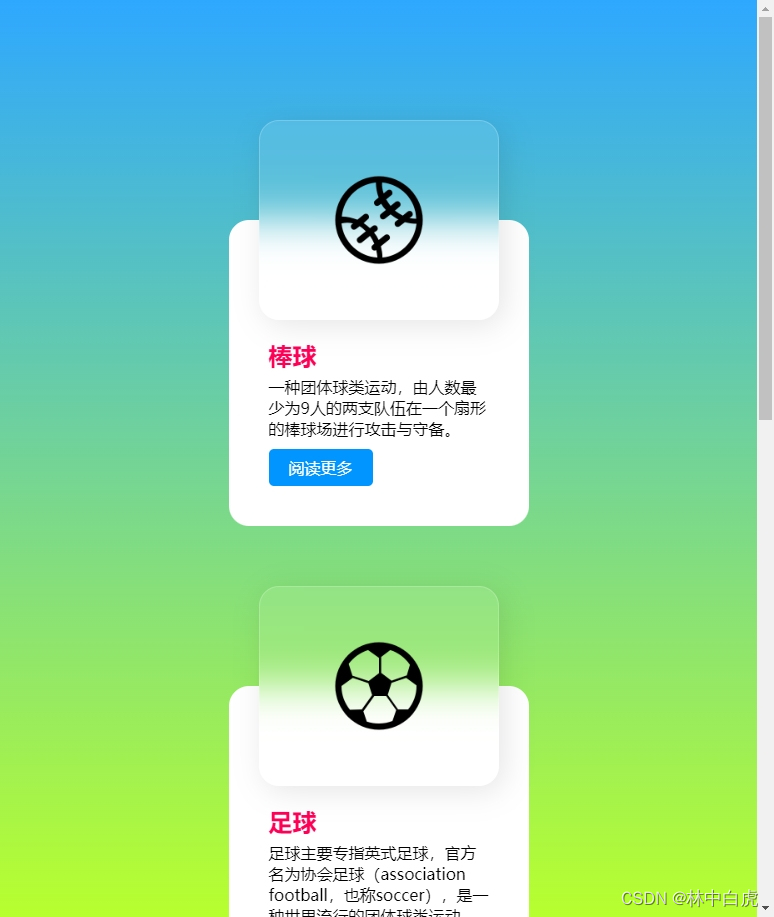
毛玻璃态卡片悬停效果
效果展示 页面结构组成 页面的组成部分主要是卡片。其中卡片的组成部分主要是包括了图片和详情。 卡片的动效是鼠标悬停在卡片上时,图片会移动到左侧,并且图片是毛玻璃效果。所以我们在布局的时候图片会采用绝对布局。而详情则是基础布局。 CSS3 知识…...
【面试经典150 | 数组】除自身以外数组的乘积
文章目录 写在前面Tag题目来源题目解读解题思路方法一:记录左右乘积空间优化 写在最后 写在前面 本专栏专注于分析与讲解【面试经典150】算法,两到三天更新一篇文章,欢迎催更…… 专栏内容以分析题目为主,并附带一些对于本题涉及到…...
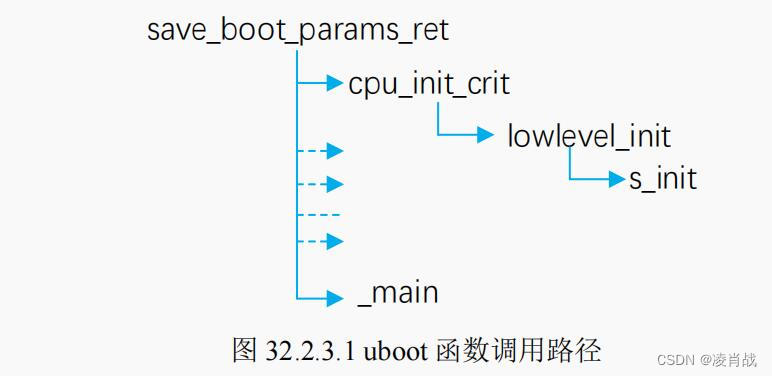
uboot启动流程-涉及s_init汇编函数
一. uboot启动涉及函数 本文简单分析uboot启动流程中,涉及的汇编函数: lowlevel_init函数调用的函数:s_init 函数 save_boot_params_ret函数调用的函数: _main 函数 本文继上一篇文章的学习,地址如下:…...
)
单例模式详解及5种实现方式 (设计模式 一)
基本概念 在软件开发中,单例模式是一种常见的设计模式,用于确保一个类只有一个实例,并提供全局访问点。单例模式在需要确保只有一个对象实例存在的场景中非常有用,例如数据库连接、线程池、日志记录器等。 单例模式的核心思想是通…...
)
面试系列 - Java常见算法(一)
目录 一、排序算法 1、冒泡排序(Bubble Sort): 2、快速排序(Quick Sort): 二、查找算法 1、二分查找(Binary Search): 三、 图算法 1、深度优先搜索(De…...
Sentinel学习(1)——CAP理论,微服务中的雪崩问题,和Hystix的解决方案 Sentinel的相关概念 + 下载运行
前言 Sentinel 是面向分布式、多语言异构化服务架构的流量治理组件,主要以流量为切入点,从流量路由、流量控制、流量整形、熔断降级、系统自适应过载保护、热点流量防护等多个维度来帮助开发者保障微服务的稳定性。 本篇博客介绍CAP理论,微…...

C#学习 - 表达式、语句
表达式 定义 算法逻辑的最基本单元,表达一定的算法意图是由一个或多个操作数和零个或多个操作符组成的序列表达式功能是求值,得到的结果可能是一个值、对象、方法或名称空间因为操作符有优先级,所以表达式也有优先级 分类 一个值。表达式…...

VirtualBox 进入虚拟机后,鼠标出不来了
VirtualBox 进入虚拟机后,鼠标出不来了。 一般情况下,VirtualBox默认的鼠标切换快捷键是右边的Ctrl键。 如果按住右Ctrl键还是没有用,那应该是没有设置主机键。 设置方法: 打开VirtualBox的全局设定,找到热键ÿ…...
)
030-从零搭建微服务-消息队列(二)
写在最前 如果这个项目让你有所收获,记得 Star 关注哦,这对我是非常不错的鼓励与支持。 源码地址(后端):mingyue: 🎉 基于 Spring Boot、Spring Cloud & Alibaba 的分布式微服务架构基础服务中心 源…...

Docker从认识到实践再到底层原理(九)|Docker Compose 容器编排
前言 那么这里博主先安利一些干货满满的专栏了! 首先是博主的高质量博客的汇总,这个专栏里面的博客,都是博主最最用心写的一部分,干货满满,希望对大家有帮助。 高质量博客汇总 然后就是博主最近最花时间的一个专栏…...
操作EXCEL计算3万条数据的NDVI并填入
Python操作EXCEL,计算3万条数据的NDVI并填入 问题描述 现在是有构建好了的查找表,不过构建了3万条数据,在excel中手动计算每行的NDVI值太麻烦了,也不会操作。 就试试python吧,毕竟python自动处理大型EXCEL数据很方便…...
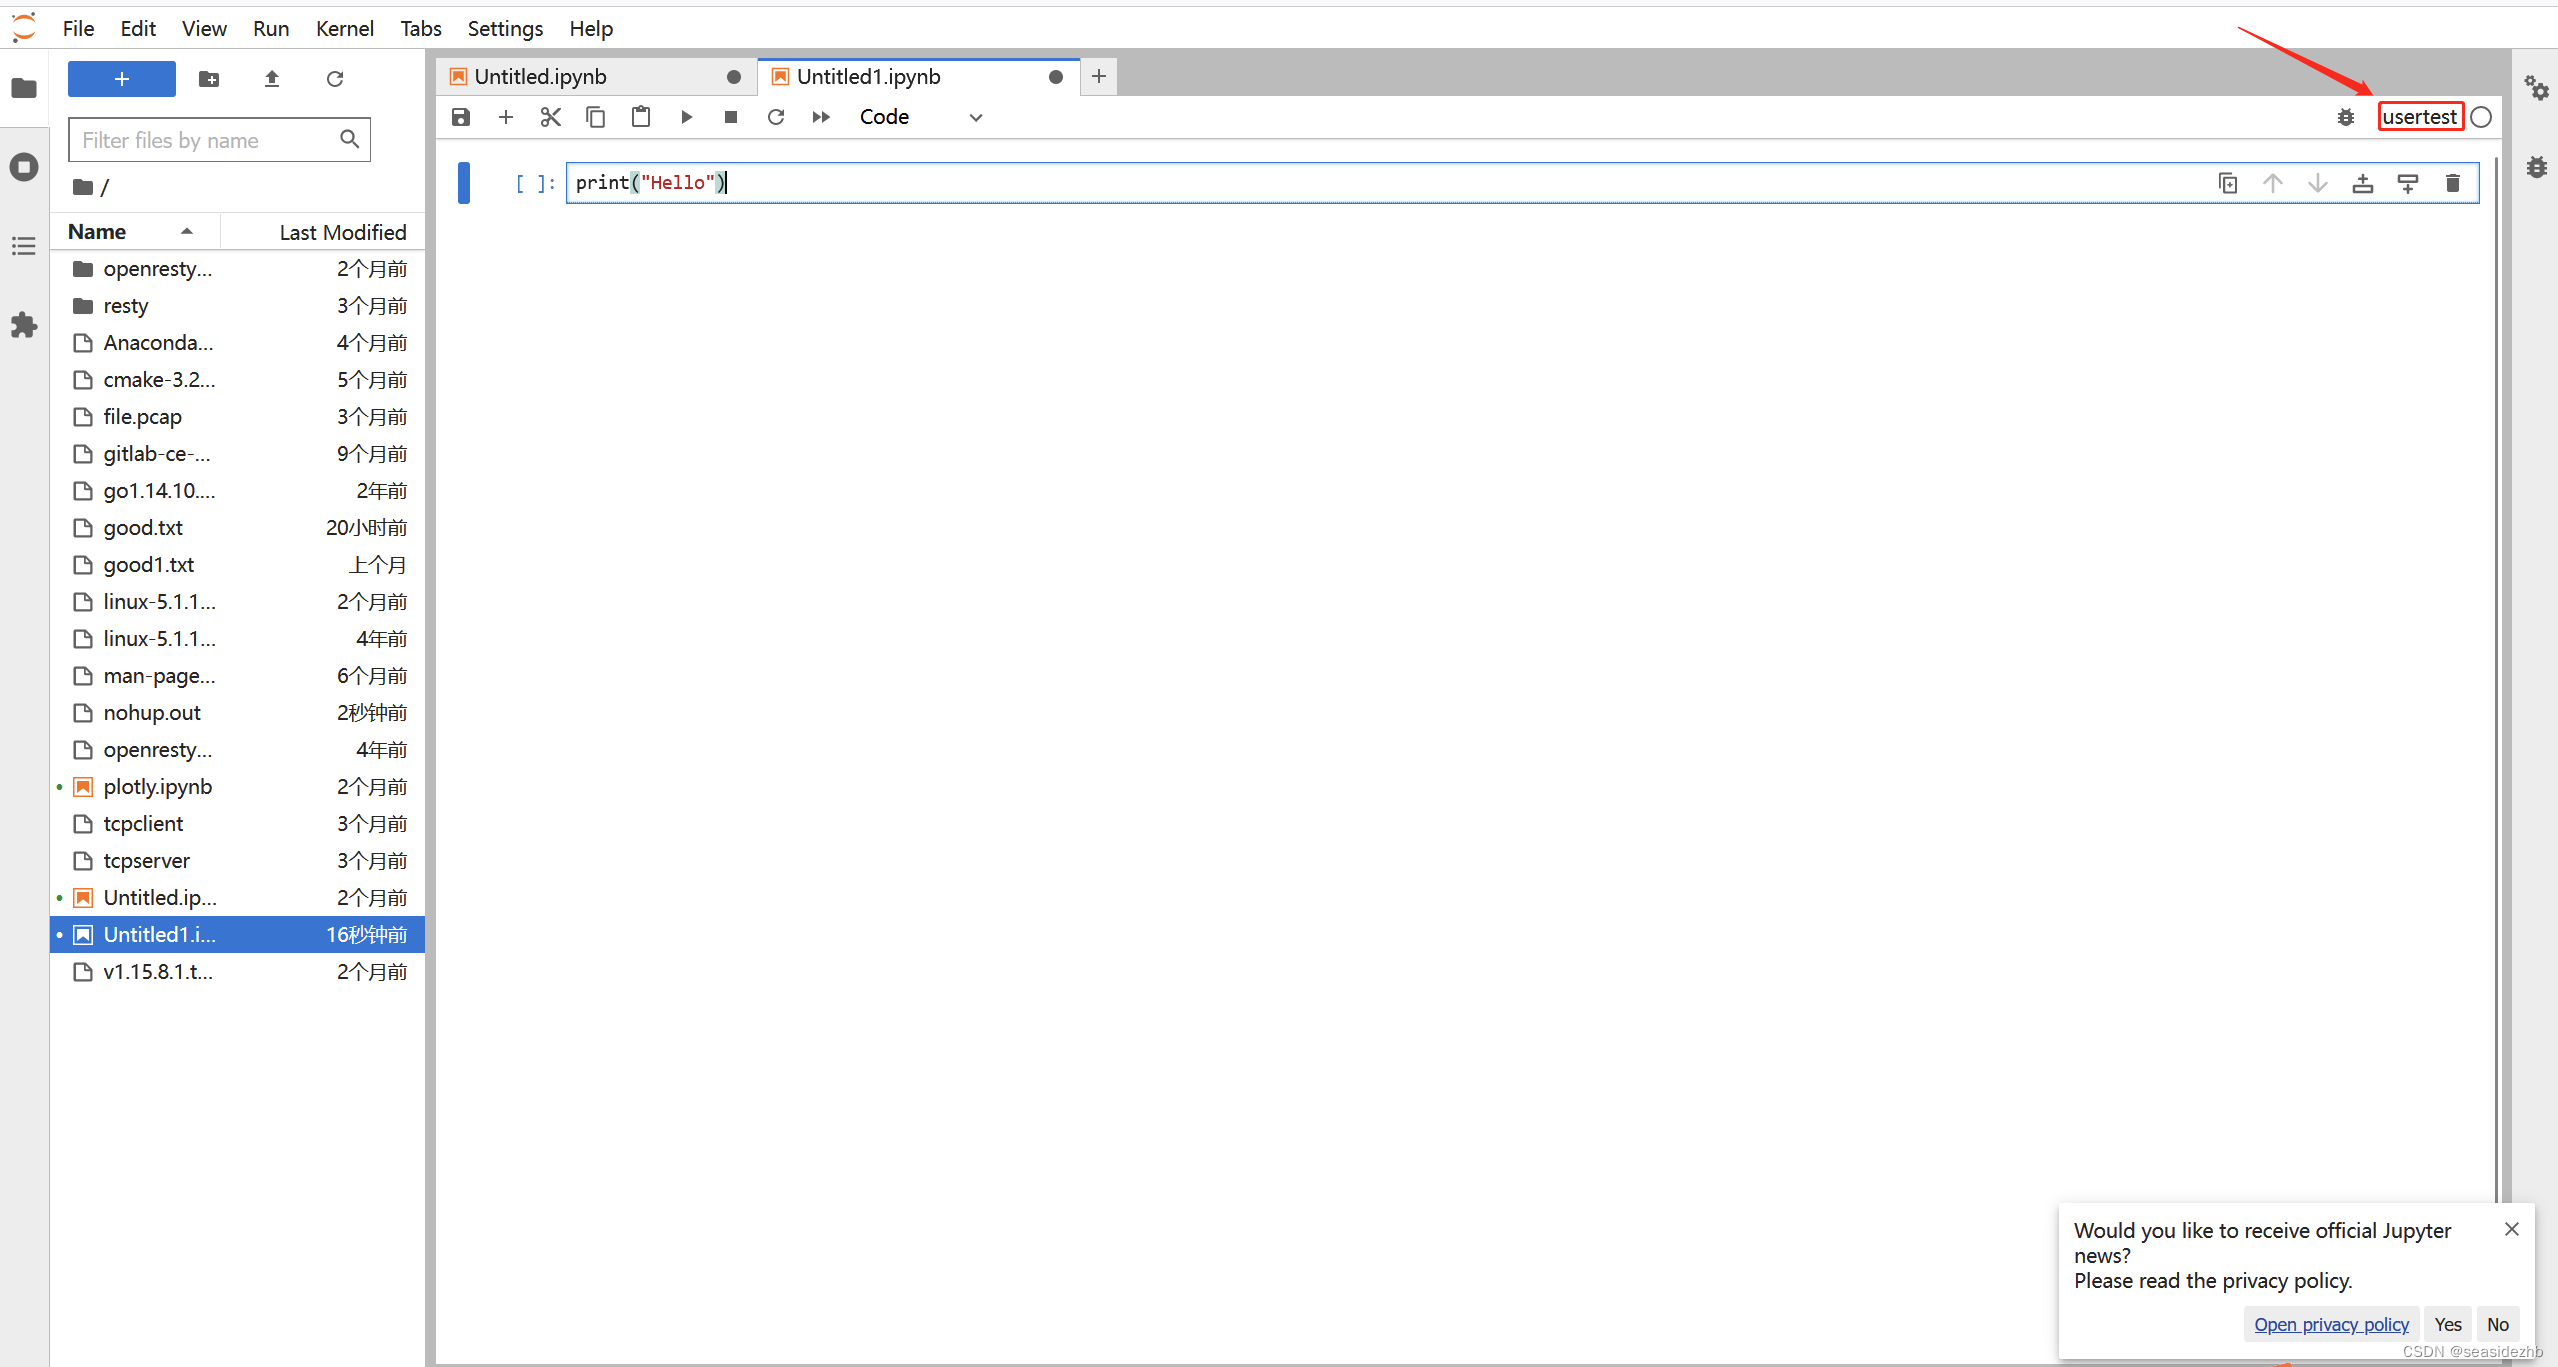
Linux服务器安装Anaconda 配置远程jupyter lab使用虚拟环境
参考的博客: Linux服务器安装Anaconda 并配置远程jupyter lab anaconda配置远程访问jupyter,并创建虚拟环境 理解和创建:Anaconda、Jupyterlab、虚拟环境、Kernel 下边是正文了。 https://www.anaconda.com/download是官网网址,可…...
)
R语言实现随机生存森林(3)
常见问题解答 1、计算C指数 1-Error rate,或者 rsf.err <- get.cindex(yvar$Survival_months,yvar$OS,predictedrf.grow$predicted) 2、模型中predicted和predicted.oob区别 predicted和predicted.oob是两个不同的属性,它们分别表示模型的预测结果…...
WebPack-打包工具
从图中我们可以看出,Webpack 可以将多种静态资源 js、css、less 转换成一个静态文件,减少了页面的请求. 下面举个例子 : main.js 我们只命名导出一个变量 export const name"老六"index.js import { name } from "./tset/…...

CISSP学习笔记:PKI和密码学应用
第七章 PKI和密码学应用 7.1 非对称密码学 对称密码系统具有共享的秘钥系统,从而产生了安全秘钥分发的问题非对称密码学使用公钥和私钥对,无需支出复杂密码分发系统 7.1.1 公钥与私钥 7.1.2 RSA(兼具加密和数字签名) RSA算法…...

从使用到原理,深度解析jsontop.cn—— 开发者必备的一站式在线工具站实现逻辑
前言 在前后端分离的开发体系中,JSON 格式化、加密解密、正则测试等基础操作,是开发者每天都要面对的「高频刚需」,但传统的本地工具安装繁琐、跨设备使用受限,普通在线工具又存在广告泛滥、数据安全隐患等问题。jsontop.cn作为一…...

实战部署Teable:10分钟构建企业级数据协作平台的最佳实践
实战部署Teable:10分钟构建企业级数据协作平台的最佳实践 【免费下载链接】teable 项目地址: https://gitcode.com/GitHub_Trending/te/teable 在数据驱动决策的今天,企业如何快速搭建一个功能完备的数据协作平台?传统的数据管理方案…...

TensorRT黑箱破解指南:从精度谜题到性能优化的技术侦探之旅
TensorRT黑箱破解指南:从精度谜题到性能优化的技术侦探之旅 【免费下载链接】TensorRT NVIDIA TensorRT™ 是一个用于在 NVIDIA GPU 上进行高性能深度学习推理的软件开发工具包(SDK)。此代码库包含了 TensorRT 的开源组件 项目地址: https:…...

Ollama本地模型管理:集成Phi-3-mini-128k-instruct的混合推理方案
Ollama本地模型管理:集成Phi-3-mini-128k-instruct的混合推理方案 对于很多刚开始接触本地大模型的朋友来说,Ollama是个非常友好的工具。它让下载、运行和管理模型变得像安装普通软件一样简单。但用久了可能会发现一个问题:本地电脑的算力毕…...

【技术突破】通过进程优先级调控解决ACE-Guard资源占用问题的完整指南
【技术突破】通过进程优先级调控解决ACE-Guard资源占用问题的完整指南 【免费下载链接】sguard_limit 限制ACE-Guard Client EXE占用系统资源,支持各种腾讯游戏 项目地址: https://gitcode.com/gh_mirrors/sg/sguard_limit 如何精准定位资源占用异常…...
)
OpenCFD-SCU从编译到实战:用GPU加速超声速流动模拟(含Tecplot后处理教程)
OpenCFD-SCU从编译到实战:用GPU加速超声速流动模拟(含Tecplot后处理教程) 计算流体力学(CFD)作为现代工程设计与科学研究的重要工具,其计算效率直接影响着项目周期与研究成果的产出速度。本文将带您从零开始…...

6502继电电路的故障模拟与定位仿真设计
本设计将包含: 底层继电器/逻辑门模拟:模拟继电器的“吸合”与“释放”(高阻/导通)。 6502核心功能单元:ALU(算术逻辑单元)、寄存器、指令译码器、总线。 故障注入系统:模拟“继电器触点粘连”、“线圈断路”、“短路”等常见硬件故障。 故障定位算法:基于“半分割法”…...

Windows 环境下快速部署 MinIO 服务:从基础配置到安全访问
1. Windows 下部署 MinIO 的完整指南 MinIO 是一个高性能的对象存储服务,兼容 Amazon S3 API。它轻量、易部署,特别适合在本地开发环境中使用。对于 Windows 用户来说,MinIO 提供了一个简单的.exe文件,可以快速启动服务。下面我会…...

工业自动化新手必看:Profibus、Profinet和Ethernet到底该怎么选?
工业自动化新手必看:Profibus、Profinet和Ethernet到底该怎么选? 第一次走进工厂车间时,那些缠绕在设备间的电缆就像一张复杂的神经网络。作为工业自动化领域的新人,最让我困惑的不是PLC编程,而是如何理解这些通信协议…...

4大技术突破如何重塑音频智能应用:Audio Flamingo 3的全模态理解创新
4大技术突破如何重塑音频智能应用:Audio Flamingo 3的全模态理解创新 【免费下载链接】audio-flamingo-3 项目地址: https://ai.gitcode.com/hf_mirrors/nvidia/audio-flamingo-3 副标题:从技术原理到落地指南的音频大模型选型实践 一、技术背景…...