服务器负载均衡
什么是服务器负载
1. 常见理解的平均负载
每次发现系统变慢时,我们通常做的第一件事,就是执行 top 或者 uptime 命令,来了解系统的负载情况。比如下列情况
[root@kube-node1 ~]# uptime09:44:37 up 74 days, 11:53, 1 user, load average: 0.49, 0.79, 0.87# 09:44:37 当前时间 # up 74 days, 11:53 系统运行时间 # 1 user 当前登录用户人数 # 0.49, 0.79, 0.87 1分钟内、5分钟内、15分钟内的平均负载通常理解认为平均负载就是单位时间内的 CPU 使用率。例如上面的0.49代表CPU的使用率是49%,而习惯性把负载均衡和CPU某种等式关系,通过增加配置方法来缓解服务器负载压力。
例如: 假设平均负载值等于8,我们默认的理解如下情况。
-
在双核CPU下负载过载。 CPU忙不过来
-
在4核CPU达到负载过载临界值。CPU还能应付
-
在16核CPU情况下性能过剩。CPU轻松应对
那负载均衡是否可以直接和CPU直接建立如上关系?
2. 系统定义的平均负载
我们可以通过man uptime来查看官方文档对负载均衡的解释
[root@kube-node1 ~]# man uptimeDESCRIPTIONuptime gives a one line display of the following information. The current time, how long the system has been running, how many users arecurrently logged on, and the system load averages for the past 1, 5, and 15 minutes.简单来说:
平均负载是指单位时间内,系统中处于可运行状态和不可中断状态的平均进程数,也就是平均活跃进程数。这种说法似乎和 CPU 使用率并没有直接关系。
可运行状态:
所谓可运行状态的进程,是指正在使用 CPU 或者正在等待 CPU 的进程,也就是我们常用 ps 命令看到的,处于 R 状态(Running 或 Runnable)的进程。
不可中断状态:
不可中断状态的进程则是正处于内核态关键流程中的进程,并且这些流程是不可打断的,比如最常见的是等待硬件设备的 I/O 响应,也就是我们在 ps 命令中看到的 D 状态(Uninterruptible Sleep,也称为 Disk Sleep)的进程。
-
我们通过案例分析几个常见的负载均衡场景
参考文档: https://www.cnblogs.com/xzlive/p/15157526.html
-
CPU 性能指标介绍
-
%usr: 用户态进程,可以理解为用户启动的进程。包括如MySQL, NGINX,Redis等进程。
-
%nice: 高优先级进程运行比,高优先级进程运行越多,值也就越高
-
%sys: 系统态进程,通常可以理解操作系统内置的进程,这类进程不可中断,负载系统资源调度。比如硬盘读写,打印机打印等。
-
%iowait: 表示CPU等待I/O操作的时间比例。
-
%irq : 硬中断, 中断随时可能发生,发生之后必须马上得到处理。
-
抢占当前任务:内核必须暂停正在执行的进程;
-
执行中断处理函数:找到对应的中断处理函数,将 CPU 交给它(执行);
-
中断处理完成之后:第 1 步被抢占的进程恢复执行
-
硬中断是由外部设备(如网卡、硬盘)自动产生的,用于通知操作系统关于系统外设状态的变化
-
-
%soft: 软中断。
-
每个 CPU 上会初始化一个
ksoftirqd内核线程,负责处理各种类型的 softirq 中断事件; -
例如:
ksoftirqd/4, 4代表逻辑编号,即是哪个CPU核 -
软中断是执行中断指令产生,无需外部施加中断请求信号,通常用于处理那些需要尽快完成但又不属于硬中断处理范畴的异步事件。
-
-
%steal : 表示虚拟化环境中,其他虚拟机运行时占用 CPU 时间的百分比
-
%guest: 表示来自访客虚拟机的事件。
-
%idle: CPU 空闲占比。
-
-
运行的命令介绍
-
安装: yum install sysstat
-
主要几个命令
-
stree : 一个用于性能测试的命令。包括读写,计算,内存测试
-
uptime: 报告系统启动时间和近15分钟的负载值
-
pidstat: 报告进程对CPU的消耗情况。一个进程可能运行在多个CPU。
-
mpstat: 包括CPU处理进程使用情况,一个CPU可能运行多个进程。
-
-
-
CPU 密集型进程: 模拟资源在一颗CPU上使用
首先在第一个终端运行 stress 命令,集群模拟一个 CPU 使用率 100% 的场景:
[root@mking ~]# stress --cpu 1 --timeout 600
stress: info: [32742] dispatching hogs: 1 cpu, 0 io, 0 vm, 0 hdd接着第二个终端运行uptime查看平均负载的变化情况:
# -d 参数表示高亮显示变化的区域,
[root@mking ~]# watch -d uptime
..., load average: 1.48 0.78, 0.53第三个终端运行mpstat查看CPU使用率的变化情况:
# 显示所有CPU的指标,并在间隔5秒输出一组数据
[root@mking ~]# mpstat -P ALL 5 1
Linux 3.10.0-1160.114.2.el7.x86_64 (mking)      2024年06月18日  _x86_64_        (6 CPU)11时50分01秒  CPU    %usr   %nice    %sys %iowait    %irq   %soft  %steal  %guest  %gnice   %idle
11时50分06秒  all   16.73    0.00    0.03    0.00    0.00    0.00    0.00    0.00    0.00   83.23
11时50分06秒    0    0.00    0.00    0.00    0.00    0.00    0.00    0.00    0.00    0.00  100.00
11时50分06秒    1    0.20    0.00    0.20    0.00    0.00    0.00    0.00    0.00    0.00   99.60
11时50分06秒    2    0.00    0.00    0.00    0.00    0.00    0.00    0.00    0.00    0.00  100.00
11时50分06秒    3  100.00    0.00    0.00    0.00    0.00    0.00    0.00    0.00    0.00    0.00
11时50分06秒    4    0.00    0.00    0.00    0.00    0.00    0.00    0.00    0.00    0.00  100.00
11时50分06秒 5 0.00 0.00 0.00 0.00 0.00 0.00 0.00 0.00 0.00 100.00第三个终端运行pidstat查看进程运行CPU情况
[root@mking ~]# pidstat -u 5 1
Linux 3.10.0-1160.114.2.el7.x86_64 (mking)      2024年06月18日  _x86_64_        (6 CPU)11时51分14秒   UID       PID    %usr %system  %guest    %CPU   CPU  Command
11时51分19秒     0     32599    0.00    0.20    0.00    0.20     1  top
11时51分19秒 0 32743 100.00 0.00 0.00 100.00 3 stress第三个终端运行vmstat查看进程运行CPU情况
[root@mking ~]# vmstat 1
procs -----------memory---------- ---swap-- -----io---- -system-- ------cpu-----r  b   swpd   free   buff  cache   si   so    bi    bo   in   cs us sy id wa st1  0      0 28016312   4184 3810628    0    0     0     1    1    3  0  0 100  0  01  0      0 28016296   4184 3810628    0    0     0     0 1107  174 17  0 83  0  01  0      0 28016296   4184 3810628    0    0     0     0 1102  200 17  0 83  0  01  0      0 28016296   4184 3810628    0    0     0    41 1118  449 17  0 83  0  01  0      0 28016296   4184 3810628    0    0     0     0 1113  209 17  0 83  0  01  0      0 28016312   4184 3810628    0    0     0     0 1075  160 17  0 83  0  01  0      0 28016312   4184 3810628    0    0     0     0 1112  422 17  0 83  0  01  0      0 28016312   4184 3810628    0    0     0     0 1092  178 17  0 83  0  01  0      0 28016312   4184 3810628    0    0     0     0 1089  182 17  0 83  0  01  0      0 28016312   4184 3810628    0    0     0     0 1119  423 17  0 83  0  01  0      0 28016312   4184 3810628    0    0     0     0 1084  178 17  0 83  0  01  0      0 28016312   4184 3810628    0    0     0     0 1085  172 17  0 83  0  01  0      0 28016312   4184 3810628    0    0     0     0 1106  302 17  0 83  0  01  0      0 28016312   4184 3810628    0    0     0     0 1077  158 17  0 83  0  0
uptime: 负载稳定在1,理论上至少有一颗CPU满载工作,而这是一台6核的服务器。
vmstat: 有1个Procs进程在运行。而整体CPU空83%,用户态进程占比17%, 约等于1/6 总CPU使用率 。
mpstat: 有CPU-3满载运行,核心使用率 = 1/6 ≈17%
pidstat: 查到有进程=32743使用CPU-3达到100%。
在这个案例中; 负载1 ≈ CPU使用率,6颗U理论满载使用率是6。
-
I/O 密集型进程
还是运行stress命令,模拟 I/O 压力,即不停地执行 sync:
# 开启50个进程进行IO压力测试
[root@mking ~]# stress -i 30 --timeout 600第二个终端运行uptime查看平均负载的变化情况:
[root@mking ~]# uptime
... load average: 30.60, 24.52, 14.83
第三个终端运行 mpstat 查看 CPU 使用率的变化情况:
[root@mking ~]# mpstat -P ALL 5 113时47分56秒  CPU    %usr   %nice    %sys %iowait    %irq   %soft  %steal  %guest  %gnice   %idle
13时48分01秒  all    0.37    0.00   99.43    0.00    0.00    0.03    0.00    0.00    0.00    0.17
13时48分01秒    0    0.40    0.00   99.40    0.00    0.00    0.00    0.00    0.00    0.00    0.20
13时48分01秒    1    0.40    0.00   99.40    0.00    0.00    0.00    0.00    0.00    0.00    0.20
13时48分01秒    2    0.40    0.00   99.40    0.00    0.00    0.00    0.00    0.00    0.00    0.20
13时48分01秒    3    0.40    0.00   99.40    0.00    0.00    0.00    0.00    0.00    0.00    0.20
13时48分01秒    4    0.40    0.00   99.40    0.00    0.00    0.00    0.00    0.00    0.00    0.20
13时48分01秒    5    0.40    0.00   99.40    0.00    0.00    0.00    0.00    0.00    0.00    0.20平均时间:  CPU    %usr   %nice    %sys %iowait    %irq   %soft  %steal  %guest  %gnice   %idle
平均时间:  all    0.37    0.00   99.43    0.00    0.00    0.03    0.00    0.00    0.00    0.17
平均时间:    0    0.40    0.00   99.40    0.00    0.00    0.00    0.00    0.00    0.00    0.20
平均时间:    1    0.40    0.00   99.40    0.00    0.00    0.00    0.00    0.00    0.00    0.20
平均时间:    2    0.40    0.00   99.40    0.00    0.00    0.00    0.00    0.00    0.00    0.20
平均时间:    3    0.40    0.00   99.40    0.00    0.00    0.00    0.00    0.00    0.00    0.20
平均时间:    4    0.40    0.00   99.40    0.00    0.00    0.00    0.00    0.00    0.00    0.20
平均时间: 5 0.40 0.00 99.40 0.00 0.00 0.00 0.00 0.00 0.00 0.20第三个终端运行pidstat查看进程运行CPU情况
[root@mking ~]# pidstat -u 5 113时48分54秒   UID       PID    %usr %system  %guest    %CPU   CPU  Command
13时48分59秒     0        67    0.00   19.05    0.00   19.05     3  kworker/u12:1
13时48分59秒     0       328    0.00   19.25    0.00   19.25     0  kworker/u12:3
13时48分59秒    99      1631    0.20    0.00    0.00    0.20     5  nginx
13时48分59秒     0      1838    0.00   19.05    0.00   19.05     3  kworker/u12:4
13时48分59秒     0      2098    0.00   19.25    0.00   19.25     2  kworker/u12:0
13时48分59秒     0      2110    0.00   17.66    0.00   17.66     1  stress
13时48分59秒     0      2111    0.00   17.66    0.00   17.66     0  stress
13时48分59秒     0      2112    0.00   17.46    0.00   17.46     5  stress
13时48分59秒     0      2113    0.20   17.66    0.00   17.86     2  stress
13时48分59秒     0      2114    0.00   16.27    0.00   16.27     2  stress
13时48分59秒     0      2115    0.00   17.86    0.00   17.86     4  stress
13时48分59秒     0      2116    0.00   16.87    0.00   16.87     4  stress
13时48分59秒     0      2117    0.00   16.47    0.00   16.47     2  stress
13时48分59秒     0      2118    0.00   17.66    0.00   17.66     4  stress
13时48分59秒     0      2119    0.00   17.26    0.00   17.26     0  stress
13时48分59秒     0      2120    0.00   17.46    0.00   17.46     1  stress
13时48分59秒     0      2121    0.00   16.67    0.00   16.67     2  stress
13时48分59秒     0      2122    0.00   17.26    0.00   17.26     4  stress
13时48分59秒     0      2123    0.00   16.67    0.00   16.67     5  stress
13时48分59秒     0      2124    0.00   17.06    0.00   17.06     0  stress
13时48分59秒     0      2125    0.00   16.87    0.00   16.87     0  stress
13时48分59秒     0      2126    0.00   17.66    0.00   17.66     3  stress
13时48分59秒     0      2127    0.00   16.67    0.00   16.67     3  stress
13时48分59秒     0      2128    0.00   17.46    0.00   17.46     3  stress
13时48分59秒     0      2129    0.20   17.26    0.00   17.46     3  stress
13时48分59秒     0      2130    0.00   17.26    0.00   17.26     2  stress
13时48分59秒     0      2131    0.20   16.87    0.00   17.06     1  stress
13时48分59秒     0      2132    0.20   17.46    0.00   17.66     1  stress
13时48分59秒     0      2133    0.20   17.66    0.00   17.86     1  stress
13时48分59秒     0      2134    0.00   17.06    0.00   17.06     2  stress
13时48分59秒     0      2135    0.00   19.05    0.00   19.05     0  stress
13时48分59秒     0      2136    0.00   17.26    0.00   17.26     5  stress
13时48分59秒     0      2137    0.00   16.67    0.00   16.67     0  stress
13时48分59秒     0      2138    0.20   17.46    0.00   17.66     5  stress
13时48分59秒 0 2139 0.00 16.47 0.00 16.47 5 stress第三个终端运行vmstat查看进程信息
[root@mking ~]# vmstat -w 1
procs -----------------------memory---------------------- ---swap-- -----io---- -system-- --------cpu--------r  b         swpd         free         buff        cache   si   so    bi    bo   in   cs  us  sy  id  wa  st
30  0            0     28012484         4184      3812136    0    0     0     1    2    3   0   0 100   0   0
30  0            0     28012444         4184      3812136    0    0     0     0 161961 563844   0 100   0   0   0
30  0            0     28012444         4184      3812136    0    0     0     0 162017 563069   0 100   0   0   0
30  0            0     28012444         4184      3812136    0    0     0     0 161691 563026   0 100   0   0   0
30  0            0     28012444         4184      3812136    0    0     0     0 161897 563484   0 100   0   0   0
31  0            0     28012444         4184      3812136    0    0     0     0 161759 563316   0 100   0   0   0
30  0            0     28012444         4184      3812136    0    0     0     0 161960 563586   0 100   0   0   0
31  0            0     28012444         4184      3812136    0    0     0     0 162130 563866   1  99   0   0   0
vmstat: 有30个进程并行执行,并且CPU系统态进程占比≈100,
pidstat: 有30个进程,平均每个进程占比CPU17..5%。每核心并行处理5个进程。理论会上产生30的负载
uptime: 产生了约30的负载。
mpstat: 6个CPU的处理情况。
-
所有CPU均满载运行。
-
读写压力测试,系统会调用IO相关的系统进程,所以系统态进程在99.4%,
-
iowait = 0 。 因为该例虽然调用IO类进程,但没有写入数据。
-
在这个案例中。也可以看到CPU使用率 可以和 服务器负载建立等式关系。
-
模拟大量进程运行场景
使用stress模拟计算,此处开了16个进程进行运算
[root@mking ~]# stress -c 16 --timeout 600
stress: info: [2668] dispatching hogs: 16 cpu, 0 io, 0 vm, 0 hdd第二个终端运行uptime查看平均负载的变化情况:
[mking@mking ~]$ uptime
... load average: 15.96, 14.60, 13.96
第三个终端运行mpstat查看进程信息
[root@mking ~]# mpstat -P ALL 5 114时22分38秒  CPU    %usr   %nice    %sys %iowait    %irq   %soft  %steal  %guest  %gnice   %idle
14时22分43秒  all  100.00    0.00    0.00    0.00    0.00    0.00    0.00    0.00    0.00    0.00
14时22分43秒    0  100.00    0.00    0.00    0.00    0.00    0.00    0.00    0.00    0.00    0.00
14时22分43秒    1  100.00    0.00    0.00    0.00    0.00    0.00    0.00    0.00    0.00    0.00
14时22分43秒    2  100.00    0.00    0.00    0.00    0.00    0.00    0.00    0.00    0.00    0.00
14时22分43秒    3  100.00    0.00    0.00    0.00    0.00    0.00    0.00    0.00    0.00    0.00
14时22分43秒    4  100.00    0.00    0.00    0.00    0.00    0.00    0.00    0.00    0.00    0.00
14时22分43秒    5  100.00    0.00    0.00    0.00    0.00    0.00    0.00    0.00    0.00    0.00平均时间:  CPU    %usr   %nice    %sys %iowait    %irq   %soft  %steal  %guest  %gnice   %idle
平均时间:  all  100.00    0.00    0.00    0.00    0.00    0.00    0.00    0.00    0.00    0.00
平均时间:    0  100.00    0.00    0.00    0.00    0.00    0.00    0.00    0.00    0.00    0.00
平均时间:    1  100.00    0.00    0.00    0.00    0.00    0.00    0.00    0.00    0.00    0.00
平均时间:    2  100.00    0.00    0.00    0.00    0.00    0.00    0.00    0.00    0.00    0.00
平均时间:    3  100.00    0.00    0.00    0.00    0.00    0.00    0.00    0.00    0.00    0.00
平均时间:    4  100.00    0.00    0.00    0.00    0.00    0.00    0.00    0.00    0.00    0.00
平均时间:    5  100.00    0.00    0.00    0.00    0.00    0.00    0.00    0.00    0.00    0.00
接着再运行 pidstat 来看一下进程的情况:
[root@mking ~]# pidstat -u 5 1
Linux 3.10.0-1160.114.2.el7.x86_64 (mking)      2024年06月18日  _x86_64_        (6 CPU)14时23分11秒   UID       PID    %usr %system  %guest    %CPU   CPU  Command
14时23分16秒     0      2669   39.84    0.00    0.00   39.84     5  stress
14时23分16秒     0      2670   35.66    0.00    0.00   35.66     3  stress
14时23分16秒     0      2671   39.24    0.00    0.00   39.24     2  stress
14时23分16秒     0      2672   36.85    0.00    0.00   36.85     1  stress
14时23分16秒     0      2673   34.26    0.00    0.00   34.26     4  stress
14时23分16秒     0      2674   38.05    0.00    0.00   38.05     0  stress
14时23分16秒     0      2675   36.65    0.00    0.00   36.65     4  stress
14时23分16秒     0      2676   37.05    0.00    0.00   37.05     2  stress
14时23分16秒     0      2677   35.86    0.00    0.00   35.86     0  stress
14时23分16秒     0      2678   37.25    0.00    0.00   37.25     1  stress
14时23分16秒     0      2679   37.65    0.00    0.00   37.65     2  stress
14时23分16秒     0      2680   38.25    0.00    0.00   38.25     1  stress
14时23分16秒     0      2681   38.25    0.00    0.00   38.25     0  stress
14时23分16秒     0      2682   37.45    0.00    0.00   37.45     3  stress
14时23分16秒     0      2683   38.84    0.00    0.00   38.84     4  stress
14时23分16秒     0      2684   38.05    0.00    0.00   38.05     3  stress平均时间:   UID       PID    %usr %system  %guest    %CPU   CPU  Command
平均时间:     0      2669   39.84    0.00    0.00   39.84     -  stress
平均时间:     0      2670   35.66    0.00    0.00   35.66     -  stress
平均时间:     0      2671   39.24    0.00    0.00   39.24     -  stress
平均时间:     0      2672   36.85    0.00    0.00   36.85     -  stress
平均时间:     0      2673   34.26    0.00    0.00   34.26     -  stress
平均时间:     0      2674   38.05    0.00    0.00   38.05     -  stress
平均时间:     0      2675   36.65    0.00    0.00   36.65     -  stress
平均时间:     0      2676   37.05    0.00    0.00   37.05     -  stress
平均时间:     0      2677   35.86    0.00    0.00   35.86     -  stress
平均时间:     0      2678   37.25    0.00    0.00   37.25     -  stress
平均时间:     0      2679   37.65    0.00    0.00   37.65     -  stress
平均时间:     0      2680   38.25    0.00    0.00   38.25     -  stress
平均时间:     0      2681   38.25    0.00    0.00   38.25     -  stress
平均时间:     0      2682   37.45    0.00    0.00   37.45     -  stress
平均时间:     0      2683   38.84    0.00    0.00   38.84     -  stress
平均时间: 0 2684 38.05 0.00 0.00 38.05 - stress第三个终端运行vmstat查看进程信息
[root@mking yum.repos.d]# vmstat -w 1
procs -----------------------memory---------------------- ---swap-- -----io---- -system-- --------cpu--------r  b         swpd         free         buff        cache   si   so    bi    bo   in   cs  us  sy  id  wa  st
16  0            0     28012928         4184      3812136    0    0     0     1    1    3   0   0 100   0   0
16  0            0     28012904         4184      3812136    0    0     0     0 6029  899 100   0   0   0   0
16  0            0     28012904         4184      3812136    0    0     0     0 6027  894 100   0   0   0   0
16  0            0     28012904         4184      3812136    0    0     0     0 6029  905 100   0   0   0   0
16  0            0     28012904         4184      3812136    0    0     0     0 6023  895 100   0   0   0   0
16  0            0     28012904         4184      3812136    0    0     0     0 6039  916 100   0   0   0   0
16  0            0     28012904         4184      3812136    0    0     0     0 6021  886 100   0   0   0   0
16  0            0     28012904         4184      3812136    0    0     0     0 6033  906 100   0   0   0   0
16  0            0     28012904         4184      3812136    0    0     0     0 6026  902 100   0   0   0   0
16  0            0     28012904         4184      3812136    0    0     0     0 6028  901 100   0   0   0   0
16  0            0     28012780         4184      3812136    0    0     0     0 6038  909 100   0   0   0   0
16  0            0     28012780         4184      3812136    0    0     0     0 6022  901 100   0   0   0   0
16  0            0     28012780         4184      3812136    0    0     0     0 6028  893 100   0   0   0   0
vmstat: 有16个进程并行执行,并且CPU用户态进程占比≈100。
pidstat: 有16个进程,平均每个进程占比CPU≈37.5%。每核心并行处理2.6个进程。理论上产生16的负载
mpstat: 6个CPU的处理情况,都是用户态进程。因为只有用户进程做计算,不涉及系统级的资源调度
uptime: 负载稳定在16左右
该例子也似乎佐证了CPU使用率和负载均衡的关系。
案例小结1
从上述的案例中我们主要运行几个命令分析服务器情况,都证明了负载均衡等于CPU使用率。
-
vmstat查看系统进程并行的情况,以及Procs进程使用CPU
-
pidstat可以从进程角度看到进程使用CPU的情况。
-
mpstat从各个CPU的角度查看处理情况。
-
而上述命令相比top命令,也更加多元化展示了服务器资源使用情况。可以更丰富感受到CPU使用和服务器负载之间的关系。
接下来我们试着对在用的服务器进行分析,而工作中服务器系统也面对着更复杂的场景。
实际使用中的服务器分析
K8S集群节点服务器分析
-
终端运行
uptime查看平均负载的变化情况
[root@ec-pre user]# uptime 16:09:01 up 86 days, 14 min, 1 user, load average: 37.71, 46.92, 44.01-
终端运行
vmstat查看平均负载的变化情况:
[root@ec-pre user]# vmstat -w 1
procs -----------------------memory---------------------- ---swap-- -----io---- -system-- --------cpu--------r  b         swpd         free         buff        cache   si   so    bi    bo   in   cs  us  sy  id  wa  st
62  0            0       299300       260984     19502828    0    0     0    34    1    1  49  32  19   0   0
48  0            0       300412       260984     19503068    0    0     0    28 35905 108963  54  33  13   0   0
66  0            0       304704       260984     19503140    0    0     0     0 35785 108021  54  31  15   0   0
71  0            0       300112       260984     19503276    0    0     0     0 37185 112137  56  32  12   0   0
47  0            0       302196       260984     19503276    0    0     0     0 34101 98981  51  29  20   0   0
15  0            0       295856       260984     19503316    0    0     0   100 34654 89440  55  34  11   0   0
37  0            0       296636       260984     19503548    0    0     0   488 32257 88854  54  30  16   0   0
54  0            0       295552       260984     19503608    0    0     0     0 31144 87450  51  27  22   0   0
25  0            0       291392       260984     19503620    0    0     0     0 36502 96278  54  33  13   0   04  0            0       290924       260984     19503624    0    0     0     4 33465 91932  50  28  21   0   01  0            0       287548       260984     19503672    0    0     0   120 34752 93481  53  29  18   0   0
75  0            0       281900       260984     19503676    0    0     0     4 33809 94617  51  31  17   0   0
61  0            0       282132       260984     19503700    0    0     0     0 35220 96015  54  30  16   0   0
43 0 0 281300 260984 19503704 0 0 0 4 34878 91851 55 30 14 0 0-
终端运行
pidstat查看进程对CPU的使用情况
[root@ec-pre user]# pidstat 5 1
16时13分08秒   UID       PID    %usr %system  %guest    %CPU   CPU  Command
16时13分13秒     0         1    0.40    0.00    0.00    0.40     0  systemd
16时13分13秒     0         9    0.00    0.60    0.00    0.60     0  ksoftirqd/0
16时13分13秒     0        10    0.00    0.20    0.00    0.20     2  rcu_sched
16时13分13秒     0        16    0.00    0.20    0.00    0.20     1  ksoftirqd/1
16时13分13秒     0        21    0.00    0.60    0.00    0.60     2  ksoftirqd/2
16时13分13秒     0        26    0.00    0.80    0.00    0.80     3  ksoftirqd/3
16时13分13秒     0       428    0.00    0.40    0.00    0.40     1  systemd-journal
16时13分13秒     0       590    0.00    0.20    0.00    0.20     3  rngd
16时13分13秒     0      1716    0.60    0.00    0.00    0.60     2  containerd
16时13分13秒     0      2151    0.20    0.20    0.00    0.40     1  containerd-shim
16时13分13秒     0      2196    0.20    0.20    0.00    0.40     0  containerd-shim
16时13分13秒     0      3540    0.20    0.40    0.00    0.60     2  ilogtail
16时13分13秒     0      3628    0.00    0.20    0.00    0.20     3  node-cache
16时13分13秒     0      4125    0.20    0.20    0.00    0.40     3  node-problem-de
16时13分13秒     0      4502    0.40    0.00    0.00    0.40     0  rsyslogd
16时13分13秒     0      5031    0.20    0.80    0.00    1.00     0  /usr/local/clou
16时13分13秒  1000      8297    0.00    0.20    0.00    0.20     0  cainjector
16时13分13秒   101      9466    0.00    0.20    0.00    0.20     2  nginx-ingress-c
16时13分13秒  1000      9631    0.40    0.00    0.00    0.40     2  webhook
16时13分13秒     0      9924    0.20    0.00    0.00    0.20     0  storage-monitor
16时13分13秒     0     68679    1.20    0.80    0.00    1.99     2  java
16时13分13秒     0    485119    0.40    0.20    0.00    0.60     3  kube-proxy
16时13分13秒     0    488818    4.58    0.00    0.00    4.58     0  kubelet
16时13分13秒     0    755613    0.40    0.00    0.00    0.40     1  metrics-server
16时13分13秒     0    926554    0.20    0.00    0.00    0.20     0  AliYunDunUpdate
16时13分13秒     0   1586828    0.40    0.80    0.00    1.20     3  java
16时13分13秒  9999   1723125    1.39    0.20    0.00    1.59     3  java
16时13分13秒  9999   1723626  303.19    0.00    0.00  303.19     3  java
16时13分13秒     0   2392756    0.20    0.00    0.00    0.20     0  containerd-shim
16时13分13秒     0   2393090    0.20    0.00    0.00    0.20     0  containerd-shim
16时13分13秒     0   2393176    0.00    0.20    0.00    0.20     3  containerd-shim
16时13分13秒 65534   2394113    0.00    0.20    0.00    0.20     1  node-local-dns-
16时13分13秒     0   2394872    0.60    0.40    0.00    1.00     1  java
16时13分13秒     0   2395012    0.20    0.40    0.00    0.60     0  java
16时13分13秒   104   2395317    0.20    0.00    0.00    0.20     3  nginx
16时13分13秒     0   2396464    0.20    0.20    0.00    0.40     2  java
16时13分13秒     0   3053764    0.20    0.00    0.00    0.20     2  aliyun-service
16时13分13秒     0   3429517    0.40    0.40    0.00    0.80     1  AliYunDun
16时13分13秒     0   3429528    2.79    0.00    0.00    2.79     1  AliYunDunMonito
16时13分13秒  1200   3666527    0.20    0.20    0.00    0.40     3  onepilot
16时13分13秒     0   4134336    0.00    0.20    0.00    0.20     1  kworker/u8:1-rpciod
16时13分13秒     0   4175207    0.00    0.20    0.00    0.20     0  pidstat平均时间:   UID       PID    %usr %system  %guest    %CPU   CPU  Command
平均时间:     0         1    0.40    0.00    0.00    0.40     -  systemd
平均时间:     0         9    0.00    0.60    0.00    0.60     -  ksoftirqd/0
平均时间:     0        10    0.00    0.20    0.00    0.20     -  rcu_sched
平均时间:     0        16    0.00    0.20    0.00    0.20     -  ksoftirqd/1
平均时间:     0        21    0.00    0.60    0.00    0.60     -  ksoftirqd/2
平均时间:     0        26    0.00    0.80    0.00    0.80     -  ksoftirqd/3
平均时间:     0       428    0.00    0.40    0.00    0.40     -  systemd-journal
平均时间:     0       590    0.00    0.20    0.00    0.20     -  rngd
平均时间:     0      1716    0.60    0.00    0.00    0.60     -  containerd
平均时间:     0      2151    0.20    0.20    0.00    0.40     -  containerd-shim
平均时间:     0      2196    0.20    0.20    0.00    0.40     -  containerd-shim
平均时间:     0      3540    0.20    0.40    0.00    0.60     -  ilogtail
平均时间:     0      3628    0.00    0.20    0.00    0.20     -  node-cache
平均时间:     0      4125    0.20    0.20    0.00    0.40     -  node-problem-de
平均时间:     0      4502    0.40    0.00    0.00    0.40     -  rsyslogd
平均时间:     0      5031    0.20    0.80    0.00    1.00     -  /usr/local/clou
平均时间:  1000      8297    0.00    0.20    0.00    0.20     -  cainjector
平均时间:   101      9466    0.00    0.20    0.00    0.20     -  nginx-ingress-c
平均时间:  1000      9631    0.40    0.00    0.00    0.40     -  webhook
平均时间:     0      9924    0.20    0.00    0.00    0.20     -  storage-monitor
平均时间:     0     68679    1.20    0.80    0.00    1.99     -  java
平均时间:     0    485119    0.40    0.20    0.00    0.60     -  kube-proxy
平均时间:     0    488818    4.58    0.00    0.00    4.58     -  kubelet
平均时间:     0    755613    0.40    0.00    0.00    0.40     -  metrics-server
平均时间:     0    926554    0.20    0.00    0.00    0.20     -  AliYunDunUpdate
平均时间:     0   1586828    0.40    0.80    0.00    1.20     -  java
平均时间:  9999   1723125    1.39    0.20    0.00    1.59     -  java
平均时间:  9999   1723626  303.19    0.00    0.00  303.19     -  java
平均时间:     0   2392756    0.20    0.00    0.00    0.20     -  containerd-shim
平均时间:     0   2393090    0.20    0.00    0.00    0.20     -  containerd-shim
平均时间:     0   2393176    0.00    0.20    0.00    0.20     -  containerd-shim
平均时间: 65534   2394113    0.00    0.20    0.00    0.20     -  node-local-dns-
平均时间:     0   2394872    0.60    0.40    0.00    1.00     -  java
平均时间:     0   2395012    0.20    0.40    0.00    0.60     -  java
平均时间:   104   2395317    0.20    0.00    0.00    0.20     -  nginx
平均时间:     0   2396464    0.20    0.20    0.00    0.40     -  java
平均时间:     0   3053764    0.20    0.00    0.00    0.20     -  aliyun-service
平均时间:     0   3429517    0.40    0.40    0.00    0.80     -  AliYunDun
平均时间:     0   3429528    2.79    0.00    0.00    2.79     -  AliYunDunMonito
平均时间:  1200   3666527    0.20    0.20    0.00    0.40     -  onepilot
平均时间:     0   4134336    0.00    0.20    0.00    0.20     -  kworker/u8:1-rpciod
平均时间: 0 4175207 0.00 0.20 0.00 0.20 - pidstat-
终端运行
mpstat查看进程对CPU的使用情况
[root@ec-pre user]# mpstat -P ALL 5 1
16时16分10秒  CPU    %usr   %nice    %sys %iowait    %irq   %soft  %steal  %guest  %gnice   %idle
16时16分15秒  all   52.73    0.00   21.44    0.00    0.00    8.93    0.00    0.00    0.00   16.90
16时16分15秒    0   54.36    0.00   21.10    0.00    0.00   10.14    0.00    0.00    0.00   14.40
16时16分15秒    1   53.01    0.00   21.62    0.00    0.00    3.33    0.00    0.00    0.00   22.04
16时16分15秒    2   55.40    0.00   21.38    0.00    0.00    9.37    0.00    0.00    0.00   13.85
16时16分15秒    3   48.18    0.00   21.46    0.00    0.00   12.96    0.00    0.00    0.00   17.41平均时间:  CPU    %usr   %nice    %sys %iowait    %irq   %soft  %steal  %guest  %gnice   %idle
平均时间:  all   52.73    0.00   21.44    0.00    0.00    8.93    0.00    0.00    0.00   16.90
平均时间:    0   54.36    0.00   21.10    0.00    0.00   10.14    0.00    0.00    0.00   14.40
平均时间:    1   53.01    0.00   21.62    0.00    0.00    3.33    0.00    0.00    0.00   22.04
平均时间:    2   55.40    0.00   21.38    0.00    0.00    9.37    0.00    0.00    0.00   13.85
平均时间:    3   48.18    0.00   21.46    0.00    0.00   12.96    0.00    0.00    0.00   17.41
vmstat: 该系统平均有45个进程并发,非连续性而偶然性的进程并发。
pidstat: 只有一个进程PID: 1723626 使用CPU-3,并使用到300%,该U的使用率≈3,其余3个CPU无负载。
mpstat: 单U平均使用率 ≈ 80%。4U的理论使用率 ≈ 3.2
uptime: 系统负载值 ≈ 38。4U的理论的单U使用率 ≈ 9.5。
Q:服务器CPU却使用率80%的情况下,为什么平均负载 = 38 ,按理说负载应该是9.5 .
A:官方描述的负载均衡指:可运行状态和不可中断状态的进程的数量。
-
CPU只是进程快慢的一个因素。
-
vmstat的R队列 ≈ 45,最高达到62,但数据呈离散型。说明系统存在一个不规律的并发任务
-
分析:
在该服务器中,PID=1723626是一个子进程,该有极短的生命周期,执行完后自动销毁。根据vmstat的R等待队列,再结合300%的CPU率。可以初步分析(也可能分析错了)该进程在执行进程会产生若干子进程或线程并行任务。
结论:
在极短的时间内,会间接性的运行一次高并发作业,该过程产生多个瞬时进程。而系统在这个周期内判断有大量的进程在执行,产生高负载的平均记录,但这类大量瞬时进程并没有过度阻塞使用CPU, 所以对系统没有太大的影响。
系统的负载值虽然是:45,真实CPU负载应该是:3.2
系统负载不能直接体现CPU的使用率,而是系统平均执行的进程数。
命令 vmstat可以最快速报告出系统进程数量情况。
FLINK计算类分析
-
使用
uptime查询服务器负载
[user@Flink ~]$ uptime ... load average: 18.24, 17.02, 15.04-
使用vmstat查看系统进程
[user@Flink ~]$ vmstat 1
procs -----------memory---------- ---swap-- -----io---- -system-- ------cpu-----r  b   swpd   free   buff  cache   si   so    bi    bo   in   cs us sy id wa st
26  0      0 321548 276072 8025804    0    0     0     7    0    0 33 28 39  0  0
12  0      0 324796 276072 8025816    0    0     0     0 78724 266993 34 29 37  0  0
18  0      0 333828 276072 8025840    0    0     0     0 80803 286272 35 30 35  0  06  0      0 319768 276072 8025872    0    0     0   168 78531 278355 35 28 37  0  08  0      0 325340 276072 8025896    0    0     0    92 80715 282014 36 30 35  0  07  0      0 316540 276072 8025960    0    0     0     0 78757 273973 34 29 37  0  0
56  0      0 317948 276072 8025976    0    0     0     0 76453 261455 32 28 39  0  0
30  0      0 326532 276072 8026008    0    0     0     0 80521 277981 37 30 33  0  0
12  0      0 321424 276072 8026056    0    0     0    24 81250 277352 35 31 35  0  08  0      0 332308 276072 8026096    0    0     0    32 79175 279351 34 29 37  0  0
28 0 0 322528 276072 8026160 0 0 0 0 80272 284826 36 30 35 0 03 0 0 311356 276072 8026172 0 0 0 0 81903 289972 36 30 34 0 08 0 0 326720 276072 8026196 0 0 0 0 80292 276461 36 30 34 0 06 0 0 320512 276072 8026204 0 0 0 36 81808 290181 35 31 34 0 08 0 0 328772 276072 8026216 0 0 0 564 81106 291775 37 29 34 0 0-
使用
pidstat查看进程占用CPU资源
[user@Flink ~]$ pidstat 5 117时04分03秒   UID       PID    %usr %system  %guest    %CPU   CPU  Command
17时04分08秒     0         6    0.00    0.80    0.00    0.80     0  ksoftirqd/0
17时04分08秒     0        19    0.00    1.00    0.00    1.00     2  ksoftirqd/2
17时04分08秒     0        29    0.00    0.60    0.00    0.60     4  ksoftirqd/4
17时04分08秒     0        39    0.00    0.80    0.00    0.80     6  ksoftirqd/6
17时04分08秒     0        49    0.00    0.80    0.00    0.80     8  ksoftirqd/8
17时04分08秒     0        59    0.00    0.80    0.00    0.80    10  ksoftirqd/10
17时04分08秒     0      1057    0.20    0.00    0.00    0.20     5  containerd
17时04分08秒     0      1102    0.60    0.40    0.00    1.00    10  /usr/local/clou
17时04分08秒     0      1246    0.20    0.20    0.00    0.40     2  dockerd
17时04分08秒  9999      1770    1.20    0.60    0.00    1.80     7  java
17时04分08秒  9999     12076  106.39   90.02    0.00  196.41     1  java
17时04分08秒  9999     13466  124.15  104.19    0.00  228.34     9  java
17时04分08秒     0     15759    0.20    0.20    0.00    0.40     8  AliYunDun
17时04分08秒     0     15772    0.60    1.00    0.00    1.60    11  AliYunDunMonito
17时04分08秒  9999     17088  103.59   85.83    0.00  189.42     3  java
17时04分08秒  9999     19277   80.84   64.67    0.00  145.51     1  java
17时04分08秒  1000     21590    0.00    0.20    0.00    0.20     0  pidstat
17时04分08秒  1000     24163    0.20    0.00    0.00    0.20    10  nginx平均时间:   UID       PID    %usr %system  %guest    %CPU   CPU  Command
平均时间:     0         6    0.00    0.80    0.00    0.80     -  ksoftirqd/0
平均时间:     0        19    0.00    1.00    0.00    1.00     -  ksoftirqd/2
平均时间:     0        29    0.00    0.60    0.00    0.60     -  ksoftirqd/4
平均时间:     0        39    0.00    0.80    0.00    0.80     -  ksoftirqd/6
平均时间:     0        49    0.00    0.80    0.00    0.80     -  ksoftirqd/8
平均时间:     0        59    0.00    0.80    0.00    0.80     -  ksoftirqd/10
平均时间:     0      1057    0.20    0.00    0.00    0.20     -  containerd
平均时间:     0      1102    0.60    0.40    0.00    1.00     -  /usr/local/clou
平均时间:     0      1246    0.20    0.20    0.00    0.40     -  dockerd
平均时间:  9999      1770    1.20    0.60    0.00    1.80     -  java
平均时间:  9999     12076  106.39   90.02    0.00  196.41     -  java
平均时间:  9999     13466  124.15  104.19    0.00  228.34     -  java
平均时间:     0     15759    0.20    0.20    0.00    0.40     -  AliYunDun
平均时间:     0     15772    0.60    1.00    0.00    1.60     -  AliYunDunMonito
平均时间:  9999     17088  103.59   85.83    0.00  189.42     -  java
平均时间:  9999     19277   80.84   64.67    0.00  145.51     -  java
平均时间:  1000     21590    0.00    0.20    0.00    0.20     -  pidstat
平均时间: 1000 24163 0.20 0.00 0.00 0.20 - nginx-
使用mpstat查看各CPU使用率
[user@Flink ~]$ mpstat -P ALL 5 117时07分12秒  CPU    %usr   %nice    %sys %iowait    %irq   %soft  %steal  %guest  %gnice   %idle
17时07分17秒  all   34.98    0.00   23.15    0.00    0.00    6.04    0.00    0.00    0.00   35.83
17时07分17秒    0   36.94    0.00   25.31    0.00    0.00   10.20    0.00    0.00    0.00   27.55
17时07分17秒    1   33.33    0.00   21.08    0.00    0.00    2.01    0.00    0.00    0.00   43.57
17时07分17秒    2   36.01    0.00   25.31    0.00    0.00   11.11    0.00    0.00    0.00   27.57
17时07分17秒    3   31.59    0.00   22.74    0.00    0.00    2.01    0.00    0.00    0.00   43.66
17时07分17秒    4   37.35    0.00   25.10    0.00    0.00   10.00    0.00    0.00    0.00   27.55
17时07分17秒    5   33.53    0.00   20.48    0.00    0.00    2.01    0.00    0.00    0.00   43.98
17时07分17秒    6   37.10    0.00   25.00    0.00    0.00   10.48    0.00    0.00    0.00   27.42
17时07分17秒    7   34.21    0.00   19.64    0.00    0.00    1.82    0.00    0.00    0.00   44.33
17时07分17秒    8   36.48    0.00   26.43    0.00    0.00    9.22    0.00    0.00    0.00   27.87
17时07分17秒    9   34.14    0.00   19.88    0.00    0.00    2.01    0.00    0.00    0.00   43.98
17时07分17秒   10   36.59    0.00   26.02    0.00    0.00    9.55    0.00    0.00    0.00   27.85
17时07分17秒   11   32.93    0.00   21.01    0.00    0.00    2.02    0.00    0.00    0.00   44.04平均时间:  CPU    %usr   %nice    %sys %iowait    %irq   %soft  %steal  %guest  %gnice   %idle
平均时间:  all   34.98    0.00   23.15    0.00    0.00    6.04    0.00    0.00    0.00   35.83
平均时间:    0   36.94    0.00   25.31    0.00    0.00   10.20    0.00    0.00    0.00   27.55
平均时间:    1   33.33    0.00   21.08    0.00    0.00    2.01    0.00    0.00    0.00   43.57
平均时间:    2   36.01    0.00   25.31    0.00    0.00   11.11    0.00    0.00    0.00   27.57
平均时间:    3   31.59    0.00   22.74    0.00    0.00    2.01    0.00    0.00    0.00   43.66
平均时间:    4   37.35    0.00   25.10    0.00    0.00   10.00    0.00    0.00    0.00   27.55
平均时间:    5   33.53    0.00   20.48    0.00    0.00    2.01    0.00    0.00    0.00   43.98
平均时间:    6   37.10    0.00   25.00    0.00    0.00   10.48    0.00    0.00    0.00   27.42
平均时间:    7   34.21    0.00   19.64    0.00    0.00    1.82    0.00    0.00    0.00   44.33
平均时间:    8   36.48    0.00   26.43    0.00    0.00    9.22    0.00    0.00    0.00   27.87
平均时间:    9   34.14    0.00   19.88    0.00    0.00    2.01    0.00    0.00    0.00   43.98
平均时间:   10   36.59    0.00   26.02    0.00    0.00    9.55    0.00    0.00    0.00   27.85
平均时间:   11   32.93    0.00   21.01    0.00    0.00    2.02    0.00    0.00    0.00   44.04
vmstat: 在运行的Procs ≈ 16。
pidstat: 12个CPU中有4个进程使用CPU,使用率≈190
mpstat: 每个CPU平均使用率≈65%,其中软中断使用率≈10%,系统态进程≈20%,用户态进程≈35%。
-
用户态进程: 结合上下文分析应该是JAVA进程。
-
系统态进程: pidstat中主演产生JAVA和软中断。
-
软中断: 处理来自硬件等设备数据,该服务器存在流量数据
-
-
uptime: 12的CPUS平均负载≈18. 单U平均处理能力约1.5。
分析:
vmstat报告Procs ≈ uptime的负载,但vmstat显示进程不是集中并发,说明系统整体负载不高。
而通过pidstat也可以得到产生4个高计算量的进程,实CPU负载为 0.65*12 ≈ 9。
所以服务器虽然系统负载表现较高,但CPU负载没问题。
案例小结2
在小结1中,我们通过案例可以看到CPU使用率即系统负载率,但这种测试是在本地测试机完成,系统环境单一不复杂。
CPU往往是服务器性能主要参考条件,发生高负载也通常和CPU挂钩,但在相对复杂的系统内。服务器平均负责只是反馈当前系统的一个综合情况,不能直接代表CPU的使用率。
系统负载均衡: 系统平均就绪或在运行的进程数量。
CPU的使用率: 处理一个进程时间比例,值越低 表示处理的任务越多。可以通过增加核心数或增加主频提高处理能力。
相关文章:

服务器负载均衡
什么是服务器负载 1. 常见理解的平均负载 每次发现系统变慢时,我们通常做的第一件事,就是执行 top 或者 uptime 命令,来了解系统的负载情况。比如下列情况 [rootkube-node1 ~]# uptime09:44:37 up 74 days, 11:53, 1 user, load average:…...
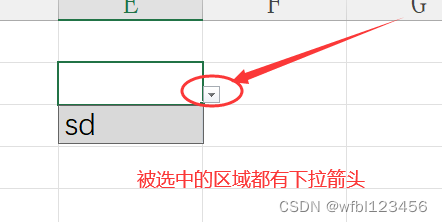
如何设置Excel单元格下拉列表
如何设置Excel单元格下拉列表 在Excel中设置单元格下拉列表可以提高数据输入的准确性和效率。以下是创建下拉列表的步骤: 使用数据验证设置下拉列表: 1. 选择单元格: 选择你想要设置下拉列表的单元格或单元格区域。 2. 打开数据验证&…...

红队内网攻防渗透:内网渗透之Linux内网权限提升技术:LXDDockerRbash限制型bash
红队内网攻防渗透 1. 内网权限提升技术1.1 Linux系统提权-普通用户-LXD容器1.2 Linux系统提权-普通用户-Docker容器1.3 权限在docker里面1.4 Linux系统提权-普通用户-Rbash限制型bash1. 内网权限提升技术 利用参考 https://gtfobins.github.io/LXD、LXC 和 Docker 是三种不同…...
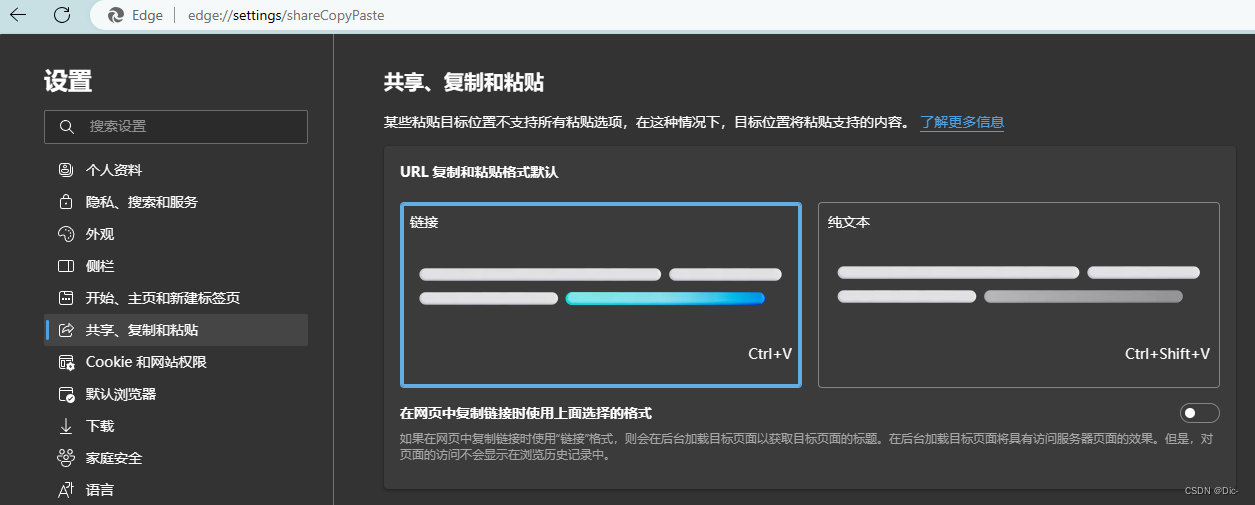
【笔记】复制Edge的网址粘贴后自动变成中文标题超链接
问题 1、从edge复制的网址粘贴直接显示网页内容名称而不是网址url。 2、复制任何网址粘贴到CSDN里面粘贴时直接转换成标题超链接(很讨厌的功能习惯)。 而如上两种问题不是互相影响的,就算设置了Edge的粘贴方式,复制到CSDN的文章…...

HTML5和CSS3总结
HTML5 HTML5是最新的HTML标准,它的主要目标是提供所有内容而不需要任何像flash,silverlight等的额外插件,这些内容来自动画、视频、富GUI等。HTML5是万维网联盟(W3C)和网络超文本应用技术工作组(WHATWG&am…...

探索数据分析无限潜能:vividime Desktop助力企业智能决策
在数字化浪潮席卷全球的今天,数据已经成为企业最宝贵的资产之一。通过对海量数据的深度挖掘和分析,企业能够洞察市场趋势、优化运营流程、提升用户体验,从而在激烈的市场竞争中脱颖而出。永洪科技的vividime Desktop作为一款功能强大、操作简…...
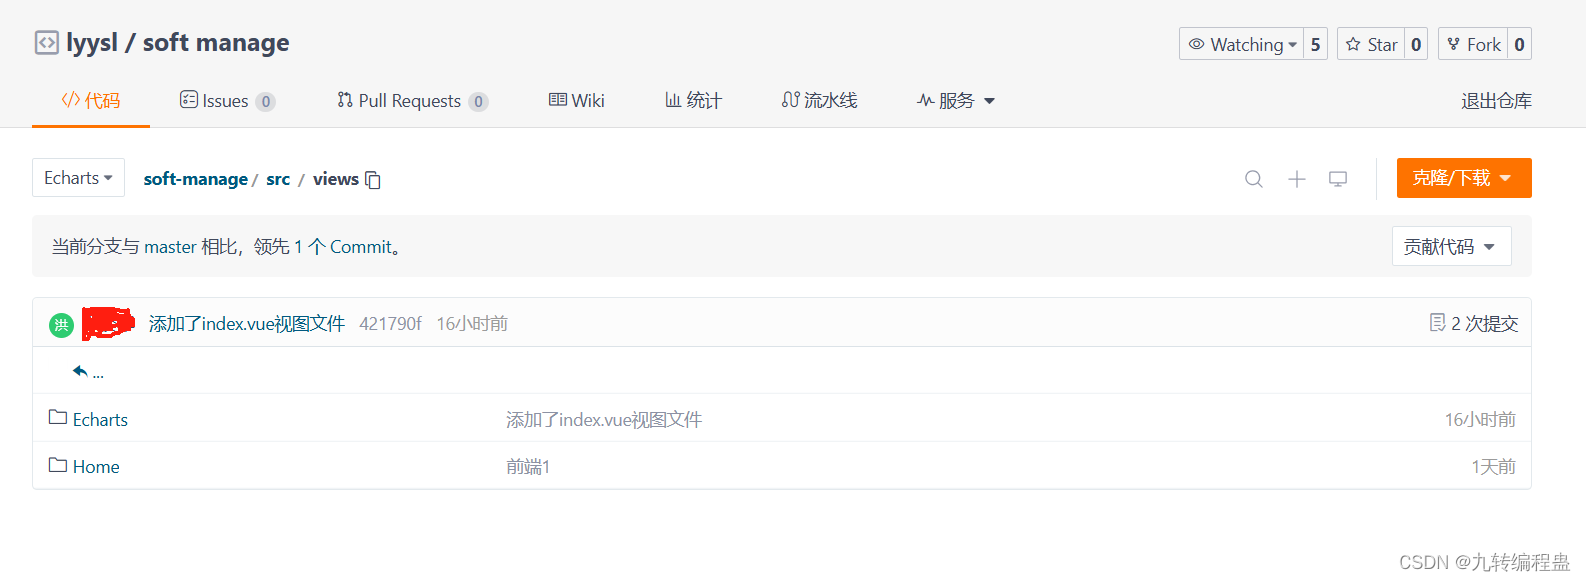
gitee添加别人的仓库后,在该仓库里添加文件夹/文件
一、在指定分支里添加文件夹(如果库主没有创建分支,自己还要先创建分支) eg:以在一个项目里添加视图文件为例,用Echarts分支在usr/views目录下添加Echarts文件夹,usr/views/Echarts目录下添加index.vue 1.切换为本地仓…...
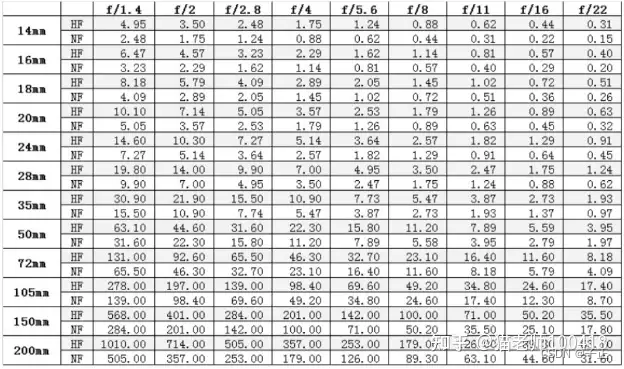
[笔记] CCD相机测距相关的一些基础知识
1.35mm胶片相机等效焦距 https://zhuanlan.zhihu.com/p/419616729 拿到摄像头拍摄的数码照片后,我们会看到这样的信息: 这里显示出了两个焦距:一个是实际焦距:5mm,一个是等效焦距:25mm。 实际焦距很容易…...

【ai】tx2-nx :查看cuda和cudnn
JetSon-nano板卡_从sd卡烧录到tensorRT部署_一条龙 查看 cuda 版本 nvidia@tx2-nx:~$ nvcc -v nvcc fatal : No input files specified; use option --help for more information nvidia@tx2-nx:~$ nvcc -V nvcc: NVIDIA Cuda compiler driver Copyright © 2005-2021 NV…...
 的用法)
webpack 中 require.context() 的用法
一、什么是 require.context It allows you to pass in a directory to search, a flag indicating whether subdirectories should be searched too, and a regular expression to match files against. – webpack 官方说明 一个 webpack 的 api ,通过该函数可以获…...

漫画 | “本世纪最重要的一篇硕士论文诞生了!”
后记:本来想写信息论的,开了一个头以后,不知道怎么就拐到布尔代数那里去了,还好,最终还是和香农扯上了关系。 看过《编码》的同学对中间有一段可能有点熟悉,这一段是改编自《编码》第十章中的内容ÿ…...

Gone框架介绍29 - 在Gone中使用gRPC通信
gone是可以高效开发Web服务的Golang依赖注入框架 github地址:https://github.com/gone-io/gone 文档地址:https://goner.fun/zh/ 文章目录 使用gRPC通信编写proto文件,生成golang代码编写服务端代码注册客户端编写配置文件测试总结 使用gRPC通…...

开源一套Trados Sdlxliff 对比工具
开源一套Trados Sdlxliff 对比工具 在Trados翻译过程中经常对需要进行版本控制和对比,例如对比不同设置下生成的sdlxliff文件,对比不同的机器翻译结果以及对比机器翻译和人工翻译,对比翻译和审校等等。 当然SDL官方也提供了对比工具 https:…...

百度网盘 url 正则表达式
匹配 https://pan.baidu.com/s/1NmVIJiI2Ot8MkI-vxxNPTg?pwdxxxx https://pan.baidu.com/s/[a-zA-Z0-9\-]*(\?pwd[a-zA-Z0-9]{4})?该正则表达式匹配以 https:// 开头,后面跟着 pan.baidu.com/s/ 或 yun.baidu.com/s/,最后跟着一串由大小写字母、数字…...
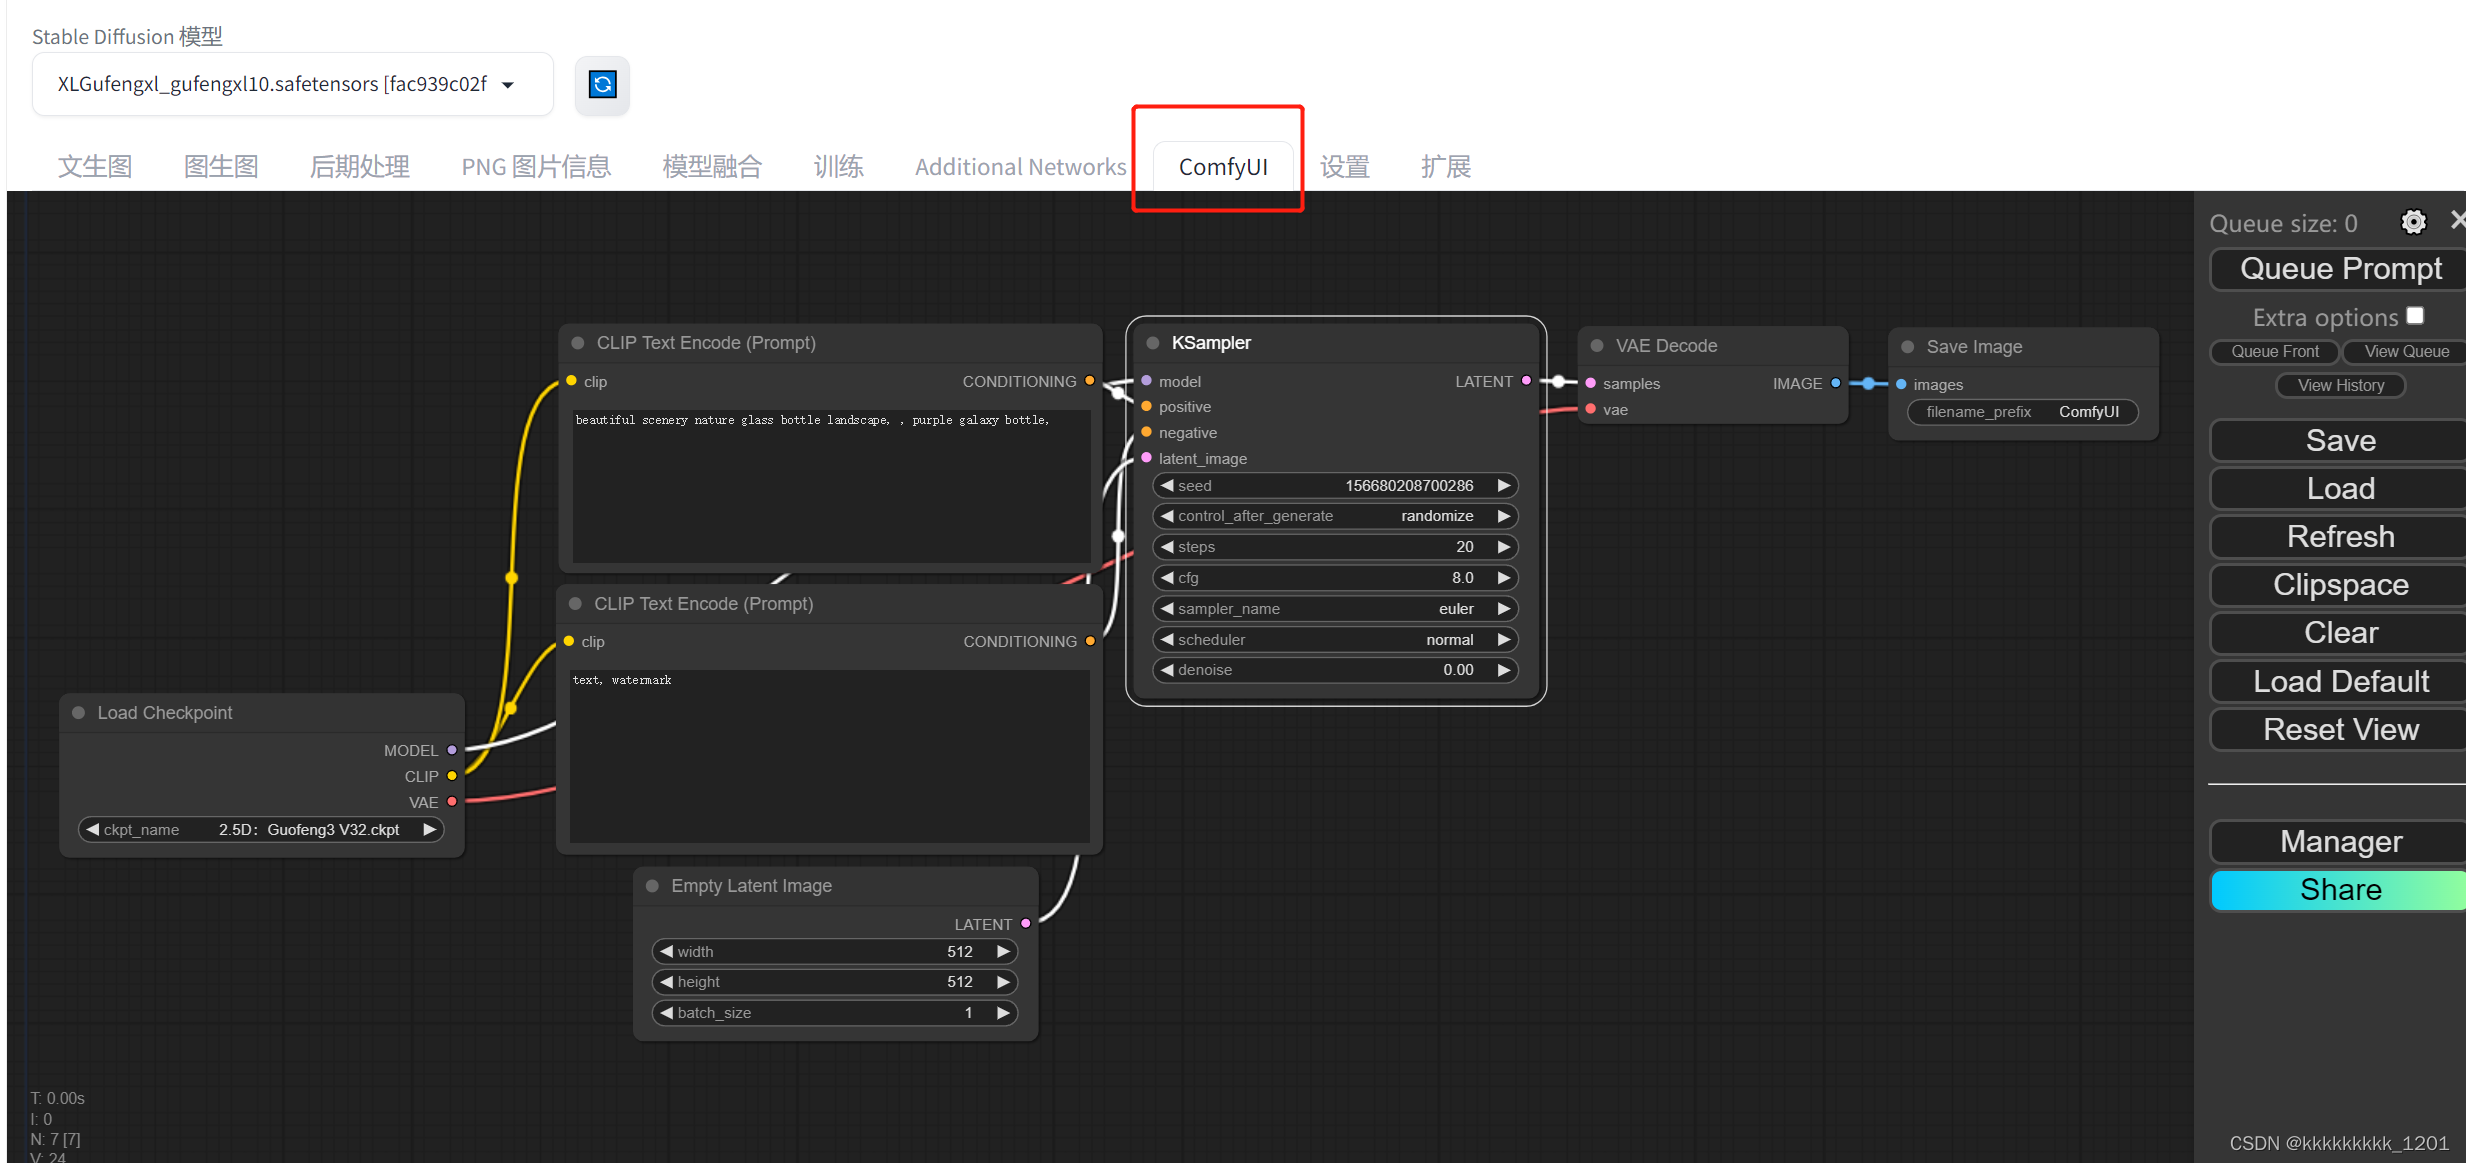
【stable diffusion】ComfyUI扩展安装以及”127.0.0.1拒绝了我们的连接请求“解决记录
目录 扩展安装”127.0.0.1拒绝了我们的连接请求“解决记录操作1操作2操作3操作4总结扩展安装 虽然大家都推荐将扩展包直接放到extension文件夹的方式,但我还是推荐直接在sd webui的扩展处下载,酱紫比较好维护一点,我个人感觉。 按照上图顺序点击会出现”URLError: <url…...
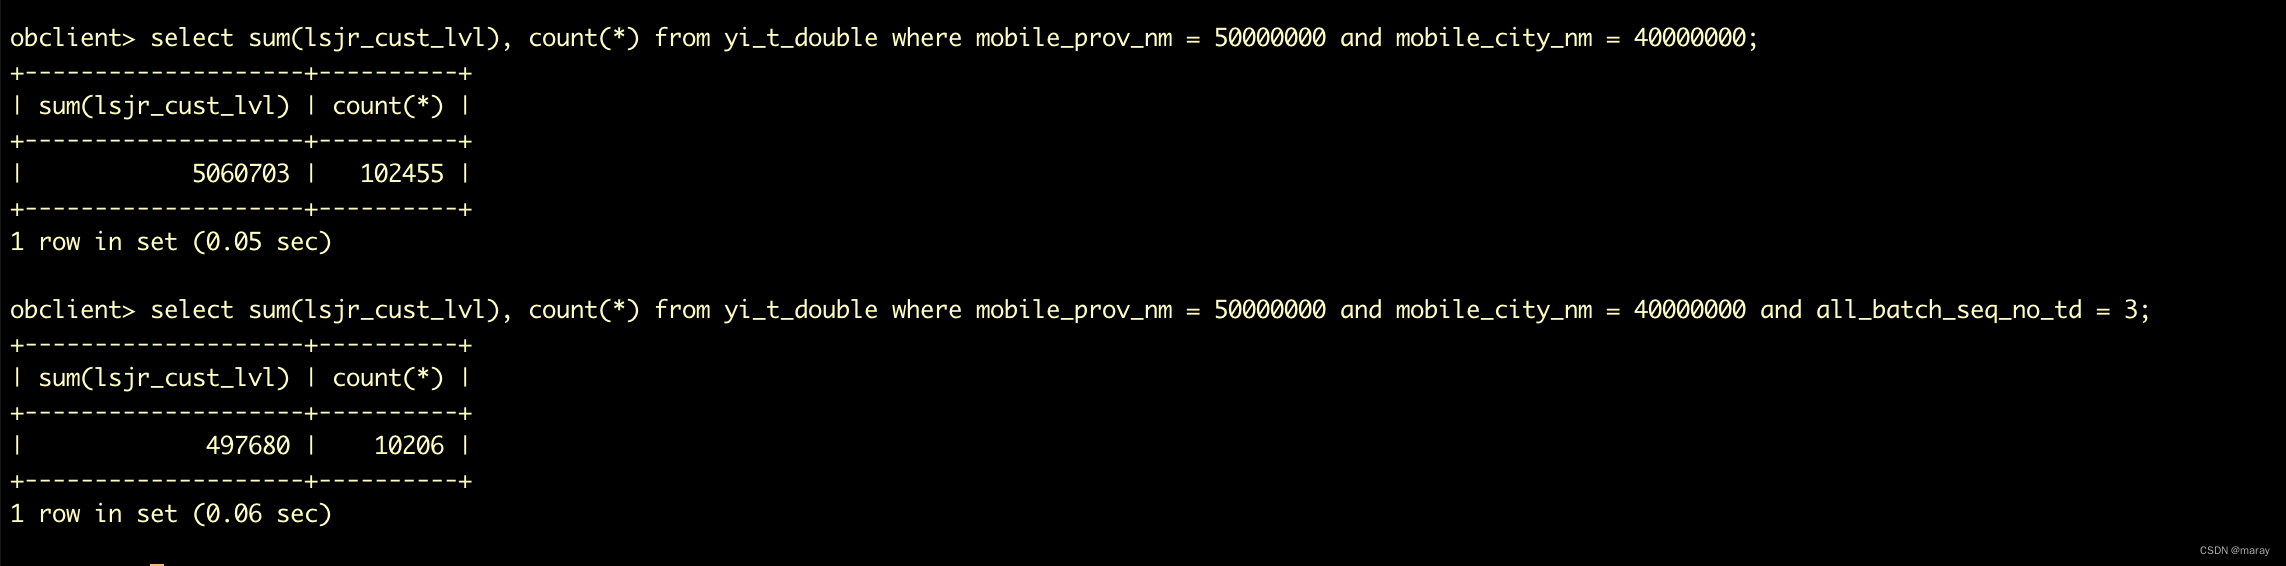
OceanBase 列存中多列过滤性能解析
今天有同事问我,列存大宽表场景下,如果在多个列上有等值过滤条件,OceanBase 的性能是不是无法满足要求? Hi 晓楚,帮评估个OTS替换场景 大概1亿大宽表,查询姿势就是任意字段的组合,进行等值查询g…...

嵌入式实验---实验二 中断功能实验
一、实验目的 1、掌握STM32F103中断程序设计流程; 2、熟悉STM32固件库的基本使用。 二、实验原理 1、在上一章的实验基础上,添加一个按键和一个LED; 2、使用中断的方式实现以下两个功能: (1)KEY1按键…...
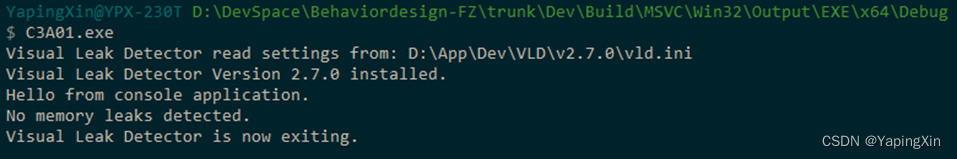
在 Visual Studio 2022 (Visual C++ 17) 中使用 Visual Leak Detector
在 Visual C 2022 中使用 Visual Leak Detector 1 问题描述1.1 内存泄漏的困扰和解决之道1.2 内存泄漏检测工具的选择1.3 VLD的现状 2 安装和设置VLD的环境变量2.1 安装VLD文件2.2 VLD安装后的目录和文件说明2.2.1 include子目录说明2.2.2 lib子目录说明2.2.2.1 目录整理 2.2.3…...
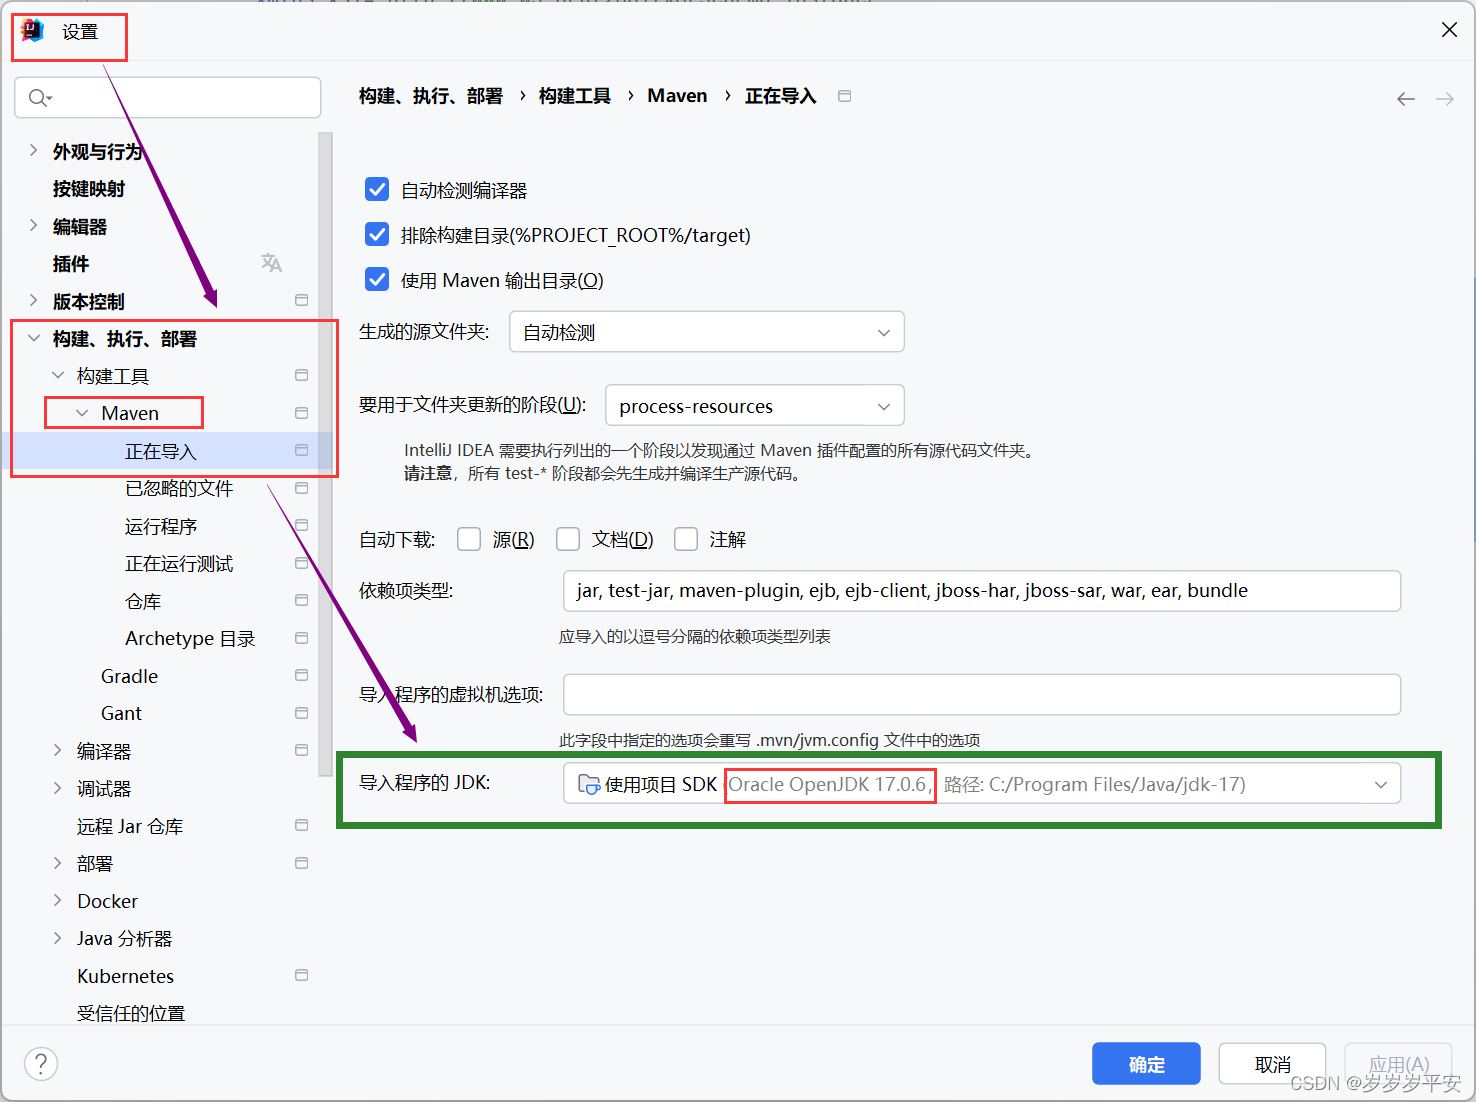
基于IDEA的Maven(properties属性配置)
(property :财产)properties:它的复数。 同样也是基于上篇博客进行学习。(具体的全部项目代码和结构可以去查看上篇...) <properties><!--当前jdk版本 , 这一步可以完全省略--><maven.com…...
_关键概念/优势/应用场景)
边缘计算(Edge Computing)_关键概念/优势/应用场景
边缘计算(Edge Computing)是一种计算范式,它将数据处理和分析从传统的集中式数据中心和云计算平台移至更接近数据生成源头的位置(即“边缘”),例如物联网设备、传感器、路由器或其他边缘设备。边缘计算旨在…...

CTF show Web 红包题第六弹
提示 1.不是SQL注入 2.需要找关键源码 思路 进入页面发现是一个登录框,很难让人不联想到SQL注入,但提示都说了不是SQL注入,所以就不往这方面想了 先查看一下网页源码,发现一段JavaScript代码,有一个关键类ctfs…...

Swift 协议扩展精进之路:解决 CoreData 托管实体子类的类型不匹配问题(下)
概述 在 Swift 开发语言中,各位秃头小码农们可以充分利用语法本身所带来的便利去劈荆斩棘。我们还可以恣意利用泛型、协议关联类型和协议扩展来进一步简化和优化我们复杂的代码需求。 不过,在涉及到多个子类派生于基类进行多态模拟的场景下,…...

iPhone密码忘记了办?iPhoneUnlocker,iPhone解锁工具Aiseesoft iPhone Unlocker 高级注册版分享
平时用 iPhone 的时候,难免会碰到解锁的麻烦事。比如密码忘了、人脸识别 / 指纹识别突然不灵,或者买了二手 iPhone 却被原来的 iCloud 账号锁住,这时候就需要靠谱的解锁工具来帮忙了。Aiseesoft iPhone Unlocker 就是专门解决这些问题的软件&…...
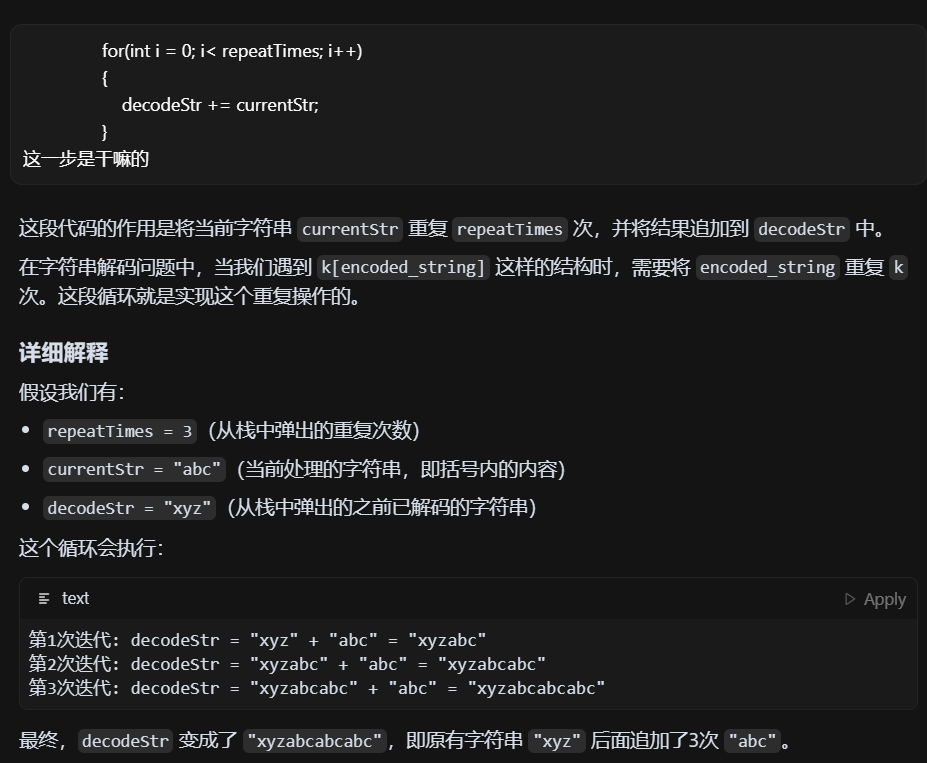
LeetCode - 394. 字符串解码
题目 394. 字符串解码 - 力扣(LeetCode) 思路 使用两个栈:一个存储重复次数,一个存储字符串 遍历输入字符串: 数字处理:遇到数字时,累积计算重复次数左括号处理:保存当前状态&a…...

连锁超市冷库节能解决方案:如何实现超市降本增效
在连锁超市冷库运营中,高能耗、设备损耗快、人工管理低效等问题长期困扰企业。御控冷库节能解决方案通过智能控制化霜、按需化霜、实时监控、故障诊断、自动预警、远程控制开关六大核心技术,实现年省电费15%-60%,且不改动原有装备、安装快捷、…...
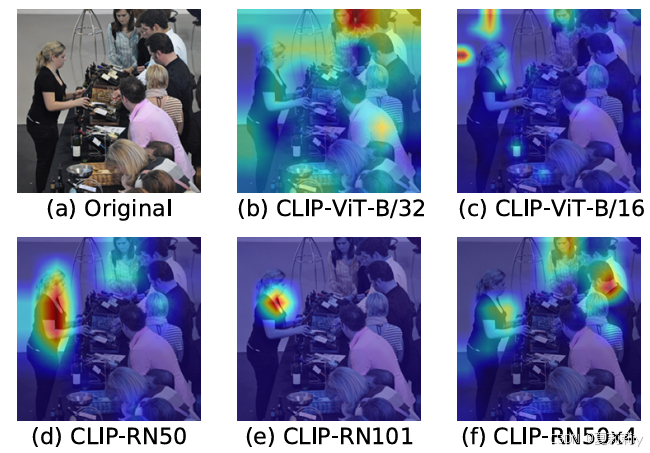
[ICLR 2022]How Much Can CLIP Benefit Vision-and-Language Tasks?
论文网址:pdf 英文是纯手打的!论文原文的summarizing and paraphrasing。可能会出现难以避免的拼写错误和语法错误,若有发现欢迎评论指正!文章偏向于笔记,谨慎食用 目录 1. 心得 2. 论文逐段精读 2.1. Abstract 2…...

三体问题详解
从物理学角度,三体问题之所以不稳定,是因为三个天体在万有引力作用下相互作用,形成一个非线性耦合系统。我们可以从牛顿经典力学出发,列出具体的运动方程,并说明为何这个系统本质上是混沌的,无法得到一般解…...

MySQL中【正则表达式】用法
MySQL 中正则表达式通过 REGEXP 或 RLIKE 操作符实现(两者等价),用于在 WHERE 子句中进行复杂的字符串模式匹配。以下是核心用法和示例: 一、基础语法 SELECT column_name FROM table_name WHERE column_name REGEXP pattern; …...
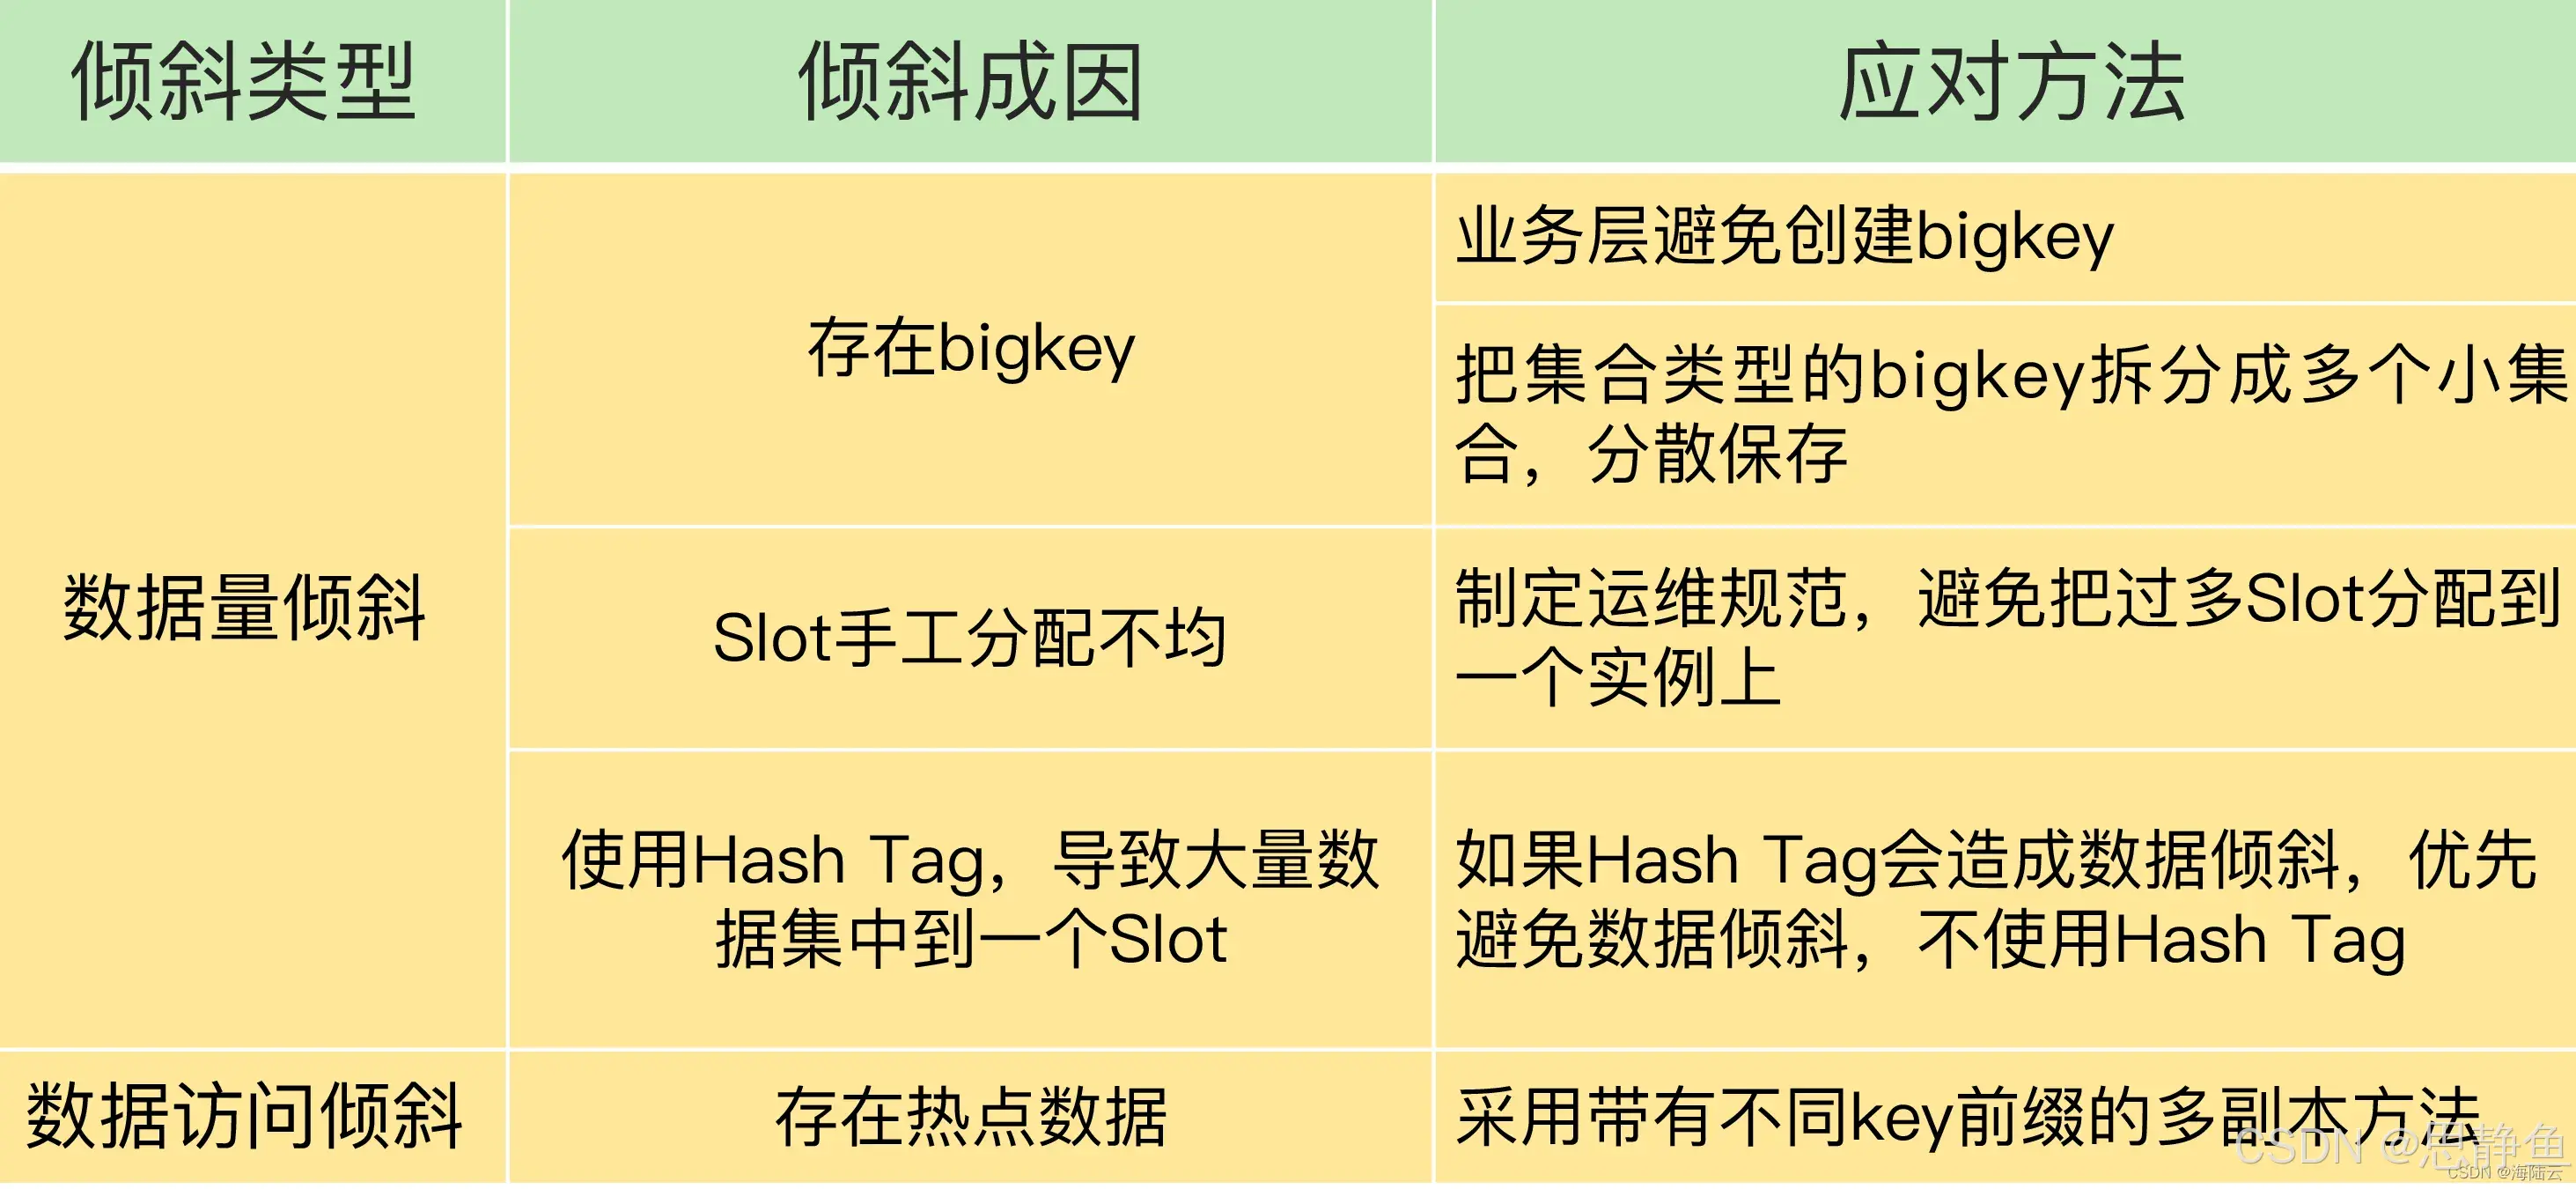
Redis数据倾斜问题解决
Redis 数据倾斜问题解析与解决方案 什么是 Redis 数据倾斜 Redis 数据倾斜指的是在 Redis 集群中,部分节点存储的数据量或访问量远高于其他节点,导致这些节点负载过高,影响整体性能。 数据倾斜的主要表现 部分节点内存使用率远高于其他节…...

代理篇12|深入理解 Vite中的Proxy接口代理配置
在前端开发中,常常会遇到 跨域请求接口 的情况。为了解决这个问题,Vite 和 Webpack 都提供了 proxy 代理功能,用于将本地开发请求转发到后端服务器。 什么是代理(proxy)? 代理是在开发过程中,前端项目通过开发服务器,将指定的请求“转发”到真实的后端服务器,从而绕…...