K8S环境部署Prometheus
K8S环境部署Prometheus
记录在K8S 1.18版本环境下部署Prometheus 0.5版本。
1. 下载kube-prometheus仓库
git clone https://github.com/coreos/kube-prometheus.git
cd kube-prometheus
笔者安装的K8S版本是1.18 ,prometheus选择配套的分支release-0.5:
# 切换到release-0.5
git checkout remotes/origin/release-0.5 -b 0.5
K8S和Pormetheus的配套关系:
| kube-prometheus stack | Kubernetes 1.14 | Kubernetes 1.15 | Kubernetes 1.16 | Kubernetes 1.17 | Kubernetes 1.18 |
|---|---|---|---|---|---|
release-0.3 | ✔ | ✔ | ✔ | ✔ | ✗ |
release-0.4 | ✗ | ✗ | ✔ | ✔ | ✗ |
release-0.5 | ✗ | ✗ | ✗ | ✗ | ✔ |
HEAD | ✗ | ✗ | ✗ | ✗ | ✔ |
最新的版本配套关系查看kube-prometheus官方仓库:https://github.com/prometheus-operator/kube-prometheus ,可以切换版本查看配套关系。
2. 查看manifest
[root@k8s-master kube-prometheus]# cd manifests/
[root@k8s-master manifests]# ll
total 1684
-rw-r--r-- 1 root root     405 Jun 12 16:20 alertmanager-alertmanager.yaml
-rw-r--r-- 1 root root     973 Jun 12 16:20 alertmanager-secret.yaml
-rw-r--r-- 1 root root      96 Jun 12 16:20 alertmanager-serviceAccount.yaml
-rw-r--r-- 1 root root     254 Jun 12 16:20 alertmanager-serviceMonitor.yaml
-rw-r--r-- 1 root root     308 Jun 12 16:22 alertmanager-service.yaml
-rw-r--r-- 1 root root     550 Jun 12 16:20 grafana-dashboardDatasources.yaml
-rw-r--r-- 1 root root 1405645 Jun 12 16:20 grafana-dashboardDefinitions.yaml
-rw-r--r-- 1 root root     454 Jun 12 16:20 grafana-dashboardSources.yaml
-rw-r--r-- 1 root root    7539 Jun 12 16:20 grafana-deployment.yaml
-rw-r--r-- 1 root root      86 Jun 12 16:20 grafana-serviceAccount.yaml
-rw-r--r-- 1 root root     208 Jun 12 16:20 grafana-serviceMonitor.yaml
-rw-r--r-- 1 root root     238 Jun 12 16:22 grafana-service.yaml
-rw-r--r-- 1 root root     376 Jun 12 16:20 kube-state-metrics-clusterRoleBinding.yaml
-rw-r--r-- 1 root root    1651 Jun 12 16:20 kube-state-metrics-clusterRole.yaml
-rw-r--r-- 1 root root    1925 Jun 12 16:20 kube-state-metrics-deployment.yaml
-rw-r--r-- 1 root root     192 Jun 12 16:20 kube-state-metrics-serviceAccount.yaml
-rw-r--r-- 1 root root     829 Jun 12 16:20 kube-state-metrics-serviceMonitor.yaml
-rw-r--r-- 1 root root     403 Jun 12 16:20 kube-state-metrics-service.yaml
-rw-r--r-- 1 root root     266 Jun 12 16:20 node-exporter-clusterRoleBinding.yaml
-rw-r--r-- 1 root root     283 Jun 12 16:20 node-exporter-clusterRole.yaml
-rw-r--r-- 1 root root    2775 Jun 12 16:20 node-exporter-daemonset.yaml
-rw-r--r-- 1 root root      92 Jun 12 16:20 node-exporter-serviceAccount.yaml
-rw-r--r-- 1 root root     711 Jun 12 16:20 node-exporter-serviceMonitor.yaml
-rw-r--r-- 1 root root     355 Jun 12 16:20 node-exporter-service.yaml
-rw-r--r-- 1 root root     292 Jun 12 16:20 prometheus-adapter-apiService.yaml
-rw-r--r-- 1 root root     396 Jun 12 16:20 prometheus-adapter-clusterRoleAggregatedMetricsReader.yaml
-rw-r--r-- 1 root root     304 Jun 12 16:20 prometheus-adapter-clusterRoleBindingDelegator.yaml
-rw-r--r-- 1 root root     281 Jun 12 16:20 prometheus-adapter-clusterRoleBinding.yaml
-rw-r--r-- 1 root root     188 Jun 12 16:20 prometheus-adapter-clusterRoleServerResources.yaml
-rw-r--r-- 1 root root     219 Jun 12 16:20 prometheus-adapter-clusterRole.yaml
-rw-r--r-- 1 root root    1378 Jun 12 16:20 prometheus-adapter-configMap.yaml
-rw-r--r-- 1 root root    1344 Jun 12 16:20 prometheus-adapter-deployment.yaml
-rw-r--r-- 1 root root     325 Jun 12 16:20 prometheus-adapter-roleBindingAuthReader.yaml
-rw-r--r-- 1 root root      97 Jun 12 16:20 prometheus-adapter-serviceAccount.yaml
-rw-r--r-- 1 root root     236 Jun 12 16:20 prometheus-adapter-service.yaml
-rw-r--r-- 1 root root     269 Jun 12 16:20 prometheus-clusterRoleBinding.yaml
-rw-r--r-- 1 root root     216 Jun 12 16:20 prometheus-clusterRole.yaml
-rw-r--r-- 1 root root     621 Jun 12 16:20 prometheus-operator-serviceMonitor.yaml
-rw-r--r-- 1 root root     751 Jun 12 16:20 prometheus-prometheus.yaml
-rw-r--r-- 1 root root     293 Jun 12 16:20 prometheus-roleBindingConfig.yaml
-rw-r--r-- 1 root root     983 Jun 12 16:20 prometheus-roleBindingSpecificNamespaces.yaml
-rw-r--r-- 1 root root     188 Jun 12 16:20 prometheus-roleConfig.yaml
-rw-r--r-- 1 root root     820 Jun 12 16:20 prometheus-roleSpecificNamespaces.yaml
-rw-r--r-- 1 root root   86744 Jun 12 16:20 prometheus-rules.yaml
-rw-r--r-- 1 root root      93 Jun 12 16:20 prometheus-serviceAccount.yaml
-rw-r--r-- 1 root root    6829 Jun 12 16:20 prometheus-serviceMonitorApiserver.yaml
-rw-r--r-- 1 root root     395 Jun 12 16:20 prometheus-serviceMonitorCoreDNS.yaml
-rw-r--r-- 1 root root    6172 Jun 12 16:20 prometheus-serviceMonitorKubeControllerManager.yaml
-rw-r--r-- 1 root root    6778 Jun 12 16:20 prometheus-serviceMonitorKubelet.yaml
-rw-r--r-- 1 root root     347 Jun 12 16:20 prometheus-serviceMonitorKubeScheduler.yaml
-rw-r--r-- 1 root root     247 Jun 12 16:20 prometheus-serviceMonitor.yaml
-rw-r--r-- 1 root root     297 Jun 12 16:21 prometheus-service.yaml
drwxr-xr-x 2 root root    4096 Jun 12 16:20 setup
3. 修改镜像源
修改prometheus-operator,prometheus,alertmanager,kube-state-metrics,node-exporter,prometheus-adapter的镜像源为中科大的镜像源。
sed -i 's/quay.io/quay.mirrors.ustc.edu.cn/g' setup/prometheus-operator-deployment.yaml
sed -i 's/quay.io/quay.mirrors.ustc.edu.cn/g' prometheus-prometheus.yaml
sed -i 's/quay.io/quay.mirrors.ustc.edu.cn/g' alertmanager-alertmanager.yaml
sed -i 's/quay.io/quay.mirrors.ustc.edu.cn/g' kube-state-metrics-deployment.yaml
sed -i 's/quay.io/quay.mirrors.ustc.edu.cn/g' node-exporter-daemonset.yaml
sed -i 's/quay.io/quay.mirrors.ustc.edu.cn/g' prometheus-adapter-deployment.yaml
4. 修改promethes,alertmanager,grafana的service类型为NodePort类型
为了可以从外部访问 prometheus,alertmanager,grafana,我们这里修改 promethes,alertmanager,grafana的 service 类型为 NodePort 类型。
- 修改 prometheus 的 service
[root@k8s-master kube-prometheus]# cat manifests/prometheus-service.yaml
apiVersion: v1
kind: Service
metadata:labels:prometheus: k8sname: prometheus-k8snamespace: monitoring
spec:type: NodePort        # 增加NodePort配置ports:- name: webport: 9090targetPort: webnodePort: 30090       # 增加NodePort配置selector:app: prometheusprometheus: k8ssessionAffinity: ClientIP
- 修改 grafana 的 service
[root@k8s-master kube-prometheus]# cat manifests/grafana-service.yaml
apiVersion: v1
kind: Service
metadata:labels:app: grafananame: grafananamespace: monitoring
spec:type: NodePort      # 增加NodePort配置ports:- name: httpport: 3000targetPort: httpnodePort: 32000   # 增加NodePort配置selector:app: grafana
- 修改 alertmanager 的 service
[root@k8s-master kube-prometheus]# cat manifests/alertmanager-service.yaml
apiVersion: v1
kind: Service
metadata:labels:alertmanager: mainname: alertmanager-mainnamespace: monitoring
spec:type: NodePort    # 增加NodePort配置ports:- name: webport: 9093targetPort: webnodePort: 30093   # 增加NodePort配置selector:alertmanager: mainapp: alertmanagersessionAffinity: ClientIP
5. 安装kube-prometheus
安装CRD和prometheus-operator
[root@k8s-master manifests]# kubectl apply -f setup/
Warning: kubectl apply should be used on resource created by either kubectl create --save-config or kubectl                                    apply
namespace/monitoring configured
Warning: kubectl apply should be used on resource created by either kubectl create --save-config or kubectl                                    apply
customresourcedefinition.apiextensions.k8s.io/alertmanagers.monitoring.coreos.com configured
Warning: kubectl apply should be used on resource created by either kubectl create --save-config or kubectl                                    apply
customresourcedefinition.apiextensions.k8s.io/podmonitors.monitoring.coreos.com configured
Warning: kubectl apply should be used on resource created by either kubectl create --save-config or kubectl                                    apply
customresourcedefinition.apiextensions.k8s.io/prometheuses.monitoring.coreos.com configured
Warning: kubectl apply should be used on resource created by either kubectl create --save-config or kubectl                                    apply
customresourcedefinition.apiextensions.k8s.io/prometheusrules.monitoring.coreos.com configured
Warning: kubectl apply should be used on resource created by either kubectl create --save-config or kubectl                                    apply
customresourcedefinition.apiextensions.k8s.io/servicemonitors.monitoring.coreos.com configured
Warning: kubectl apply should be used on resource created by either kubectl create --save-config or kubectl                                    apply
customresourcedefinition.apiextensions.k8s.io/thanosrulers.monitoring.coreos.com configured
clusterrole.rbac.authorization.k8s.io/prometheus-operator created
clusterrolebinding.rbac.authorization.k8s.io/prometheus-operator created
deployment.apps/prometheus-operator created
service/prometheus-operator created
serviceaccount/prometheus-operator created
[root@k8s-master manifests]# kubectl get pod -n monitoring
NAME                                   READY   STATUS              RESTARTS   AGE
prometheus-operator-5cd4d464cc-b9vqq   0/2     ContainerCreating   0          16s
下载prometheus-operator镜像需要花费几分钟,等待prometheus-operator变成running状态。
安装prometheus, alertmanager, grafana, kube-state-metrics, node-exporter等资源
[root@k8s-master manifests]# kubectl apply -f .
alertmanager.monitoring.coreos.com/main created
secret/alertmanager-main created
service/alertmanager-main created
serviceaccount/alertmanager-main created
servicemonitor.monitoring.coreos.com/alertmanager created
secret/grafana-datasources created
configmap/grafana-dashboard-apiserver created
configmap/grafana-dashboard-cluster-total created
configmap/grafana-dashboard-controller-manager created
configmap/grafana-dashboard-k8s-resources-cluster created
configmap/grafana-dashboard-k8s-resources-namespace created
configmap/grafana-dashboard-k8s-resources-node created
configmap/grafana-dashboard-k8s-resources-pod created
configmap/grafana-dashboard-k8s-resources-workload created
configmap/grafana-dashboard-k8s-resources-workloads-namespace created
configmap/grafana-dashboard-kubelet created
configmap/grafana-dashboard-namespace-by-pod created
configmap/grafana-dashboard-namespace-by-workload created
configmap/grafana-dashboard-node-cluster-rsrc-use created
configmap/grafana-dashboard-node-rsrc-use created
configmap/grafana-dashboard-nodes created
configmap/grafana-dashboard-persistentvolumesusage created
configmap/grafana-dashboard-pod-total created
configmap/grafana-dashboard-prometheus-remote-write created
configmap/grafana-dashboard-prometheus created
configmap/grafana-dashboard-proxy created
configmap/grafana-dashboard-scheduler created
configmap/grafana-dashboard-statefulset created
configmap/grafana-dashboard-workload-total created
configmap/grafana-dashboards created
deployment.apps/grafana created
service/grafana created
serviceaccount/grafana created
servicemonitor.monitoring.coreos.com/grafana created
clusterrole.rbac.authorization.k8s.io/kube-state-metrics created
clusterrolebinding.rbac.authorization.k8s.io/kube-state-metrics created
deployment.apps/kube-state-metrics created
service/kube-state-metrics created
serviceaccount/kube-state-metrics created
servicemonitor.monitoring.coreos.com/kube-state-metrics created
clusterrole.rbac.authorization.k8s.io/node-exporter created
clusterrolebinding.rbac.authorization.k8s.io/node-exporter created
daemonset.apps/node-exporter created
service/node-exporter created
serviceaccount/node-exporter created
servicemonitor.monitoring.coreos.com/node-exporter created
apiservice.apiregistration.k8s.io/v1beta1.metrics.k8s.io created
clusterrole.rbac.authorization.k8s.io/prometheus-adapter created
clusterrole.rbac.authorization.k8s.io/system:aggregated-metrics-reader created
clusterrolebinding.rbac.authorization.k8s.io/prometheus-adapter created
clusterrolebinding.rbac.authorization.k8s.io/resource-metrics:system:auth-delegator created
clusterrole.rbac.authorization.k8s.io/resource-metrics-server-resources created
configmap/adapter-config created
deployment.apps/prometheus-adapter created
rolebinding.rbac.authorization.k8s.io/resource-metrics-auth-reader created
service/prometheus-adapter created
serviceaccount/prometheus-adapter created
clusterrole.rbac.authorization.k8s.io/prometheus-k8s created
clusterrolebinding.rbac.authorization.k8s.io/prometheus-k8s created
servicemonitor.monitoring.coreos.com/prometheus-operator created
prometheus.monitoring.coreos.com/k8s created
rolebinding.rbac.authorization.k8s.io/prometheus-k8s-config created
rolebinding.rbac.authorization.k8s.io/prometheus-k8s created
rolebinding.rbac.authorization.k8s.io/prometheus-k8s created
rolebinding.rbac.authorization.k8s.io/prometheus-k8s created
role.rbac.authorization.k8s.io/prometheus-k8s-config created
role.rbac.authorization.k8s.io/prometheus-k8s created
role.rbac.authorization.k8s.io/prometheus-k8s created
role.rbac.authorization.k8s.io/prometheus-k8s created
prometheusrule.monitoring.coreos.com/prometheus-k8s-rules created
service/prometheus-k8s created
serviceaccount/prometheus-k8s created
servicemonitor.monitoring.coreos.com/prometheus created
servicemonitor.monitoring.coreos.com/kube-apiserver created
servicemonitor.monitoring.coreos.com/coredns created
servicemonitor.monitoring.coreos.com/kube-controller-manager created
servicemonitor.monitoring.coreos.com/kube-scheduler created
servicemonitor.monitoring.coreos.com/kubelet created
等待monitoring命名空间下的pod都变为运行:
[root@k8s-master ~]# kubectl get  pod -n monitoring
NAME                                   READY   STATUS    RESTARTS   AGE
alertmanager-main-0                    2/2     Running   0          157m
alertmanager-main-1                    2/2     Running   0          157m
alertmanager-main-2                    2/2     Running   0          157m
grafana-5c55845445-gh8g7               1/1     Running   0          20h
kube-state-metrics-75f946484-lqrbf     3/3     Running   0          20h
node-exporter-5h5cs                    2/2     Running   0          20h
node-exporter-f28gj                    2/2     Running   0          20h
node-exporter-w9rhr                    2/2     Running   0          20h
prometheus-adapter-7d68d6f886-qwrfg    1/1     Running   0          20h
prometheus-k8s-0                       3/3     Running   0          20h
prometheus-k8s-1                       3/3     Running   0          20h
prometheus-operator-5cd4d464cc-b9vqq   2/2     Running   0          20h
博主部署测试遇到如下问题,解决方式记录如下:
- alertmanager-main的三个容器启动失败,状态为crashLoopBackOff,pod中的其中一个容器无法启动。
Warning Unhealthy 11m (x5 over 11m) kubelet, k8s-node2 Liveness probe failed: Get http://10.244.2.8:9093/-/healthy: dial tcp 10.244.2.8:9093: connect: connection refusedWarning Unhealthy 10m (x10 over 11m) kubelet, k8s-node2 Readiness probe failed: Get http://10.244.2.8:9093/-/ready: dial tcp 10.244.2.8:9093: connect: connection refused
下面的解决方法参考自:https://github.com/prometheus-operator/kube-prometheus/issues/653
# 暂停更新,修改如下资源文件,增加paused:true
kubectl -n monitoring edit alertmanagers.monitoring.coreos.com
...
spec:image: quay.io/prometheus/alertmanager:v0.23.0nodeSelector:kubernetes.io/os: linuxpaused: truepodMetadata:labels:
...[root@k8s-master ~]# kubectl -n monitoring get statefulset.apps/alertmanager-main -o yaml > dump.yaml
# 修改alertmanager-main.yaml,在spec.template.spec添加hostNetwork: true,在文件的234行左右的位置
[root@k8s-master manifests]# vi dump.yaml
...spec:hostNetwork: true   # 增加的内容containers:- args:- --config.file=/etc/alertmanager/config/alertmanager.yaml
...
# 删除livenessProbe和readinessProbe探针
[root@k8s-master manifests]# vi dump.yaml
...livenessProbe:failureThreshold: 10httpGet:path: /-/healthyport: webscheme: HTTPperiodSeconds: 10successThreshold: 1timeoutSeconds: 3
...readinessProbe:failureThreshold: 10httpGet:path: /-/readyport: webscheme: HTTPinitialDelaySeconds: 3periodSeconds: 5successThreshold: 1timeoutSeconds: 3
...# 删除原有的statefulset,重新创建
[root@k8s-master ~]# kubectl delete statefulset.apps/alertmanager-main -n monitoring
[root@k8s-master ~]# kubectl create -f dump.yaml
- 其中一个alertmanager状态为pendding,查看原因为不满足节点调度要求。
解决方法如下,
# 去除污点
kubectl describe node k8s-master | grep Taints
kubectl taint nodes k8s-master node-role.kubernetes.io/master-
6. 访问prometheus,alert-manager,grafana
- 访问prometheus
浏览器打开http://192.168.0.51:30090,192.168.0.51为master的IP
- 访问alert-manager
浏览器打开http://192.168.0.51:30093
- 访问grafana
浏览器打开http://192.168.0.51:32000
用户名/密码:admin/admin
相关文章:

K8S环境部署Prometheus
K8S环境部署Prometheus 记录在K8S 1.18版本环境下部署Prometheus 0.5版本。 1. 下载kube-prometheus仓库 git clone https://github.com/coreos/kube-prometheus.git cd kube-prometheus笔者安装的K8S版本是1.18 ,prometheus选择配套的分支release-0.5࿱…...

在linux系统上挂载新硬盘
服务器的硬盘空间不够了,自己重新安装了一个硬盘,需要挂载,因为只是用来存放数据,所以不需要分区,直接挂载就可以 #查看当前所有硬盘 sudo fdisk -l #用于显示文件系统的磁盘空间使用情况 df -h发现一个/dev/nvme0n1 …...

1004.最大连续1的个数
给定一个二进制数组 nums 和一个整数 k,如果可以翻转最多 k 个 0 ,则返回 数组中连续 1 的最大个数 。 示例 1: 输入:nums [1,1,1,0,0,0,1,1,1,1,0], K 2 输出:6 解释:[1,1,1,0,0,1,1,1,1,1,1] 粗体数字…...

【机器学习300问】116、什么是序列模型?序列模型能干什么?
一、序列模型是什么? 序列模型是机器学习领域中专门设计来处理具有时间顺序或序列结构数据的模型。这类模型能够理解和学习数据中的顺序依赖关系,因此非常适合诸如自然语言处理、语音识别、音乐生成、时间序列预测等任务。 看了上面的定义,似…...

kafka 快速上手
下载 Apache Kafka 演示window 安装 编写启动脚本,脚本的路径根据自己实际的来 启动说明 先启动zookeeper后启动kafka,关闭是先关kafka,然后关闭zookeeper 巧记: 铲屎官(zookeeper)总是第一个到,最后一个走 启动zookeeper call bi…...

Python记忆组合透明度语言模型
🎯要点 🎯浏览器语言推理识别神经网络 | 🎯不同语言秽语训练识别数据集 | 🎯交互式语言处理解释 Transformer 语言模型 | 🎯可视化Transformer 语言模型 | 🎯语言模型生成优质歌词 | 🎯模型不确…...
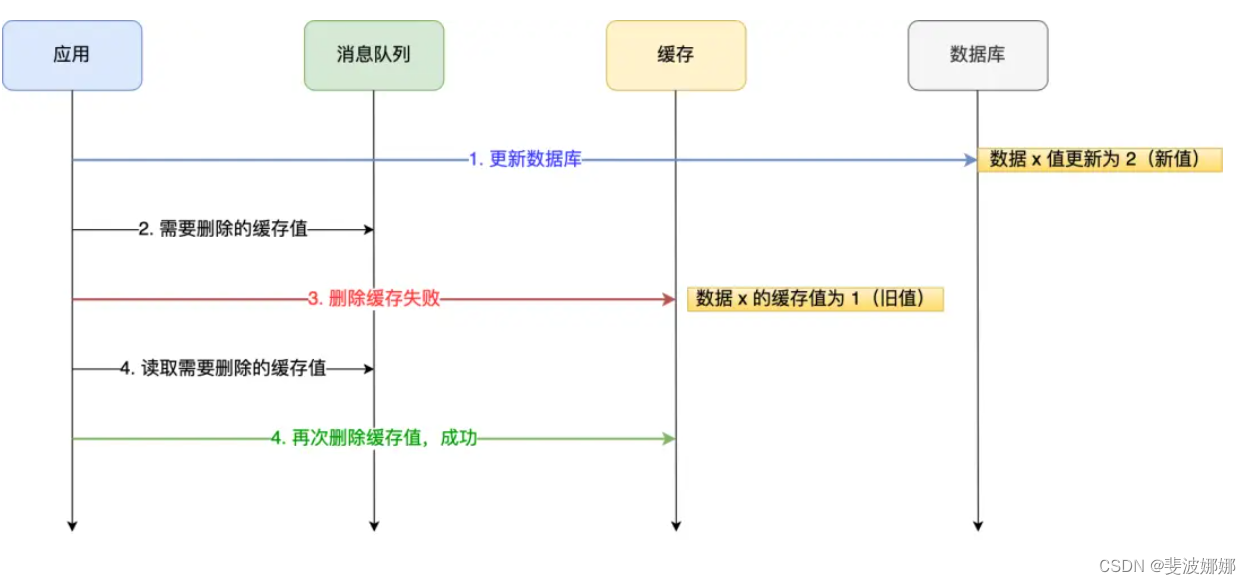
如何保证数据库和缓存的一致性
背景:为了提高查询效率,一般会用redis作为缓存。客户端查询数据时,如果能直接命中缓存,就不用再去查数据库,从而减轻数据库的压力,而且redis是基于内存的数据库,读取速度比数据库要快很多。 更新…...

Java基础 - 多线程
多线程 创建新线程 实例化一个Thread实例,然后调用它的start()方法 Thread t new Thread(); t.start(); // 启动新线程从Thread派生一个自定义类,然后覆写run()方法: public class Main {public static void main(String[] args) {Threa…...

云顶之弈-测试报告
一. 项目背景 个人博客系统采用前后端分离的方法来实现,同时使用了数据库来存储相关的数据,同时将其部署到云服务器上。前端主要有四个页面构成:登录页、列表页、详情页以及编辑页,以上模拟实现了最简单的个人博客系统。其结合后…...
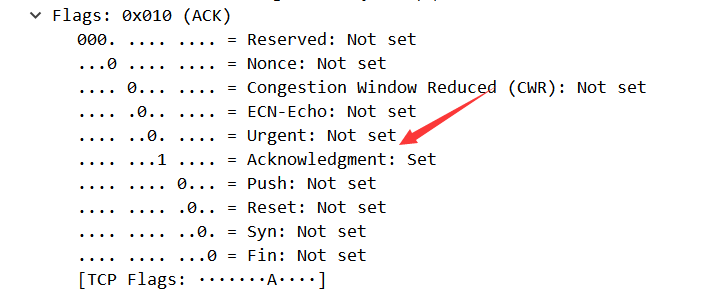
TCP/IP协议分析实验:通过一次下载任务抓包分析
TCP/IP协议分析 一、实验简介 本实验主要讲解TCP/IP协议的应用,通过一次下载任务,抓取TCP/IP数据报文,对TCP连接和断开的过程进行分析,查看TCP“三次握手”和“四次挥手”的数据报文,并对其进行简单的分析。 二、实…...
)
Python项目开发实战:企业QQ小程序(案例教程)
一、引言 在当今数字化快速发展的时代,企业对于线上服务的需求日益增长。企业QQ小程序作为一种轻量级的应用形态,因其无需下载安装、即开即用、占用内存少等优势,受到了越来越多企业的青睐。本文将以Python语言为基础,探讨如何开发一款企业QQ小程序,以满足企业的实际需求。…...

list模拟与实现(附源码)
文章目录 声明list的简单介绍list的简单使用list中sort效率测试list的简单模拟封装迭代器insert模拟erase模拟头插、尾插、头删、尾删模拟自定义类型迭代器遍历const迭代器clear和析构函数拷贝构造(传统写法)拷贝构造(现代写法) 源…...

Java应用中文件上传安全性分析与安全实践
✨✨谢谢大家捧场,祝屏幕前的小伙伴们每天都有好运相伴左右,一定要天天开心哦!✨✨ 🎈🎈作者主页: 喔的嘛呀🎈🎈 目录 引言 一. 文件上传的风险 二. 使用合适的框架和库 1. Spr…...
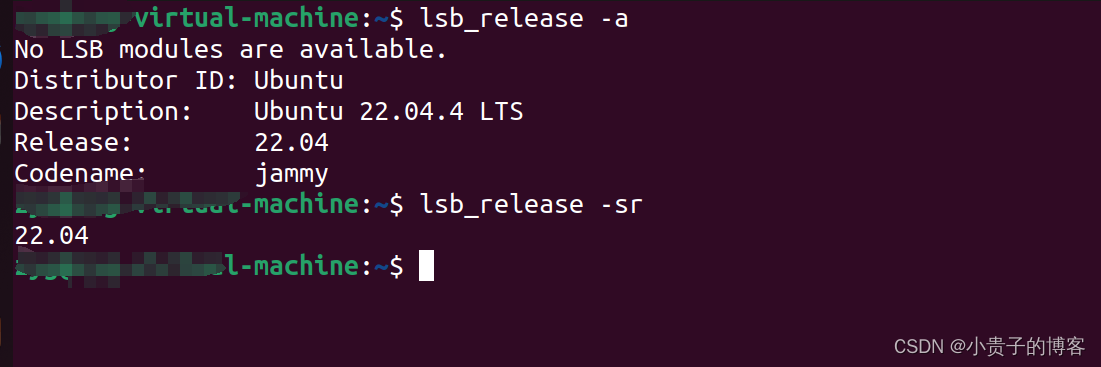
noVNC 小记
1. 怎么查看Ubuntu版本...
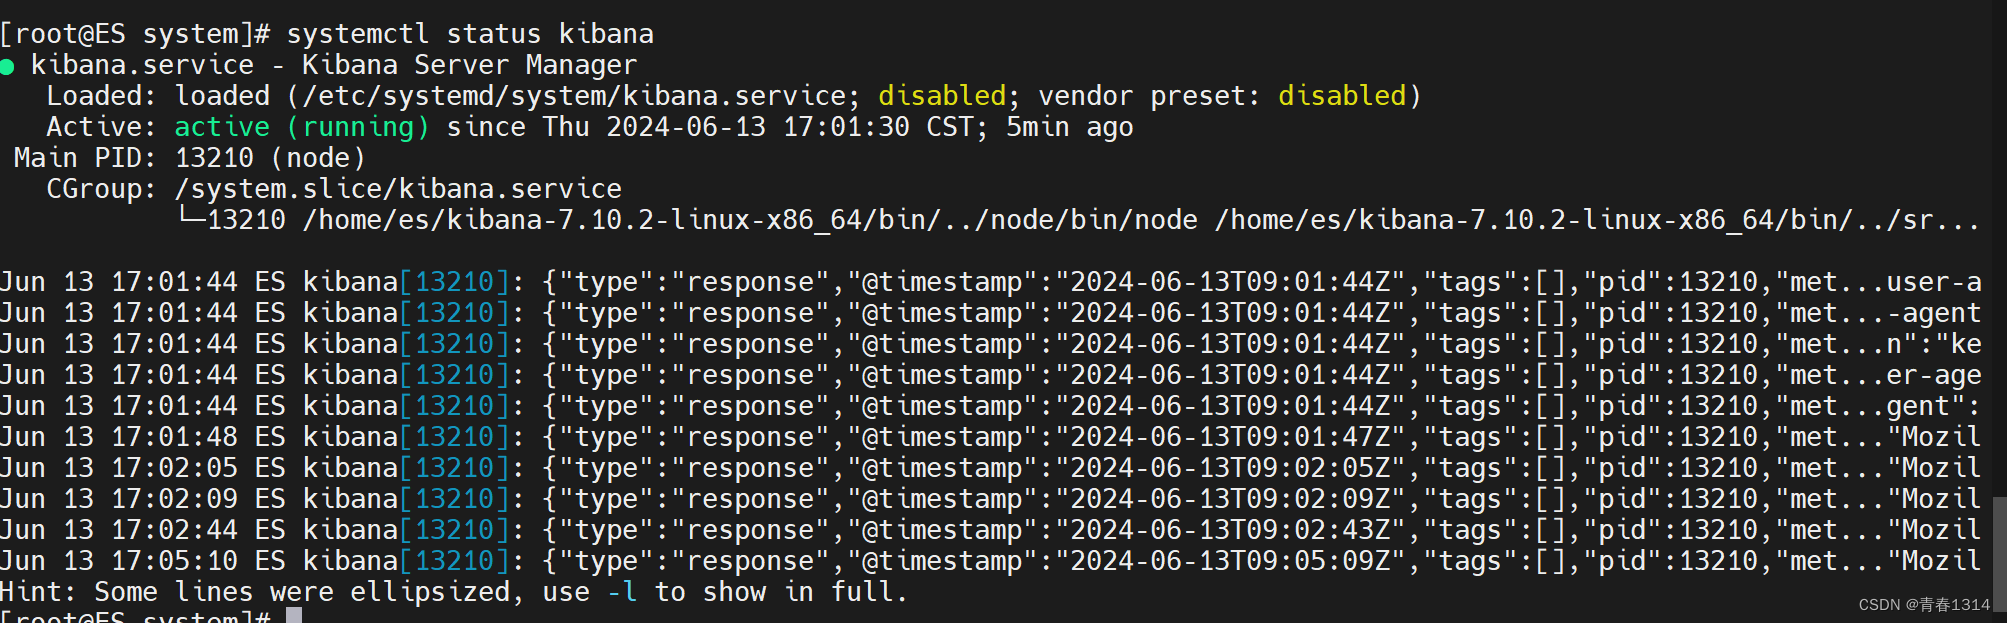
设置systemctl start kibana启动kibana
1、编辑kibana.service vi /etc/systemd/system/kibana.service [Unit] DescriptionKibana Server Manager [Service] Typesimple Useres ExecStart/home/es/kibana-7.10.2-linux-x86_64/bin/kibana PrivateTmptrue [Install] WantedBymulti-user.target 2、启动kibana # 刷…...

PostgreSQL:在CASE WHEN语句中使用SELECT语句
CASE WHEN语句是一种条件语句,用于多条件查询,相当于java的if/else。它允许我们根据不同的条件执行不同的操作。你甚至能在条件里面写子查询。而在一些情况下,我们可能需要在CASE WHEN语句中使用SELECT语句来检索数据或计算结果。下面是一些示…...

游戏心理学Day13
游戏成瘾 成瘾的概念来自于药物依赖,表现为为了感受药物带来的精神效应,或是为了避免由于断药所引起的不适和强迫性,连续定期使用该药的 行为现在成瘾除了药物成瘾外,还包括行为成瘾。成瘾的核心特征是不知道成瘾的概念来自于药…...

GitLab中用户权限
0 Preface/Foreword 1 权限介绍 包含5种权限: Guest(访客):可以创建issue、发表comment,不能读写版本库Reporter(报告者):可以克隆代码,不能提交。适合QA/PMDeveloper&…...

RunMe_About PreparationForDellBiosWUTTest
:: ***************************************************************************************************************************************************************** :: 20240613 :: 该脚本可以用作BIOS WU测试前的准备工作,包括:自动检测"C:\DellB…...

C++中变量的使用细节和命名方案
C中变量的使用细节和命名方案 C提倡使用有一定含义的变量名。如果变量表示差旅费,应将其命名为cost_of_trip或 costOfTrip,而不要将其命名为x或cot。必须遵循几种简单的 C命名规则。 在名称中只能使用字母字符、数字和下划线()。 名称的第一个字符不能是数字。 区分…...

南北阁4.1-3B极简WebUI入门必看:无需React/Vue的纯Python前端方案
南北阁4.1-3B极简WebUI入门必看:无需React/Vue的纯Python前端方案 想给本地部署的南北阁(Nanbeige)4.1-3B大模型配一个好看又好用的聊天界面,是不是一想到要学React、Vue这些前端框架就头大?或者觉得Streamlit做出来的…...

考虑气电联合需求响应的气电综合能源配网系统协调优化运行代码功能说明
考虑气电联合需求响应的 气电综合能源配网系统协调优化运行 该文提出气电综合能源配网系统最优潮流的凸优化方法,即利用二阶锥规划方法对配电网潮流方 程约束进行处理,并提出运用增强二阶锥规划与泰勒级数展开相结合的方法对天然气潮流方程约束进行处理&…...

DirectDraw兼容性新纪元:让经典游戏在现代Windows系统重生
DirectDraw兼容性新纪元:让经典游戏在现代Windows系统重生 【免费下载链接】DDrawCompat DirectDraw and Direct3D 1-7 compatibility, performance and visual enhancements for Windows Vista, 7, 8, 10 and 11 项目地址: https://gitcode.com/gh_mirrors/dd/DD…...

Ubuntu 20.04 手动升级 OpenSSL 3.x 的完整指南
1. 为什么需要手动升级OpenSSL? Ubuntu 20.04默认安装的是OpenSSL 1.1.1版本,虽然这个版本仍然在维护周期内,但新发布的OpenSSL 3.x系列带来了许多重要改进。我在实际项目中遇到过这样的情况:某个新开发的加密功能必须依赖OpenSSL…...

从乐高到变速箱:用一个完整案例,带你吃透SolidWorks自顶向下设计
从乐高到变速箱:用一个完整案例,带你吃透SolidWorks自顶向下设计 1. 为什么自顶向下设计是机械工程师的必修课 第一次用SolidWorks完成齿轮箱设计时,我犯了个典型错误——先画好所有齿轮和轴,最后才考虑箱体结构。结果发现轴承座位…...

OpenClaw安全加固:Phi-3-vision服务接口的权限控制实践
OpenClaw安全加固:Phi-3-vision服务接口的权限控制实践 1. 为什么需要安全加固? 上周我在本地部署了Phi-3-vision多模态模型,通过OpenClaw实现了一个智能图片分析工作流。但当我用手机测试时,意外发现任何人都能通过公网IP访问我…...

基于三菱PLC和组态王的恒温控制系统:加热炉温度控制设计-含梯形图程序、接线图原理图及IO分配...
基于三菱PLC和组态王恒温控制系统的设计加热炉温度控制 带解释的梯形图程序,接线图原理图图纸,io分配,组态画面三伏天里给车间加热炉做恒温控制,那酸爽就跟抱着暖气片吃火锅似的。今天咱们来聊聊基于三菱FX3U PLC和组态王的温度控…...

策略模式:灵活切换算法的艺术,C++多态。
策略模式概述 策略模式是一种行为设计模式,允许在运行时选择算法的行为。它将算法封装成独立的类,使得它们可以互相替换,而不会影响客户端代码。策略模式的核心思想是将算法的定义与使用分离,增强系统的灵活性和可扩展性。 策略模…...

python cython
## 当Python需要速度:聊聊Cython的里里外外 做Python开发时间长了,总会遇到一些让人头疼的场景。代码逻辑明明很清晰,运行起来却慢得让人想砸键盘。特别是那些涉及大量数值计算、循环嵌套的部分,用纯Python写起来优雅,…...

OpenClaw技能开发入门:为Qwen3-32B定制专属文件分类器
OpenClaw技能开发入门:为Qwen3-32B定制专属文件分类器 1. 为什么需要文件分类技能 上周我的桌面又变成了"数字垃圾场"——下载文件夹里混杂着PDF报告、会议录音、临时截图和一堆未命名的压缩包。当我第三次因为找不到客户合同而错过deadline时ÿ…...