Python应用开发——30天学习Streamlit Python包进行APP的构建(9)
st.area_chart
显示区域图。
这是围绕 st.altair_chart 的语法糖。主要区别在于该命令使用数据自身的列和指数来计算图表的 Altair 规格。因此,在许多 "只需绘制此图 "的情况下,该命令更易于使用,但可定制性较差。
如果 st.area_chart 无法正确猜测数据规格,请尝试使用 st.altair_chart 指定所需的图表。
| Function signature[source] | |
|---|---|
| st.area_chart(data=None, *, x=None, y=None, color=None, width=None, height=None, use_container_width=True) | |
| Parameters | |
| data (pandas.DataFrame, pandas.Styler, pyarrow.Table, numpy.ndarray, pyspark.sql.DataFrame, snowflake.snowpark.dataframe.DataFrame, snowflake.snowpark.table.Table, Iterable, or dict) | Data to be plotted. |
| x (str or None) | Column name to use for the x-axis. If None, uses the data index for the x-axis. |
| y (str, Sequence of str, or None) | Column name(s) to use for the y-axis. If a Sequence of strings, draws several series on the same chart by melting your wide-format table into a long-format table behind the scenes. If None, draws the data of all remaining columns as data series. |
| color (str, tuple, Sequence of str, Sequence of tuple, or None) | The color to use for different series in this chart. For an area chart with just 1 series, this can be:
For an area chart with multiple series, where the dataframe is in long format (that is, y is None or just one column), this can be:
For an area chart with multiple series, where the dataframe is in wide format (that is, y is a Sequence of columns), this can be:
|
| width (int or None) | Desired width of the chart expressed in pixels. If width is None (default), Streamlit sets the width of the chart to fit its contents according to the plotting library, up to the width of the parent container. If width is greater than the width of the parent container, Streamlit sets the chart width to match the width of the parent container. |
| height (int or None) | Desired height of the chart expressed in pixels. If height is None (default), Streamlit sets the height of the chart to fit its contents according to the plotting library. |
| use_container_width (bool) | Whether to override width with the width of the parent container. If use_container_width is False (default), Streamlit sets the chart's width according to width. If use_container_width is True, Streamlit sets the width of the chart to match the width of the parent container. |
代码
import streamlit as st
import pandas as pd
import numpy as npchart_data = pd.DataFrame(np.random.randn(20, 3), columns=["a", "b", "c"])st.area_chart(chart_data)
这段代码使用了Streamlit库来创建一个简单的Web应用程序。首先导入了streamlit、pandas和numpy库。然后创建了一个包含20行3列随机数的DataFrame,并命名为chart_data,列名分别为"a"、"b"和"c"。最后使用Streamlit的area_chart函数将chart_data作为参数,创建了一个面积图展示在Web应用程序上。

您还可以为 x 和 y 选择不同的列,以及根据第三列动态设置颜色(假设您的数据帧是长格式):
import streamlit as st
import pandas as pd
import numpy as npchart_data = pd.DataFrame({"col1": np.random.randn(20),"col2": np.random.randn(20),"col3": np.random.choice(["A", "B", "C"], 20),}
)st.area_chart(chart_data, x="col1", y="col2", color="col3")
这段代码使用了Streamlit库来创建一个简单的数据可视化应用。首先导入了需要的库,包括streamlit、pandas和numpy。然后创建了一个包含随机数据的DataFrame对象chart_data,其中包括了三列数据:col1、col2和col3。接下来使用Streamlit的area_chart函数将这些数据可视化为一个面积图,其中x轴为col1,y轴为col2,颜色由col3决定。最终,这段代码将会在Streamlit应用中展示一个面积图,显示出col1和col2之间的关系,并用不同的颜色表示col3的取值。
最后,如果您的数据帧是宽格式,您可以在 y 参数下对多列进行分组,以不同的颜色显示多个序列:
import streamlit as st
import pandas as pd
import numpy as npchart_data = pd.DataFrame(np.random.randn(20, 3), columns=["col1", "col2", "col3"])st.area_chart(chart_data, x="col1", y=["col2", "col3"], color=["#FF0000", "#0000FF"]  # Optional
)
这段代码使用Streamlit库创建了一个面积图。首先,它导入了streamlit、pandas和numpy库。然后,它使用numpy生成了一个包含随机数据的DataFrame,并将其命名为chart_data。随后,使用st.area_chart()函数创建了一个面积图,其中x轴使用"col1"列的数据,y轴使用"col2"和"col3"列的数据,同时可以选择性地指定颜色参数来设置面积图的颜色。

element.add_rows
将一个数据帧连接到当前数据帧的底部。
| Function signature[source] | |
|---|---|
| element.add_rows(data=None, **kwargs) | |
| Parameters | |
| data (pandas.DataFrame, pandas.Styler, pyarrow.Table, numpy.ndarray, pyspark.sql.DataFrame, snowflake.snow | |
相关文章:
Python应用开发——30天学习Streamlit Python包进行APP的构建(9)
st.area_chart 显示区域图。 这是围绕 st.altair_chart 的语法糖。主要区别在于该命令使用数据自身的列和指数来计算图表的 Altair 规格。因此,在许多 "只需绘制此图 "的情况下,该命令更易于使用,但可定制性较差。 如果 st.area_chart 无法正确猜测数据规格,请…...

智慧园区数字化能源云平台的多元化应用场景,您知道哪些?
智慧园区数字化能源云平台的多元化应用场景,您知道哪些? 智慧园区数字化能源云平台,作为新一代信息技术与传统能源管理深度融合的典范,正引领着产业园区向智慧化、绿色化转型的浪潮。该平台依托于大数据、云计算及人工智能等前沿…...

操作系统入门 -- 死锁
操作系统入门 – 死锁 1.什么是死锁、死锁产生的条件 1.1 死锁 在两个或多个并发进程中,如果每个进程都持有某种资源,并且正在等待其他进程释放它或进程都保持资源,在当前状态下无法推进。通俗来说就是两个或多个进程进入无限期阻塞、互相…...

结合Boosting理论与深度ResNet:ICML2018论文代码详解与实现
代码见:JordanAsh/boostresnet: A PyTorch implementation of BoostResNet 原始论文:Huang F, Ash J, Langford J, et al. Learning deep resnet blocks sequentially using boosting theory[C]//International Conference on Machine Learning. PMLR, 2…...

Python使用策略模式绘制图片分析多组数据
趋势分析:折线图静态比较:条形图分布分析:箱线图离散情况:散点图 import matplotlib.pylab as plt from abc import ABC, abstractmethod import seaborn as sns import pandas as pd import plotly.graph_objects as go import p…...
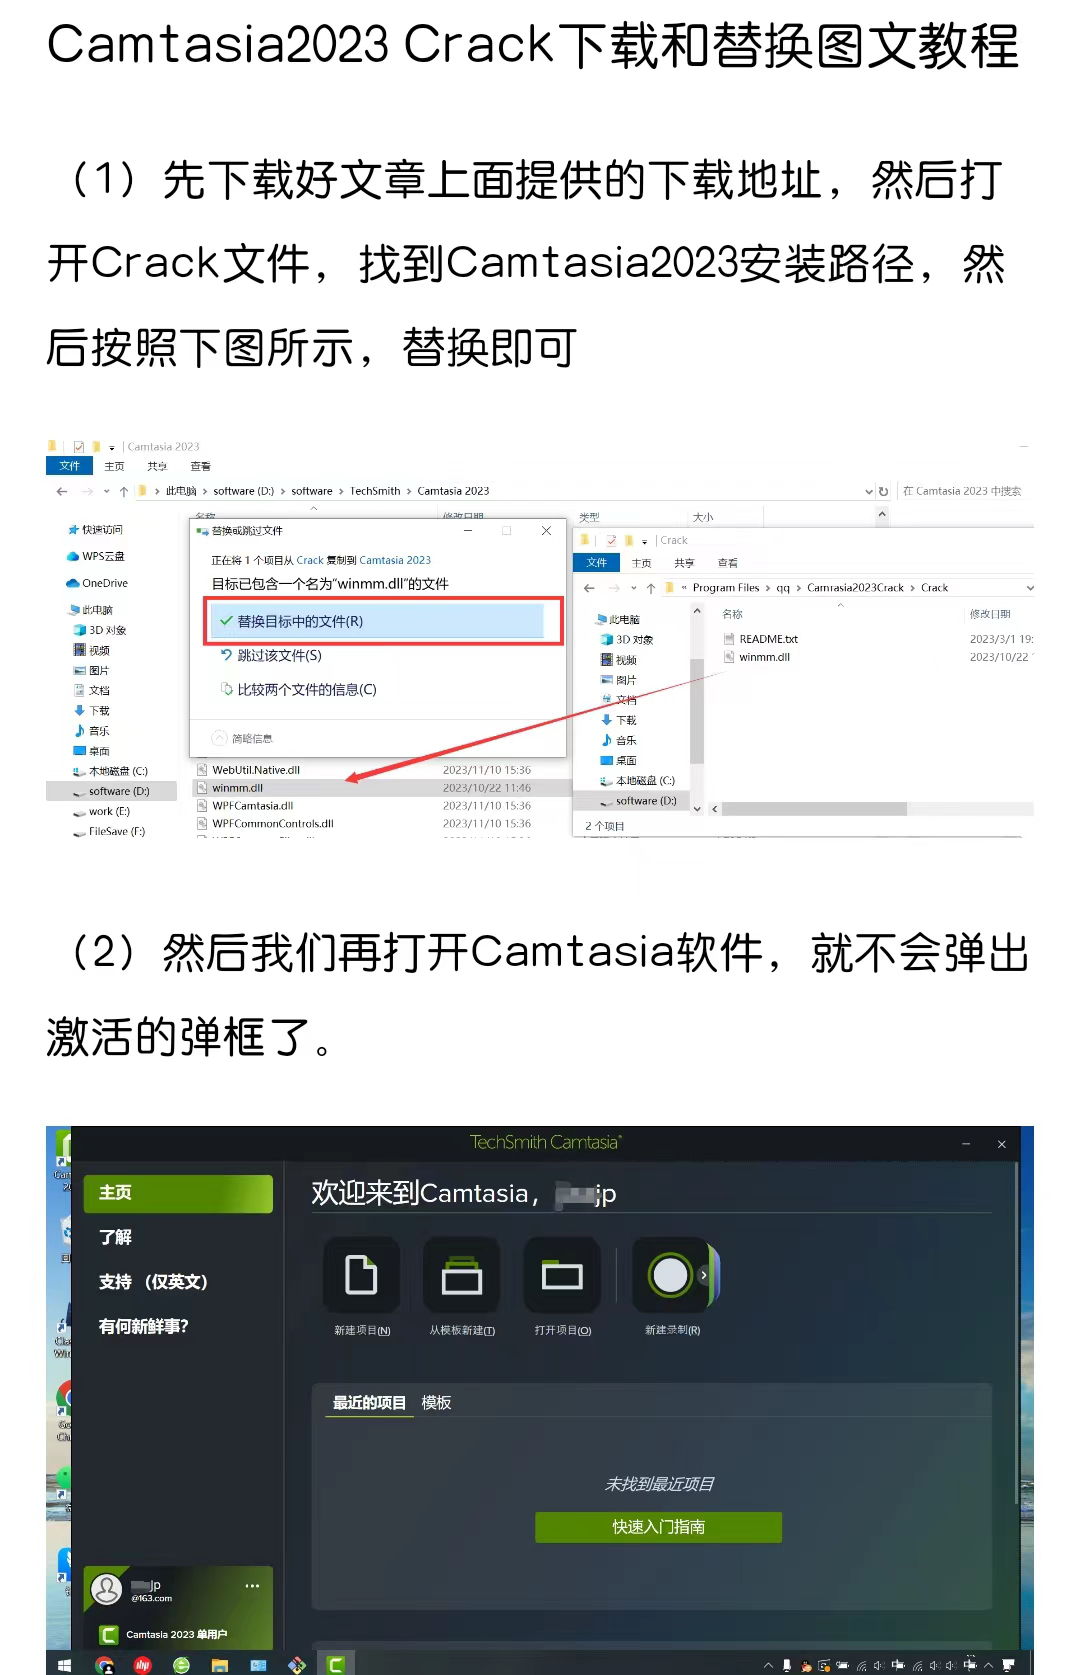
【软件下载】Camtasia Studio 2024详细安装教程视频
习惯上来说Camtasia Studio是一款简单易用的高清录屏和视频编辑软件,拥有录制屏幕和配音、视频的剪辑和过场动画片、添加说明字幕和水印、制作视频封面和菜单、视频压缩和播放。不得不说Camtasia是一款屏幕录制和视频剪辑软件,教授课程,培训他…...
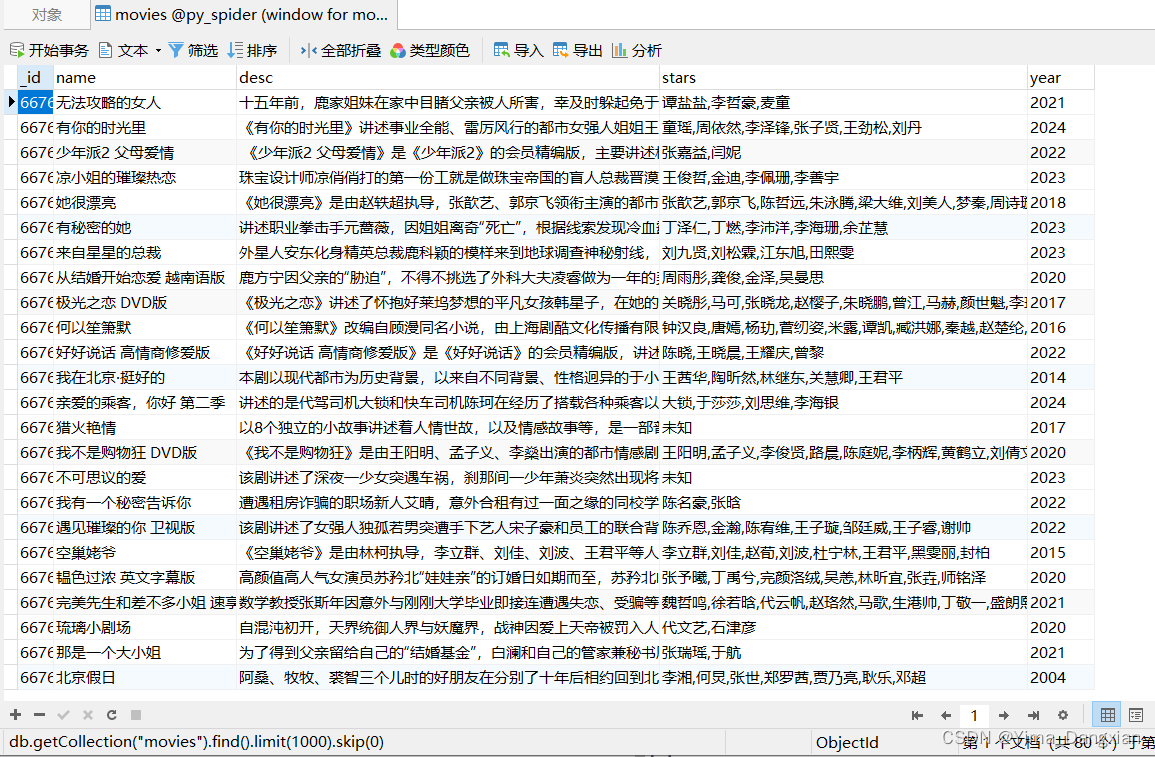
爬虫笔记15——爬取网页数据并使用redis数据库set类型去重存入,以爬取芒果踢V为例
下载redis数据库 首先需要下载redis数据库,可以直接去Redis官网下载。或者可以看这里下载过程。 pycharm项目文件下载redis库 > pip install redis 然后在程序中连接redis服务: from redis import RedisredisObj Redis(host127.0.0.1, port6379)…...
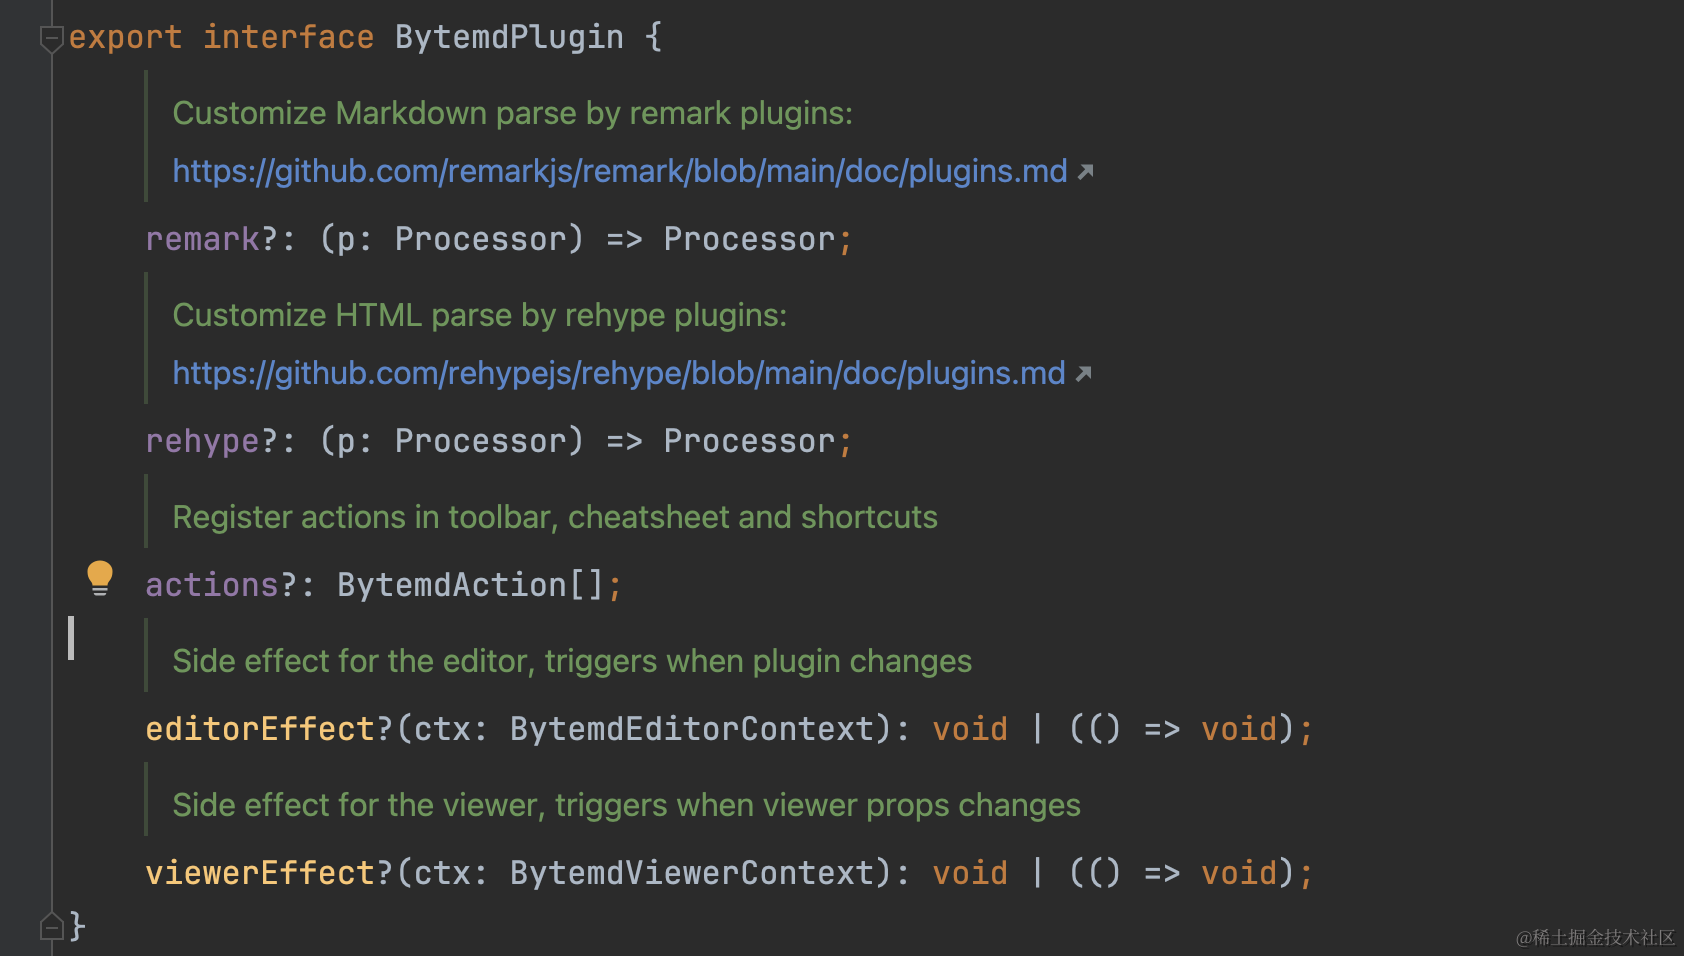
我是如何在markdown编辑器中完成视频的插入和播放的
如果你有更好用的编辑器组件,请一定推荐给我!!!(最好附带使用说明🤓️) 介绍 在开发一个社区页面的时候,需要完成发帖、浏览帖子的能力。这里考虑接入markdown编辑器进行开发,也符合大多数用户的习惯。 …...
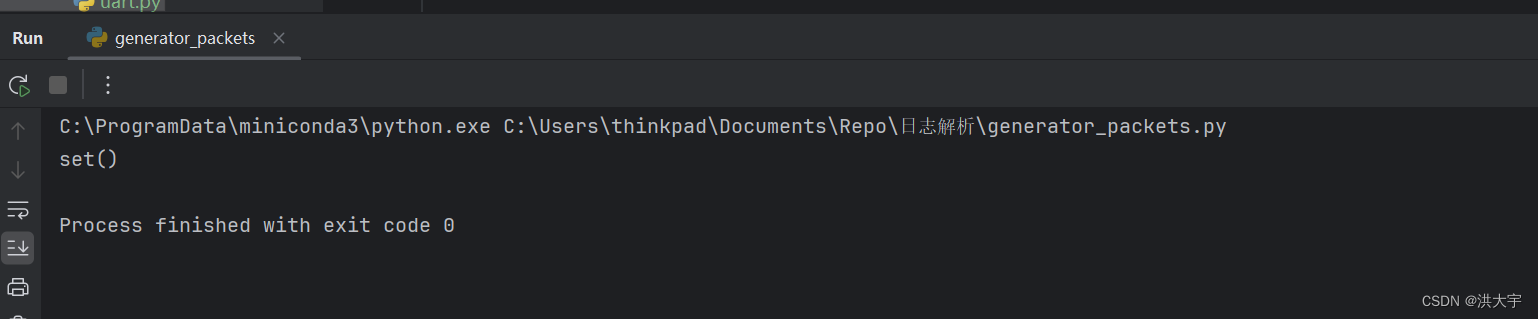
Ltv 数据粘包处理
测试数据包的生成 校验程序处理结果和原始的日志保温解析是否一致 程序粘包分解正常...
银联支付,你竟然还不知道它怎么工作?
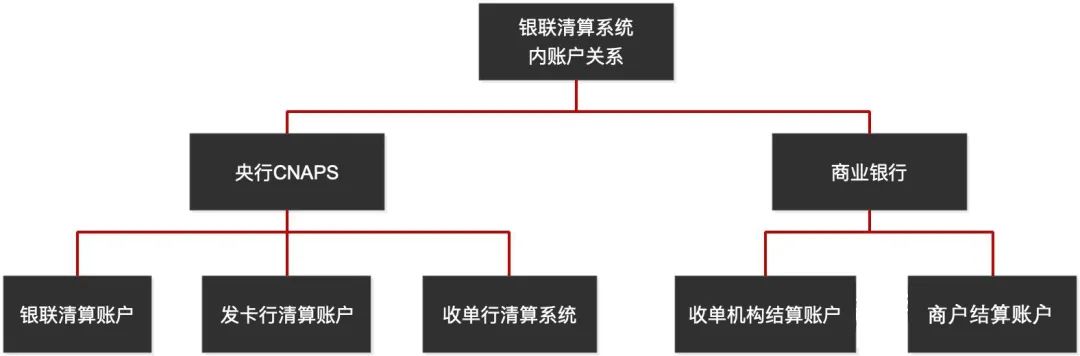
银联支付咱都用过,微信和支付宝没这么“横行”的时侯,我们取款、转账、付款时用的ATM机、POS机,都是银联支付完成的。 今天,就让咱们了解一下银行卡支付的工作原型。 首先,说说中国银联 中国银联(China U…...

查找程序中隐藏界面的思路
免责声明:内容仅供学习参考,请合法利用知识,禁止进行违法犯罪活动 某些程序,它会有管理员界面(比如棋牌游戏,它一般会有一个控制端界面,用来控制发牌、换牌),但是这种界…...

umount
umount命令用于卸载文件系统,使得挂载点的文件和目录变为不可访问。 基本用法: umount [选项] 设备或文件夹 常见选项: -f:强制卸载,即使文件系统处于忙碌状态(在某些情况下使用,如网络文件…...

electron录制应用-自由画板功能
功能 录屏过程中的涂画功能允许用户在录制屏幕操作的同时,实时添加注释和高亮显示,以增强信息的传达和观众的理解。 效果 electron录制-添加画布 代码实现 1、利用HTML5的Canvas元素实现一个自由涂画的功能,允许用户在网页上进行手绘创作。…...

版本控制工具-git分支管理
目录 前言一、git分支管理基本命令1.1 基本命令2.1 实例 二、git分支合并冲突解决三、git merge命令与git rebase命令对比 前言 本篇文章介绍git分支管理的基本命令,并说明如何解决git分支合并冲突,最后说明git merge命令与git rebase命令的区别。 一、…...
医卫医学试题及答案,分享几个实用搜题和学习工具 #学习方法#知识分享#经验分享
可以说是搜题软件里面题库较为齐全的一个了,收录国内高校常见的计算机类、资格类、学历类、外语类、工程类、建筑类等多种类型的题目。它可以拍照解题、拍照答疑、智能解题,并支持每日一练、章节练习、错题重做等特色功能,在帮助大家解答疑惑…...

在dolphinDB上直接保存一个dataframe为分布式数据表
步骤1:获取链接 import dolphindb as ddb from loguru import loggerdef get_dolphin_session():"""获取dolphinDB的session"""dolphin_config {"host": "127.0.0.1","port": 13900,"username&…...

awk
awk grep 查 sed 增删改查 awk 按行取列 awk默认分割符: 空格;tab键。多个空格压缩成一个空格 [roottest2 opt]# cat awk.txt 1 2 3 [roottest2 opt]# awk {print $3} awk.txt 3 awk的工作原理: 根据指令信息,逐行的读…...

如何加速AI原生应用进程?华为云开天aPaaS提出新范式
每一次新旧代际转换时,都会上演这样的一幕:“畅想很多,落地很少”,AI原生应用似乎也不例外。 关于AI原生应用的呼声已经持续一段时间,但普通用户对“AI原生”依然陌生。除了新业态普及的周期性,AI原生应用…...

Matlab基础语法:变量和数据类型,基本运算,矩阵和向量,常用函数,脚本文件
目录 一、变量和数据类型 二、基本运算 三、矩阵和向量 四、常用函数 五、脚本文件 六、总结 一、变量和数据类型 Matlab 支持多种数据类型,包括数值类型、字符类型和逻辑类型。掌握这些基本的变量和数据类型,是我们进行数学建模和计算的基础。 数…...
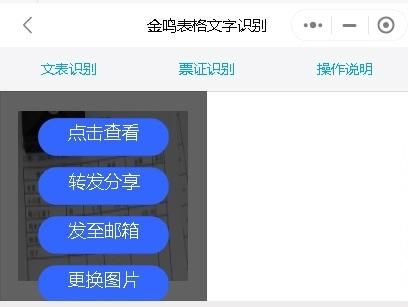
弥补iPhone不足,推荐金鸣识别等几款APP神器
在数字时代的浪潮中,iPhone以其独特的设计和强大的性能赢得了全球众多用户的喜爱。然而,即便是这样一款近乎完美的设备,也难免存在一些局限性和缺陷。幸运的是,App Store中蕴藏着许多鲜为人知的app,它们可以弥补iPhone…...

Unity安卓打包实战指南:从环境配置到APK生成全链路排错
1. 这不是“入门教程”,而是一份写给真实开发现场的生存指南你打开Unity,新建一个3D项目,拖进一个Cube,点击Play——它动了。你松了口气,觉得“Unity好像也没那么难”。但当你把APK打包发给测试同事,对方回…...

物联网与云技术赋能咖啡后处理:CeriTech 的实时监控系统实践
1. 项目概述:用物联网与云技术重塑咖啡后处理在印尼的咖啡农场里,传统的发酵与干燥过程很大程度上依赖“感觉”和“经验”。一位有经验的农人可能会用手触摸、用鼻子闻,或者根据天气和日照时间来估算发酵是否完成、干燥是否均匀。这种方法固然…...

解决Claude Code Token不足问题并享受Taotoken活动价
🚀 告别海外账号与网络限制!稳定直连全球优质大模型,限时半价接入中。 👉 点击领取海量免费额度 解决Claude Code Token不足问题并享受Taotoken活动价 应用场景类,聚焦于使用Claude Code时遇到Token配额紧张的开发者&…...

通过curl命令快速测试Taotoken大模型API的连通性与返回格式
🚀 告别海外账号与网络限制!稳定直连全球优质大模型,限时半价接入中。 👉 点击领取海量免费额度 通过curl命令快速测试Taotoken大模型API的连通性与返回格式 在集成大模型能力到应用时,开发者通常需要一种快速、轻量的…...

基于IRS2092的200W D类功放设计:从PWM原理到保护电路实战
1. 项目概述与核心思路折腾音响功放,从经典的AB类玩到D类,感觉就像是从燃油车换到了电动车,动力响应和效率完全是两个维度。这次要聊的这块“200W Class-D Audio Power Amplifier [150115]”单板功放,就是一个非常典型的D类功放设…...

HoRain云--CLAUDE.md 使用指南
🎬 HoRain云小助手:个人主页 🔥 个人专栏: 《Linux 系列教程》《c语言教程》 ⛺️生活的理想,就是为了理想的生活! ⛳️ 推荐 前些天发现了一个超棒的服务器购买网站,性价比超高,大内存超划算!…...

Git Bash 中无法启动 Claude Code ?
最近需要在 git bash 中跑 Claude Code 。git bash 是随 git for windows 套件安装的,很久没更新了,结果启动 Claude Code 报错:Warning: no stdin data received in 3s, proceeding without it. If piping from a slow command, redirect st…...
)
第 2 期:广告视觉提效:FastAPI+LangChain 对接豆包图片模型(附完整代码)
https://mp.weixin.qq.com/s/El8_eV3wYCW-OPungbt7ng...

终极指南:5分钟搞定淘宝淘金币全任务自动化脚本
终极指南:5分钟搞定淘宝淘金币全任务自动化脚本 【免费下载链接】taojinbi 淘宝淘金币自动执行脚本,包含蚂蚁森林收取能量,芭芭农场全任务,解放你的双手 项目地址: https://gitcode.com/gh_mirrors/ta/taojinbi 你是否厌倦…...

洛雪音乐桌面版:跨平台音乐聚合播放器的终极使用指南
洛雪音乐桌面版:跨平台音乐聚合播放器的终极使用指南 【免费下载链接】lx-music-desktop 一个基于 Electron 的音乐软件 项目地址: https://gitcode.com/GitHub_Trending/lx/lx-music-desktop 洛雪音乐桌面版是一款基于Electron和Vue 3技术栈开发的开源跨平台…...