【不知道是啥】浅保存哈
这里写自定义目录标题
- 欢迎使用Markdown编辑器
- 新的改变
- 功能快捷键
- 合理的创建标题,有助于目录的生成
- 如何改变文本的样式
- 插入链接与图片
- 如何插入一段漂亮的代码片
- 生成一个适合你的列表
- 创建一个表格
- 设定内容居中、居左、居右
- SmartyPants
- 创建一个自定义列表
- 如何创建一个注脚
- 注释也是必不可少的
- KaTeX数学公式
- 新的甘特图功能,丰富你的文章
- UML 图表
- FLowchart流程图
- 导出与导入
- 导出
- 导入
# -*- coding: utf-8 -*-
"""
Created on Fri Dec  2 13:46:48 2022@author: Lenovo
"""from sklearn.metrics import make_scorer
import os
import pandas as pd
import numpy as np
import seaborn as sns
from sklearn.ensemble import RandomForestRegressor
from sklearn.model_selection import GridSearchCV
from sklearn.model_selection import train_test_split
import matplotlib.pyplot as plt
from sklearn.metrics import r2_score,mean_squared_error
# from sklearn.preprocessing import StandardScaler
import seaborn as sns
from scipy.stats import gaussian_kde
from mpl_toolkits.axes_grid1 import make_axes_locatable
from sklearn.feature_selection import RFECV
from scipy.interpolate import griddata
from itertools import combinations
from operator import itemgetter
dic = {}
path=r'D:\Fluxnet\try'
outpath=r'D:\Fluxnet\OUTCOME\每种变量组合放在一起之前的仓库'site_list=[]
year_list=[]total_number=[]
post_dropna_number=[]
post_drop_le_abnormal_number=[]
test_number=[]
train_number=[]
N_estimators=[]
Max_depth=[]Rmse_list=[]
R2_list=[]
Bias_list=[]Drivers_column=[]
Filling_rate_list=[]
Feature_list=[]# path1=r'D:\Fluxnet\try'
# path2=r'D:\Fluxnet\try_ndvi'
# path1=r'D:\Fluxnet\加了土壤水和土壤温度的\MDS_用'
# path2=r'D:\Fluxnet\ndvi777 - SHAOSHAOSHAO'  # for s,j in zip(os.listdir(path1),os.listdir(path2)):
#     print(s)
#     print(os.listdir(path2))
#     sole_s=pd.read_csv(os.path.join(path1,s))
#     sole_j=pd.read_csv(os.path.join(path2,j)) #     sole_s['TIMESTAMP_START']=sole_s['TIMESTAMP_START'].astype('str')
#     sole_s['TIMESTAMP_START']=pd.to_datetime(sole_s['TIMESTAMP_START'])   #     sole_j=sole_j[['TIMESTAMP_START','NDVI']]
#     sole_j['TIMESTAMP_START'] = pd.to_datetime(sole_j['TIMESTAMP_START'])#     sole_j = sole_j.set_index('TIMESTAMP_START')
#     sole_j = sole_j.resample('1D').interpolate() # 30T 按分钟(T)插值  1D按天插值
#     sole_j = sole_j.reset_index() #     sole=pd.merge(sole_s, sole_j,how='left',on='TIMESTAMP_START') #     sole['NDVI']=sole['NDVI'].interpolate(method='pad') # 1天一个值
#     print(sole)path1 =  r'C:\Users\Lenovo\Desktop\四大类\REALTRY'
for file in os.listdir(path1):sole = pd.read_csv(os.path.join(path1,file))site_list1=[]year_list1=[]test_number1=[]train_number1=[]rmse_list1=[]r2_list1=[]bias_list1=[]sole_raw = solesole_copy = soleprint('原始数据:',sole.shape)sole.dropna(subset=['LE_F_MDS_QC'],axis=0,inplace=True) #删除LE_F_MDS_QC中含有空值的行print('去掉没QC后的原始数据:',sole.shape)trainset=sole[sole['LE_F_MDS_QC']==0]print('观测数据:',trainset.shape)# =============================================================================
#   以LE_F_MDS=20W/m²为界 白天和晚上分别训练
# =============================================================================trainset=trainset[trainset['LE_F_MDS']>=20]print('白天的总量: ',trainset.shape)gap=sole[sole['LE_F_MDS_QC']!=0]print('插补数据:',gap.shape)gap_drople=gap.drop(['LE_F_MDS','LE_F_MDS_QC','TIMESTAMP_START','TIMESTAMP_END']## , 'SW_IN_F_MDS_QC', 'NETRAD',axis=1)# gap_drople=gap_drop.drop(['SW_IN_F_MDS_QC', 'NETRAD'],axis=1)#===============================每行至少有一个/三个不是空值时保留gap_dropna=gap_drople# gap_dropna=gap_drople.dropna(axis=0,thresh=3) print('去空值后的插补数据:',gap_dropna.shape)dff=pd.DataFrame(gap_dropna.isna().sum().sort_values(ascending=False))print('预测集的空值:',dff)#看下训练集的空值,可以看出跟插补集不太一样print('训练集的空值:\n',trainset.drop(['LE_F_MDS','LE_F_MDS_QC','TIMESTAMP_START','TIMESTAMP_END']#,axis=1).isna().sum().sort_values(ascending=False))#==========================获得所有变量组合def combine(list0,o):list1=[]for i in combinations(list0,o):list1.append(i)return list1tianchongliang=[]chabuliang=[]rmseliang=[]site_list=[]ALL_rmse_list=[]rmse_number=[]pinjie_number=[]train_number=[]rmse_list=[]rmse1_list=[]all_rmse1_list=[]r2_list=[]r21_list=[]ALL_r2_list=[]all_r21_list=[]bias_list=[]bias1_list=[]ALL_bias_list=[]all_bias1_list=[]filling_rate_list=[]dic_list = []fig  = plt.figure(figsize=(4,40),dpi=600)fig1 = plt.figure(figsize=(16,36),dpi=600)ALL_x_test = pd.Series()ALL_y_test = pd.Series()qian=0hou=-1for u in reversed(range(3,len(gap_drople.columns)+1)) : fillrate_mid_list=[]col_list=[]list666=[]list666.extend(combine(dff.index,u))#===========================获取不同插补率的组合特征list_score=[]score=[]big_list=[]for i in range(0,len(list666)):sco=f'{gap_drople[list(list666[i])].dropna().shape[0] / gap_drople.shape[0]:.2f}'score+=[f'{gap_drople[list(list666[i])].dropna().shape[0] / gap_drople.shape[0]:.2f}']list_score+=[{'score':sco,'list':list666[i]}]# print(list_score)  print(list_score)#=============================plotkey_list=[a['list'] for a in list_score]len_list = [ len(i) for i in key_list ]score=[np.float64(i) for i in score]plt.rc('font', family='Times New Roman',size=20)plt.figure(figsize=(10,8),dpi=400)plt.scatter(len_list,score)plt.xlabel('Number of drivers', {'family':'Times New Roman','weight':'normal','size':20})plt.ylabel('Filling rate',{'family':'Times New Roman','weight':'normal','size':20})#============================填充率最大对应去的变量列表shunxusorted_list=sorted(list_score, key=lambda list_score: list_score['score'], reverse=True)# print(sorted_list)   # 按降序排列biggest_score=[a['score'] for a in sorted_list][0]      biggest_score_feature_list=[a['list'] for a in sorted_list][0]# print(biggest_score_feature_list)   Feature_list.append(biggest_score_feature_list)filling_rate_list.append(biggest_score)Filling_rate_list.append(biggest_score)#==============================建模准备================================train_copy=trainset.copy()train_copy.drop(['LE_F_MDS_QC','TIMESTAMP_START','TIMESTAMP_END']#,axis=1,inplace=True)#.isna().sum().sort_values(ascending=False)feature=[x for x in biggest_score_feature_list]  train_option=train_copy[feature]train_option['LE_F_MDS']=train_copy['LE_F_MDS']print("Train_option原始数值\n",train_option.shape)#print(train_option.isna().sum().sort_values(ascending=True))#============================去除空值=======================================train_option_dropna=train_option.dropna() #训练数据去空值print('训练集去掉空值后: ',train_option_dropna.shape)c=train_option_dropna    print(c.shape)Drivers=c.drop(['LE_F_MDS'],axis=1)Drivers_column+=[' '.join(Drivers.columns.tolist())]LE=c['LE_F_MDS']x_train,x_test,y_train,y_test=train_test_split(Drivers,LE,test_size=0.20,random_state=(0))                            print(x_train.shape)print(x_test.shape)print(y_train.shape)print(y_test.shape)
# =============================================================================
#      建模
# =============================================================================rf=RandomForestRegressor(n_estimators=1100,max_depth=80,oob_score=True,random_state=(0))   rf.fit(x_train,y_train)    # rf.fit(Drivers,LE)     # pred_oob = rf.oob_prediction_ #袋外预测值# print(len(pred_oob))# print(pred_oob)# rmse=np.sqrt(mean_squared_error(LE, pred_oob)) #袋外均方根误差site_list+=[file.split('_',6)[1]]tianchongliang+=[biggest_score]chabuliang+=[gap.shape[0]]rmseliang+=[len(y_test)]rmse=np.sqrt(mean_squared_error(y_test,rf.predict(x_test)))rmse_list.append(rmse)r2=r2_score(y_test,rf.predict(x_test))  r2_list.append(r2)bias=(rf.predict(x_test)-y_test).mean() # bias=(pred_oob-LE).mean()bias_list.append(bias)# rmse_df=pd.DataFrame({'site':site_list,'rmse':rmse_list#                       ,'rmse量':rmseliang,'插补量':chabuliang#                       ,'插补率':tianchongliang})# rmse_df.to_csv(os.path.join(r'D:\Fluxnet\OUTCOME\RMSE', str(file.split('_',6)[1])  +'.csv'),index = False)# =============================================================================
#       单一变量组合线性内插
# =============================================================================s_ori = pd.read_csv(os.path.join(path1,file))  s_ori.loc[:,'LE'] = y_tests_ori.loc[y_test.index,'LE_F_MDS'] = np.nans_ori['LE_F_MDS']= s_ori['LE_F_MDS'].interpolate()rmse1=np.sqrt(mean_squared_error(y_test,s_ori.loc[y_test.index,'LE_F_MDS'] ))rmse1_list.append(rmse1)r21=r2_score(y_test,s_ori.loc[y_test.index,'LE_F_MDS'])  r21_list.append(r21)bias1=(s_ori.loc[y_test.index,'LE_F_MDS']-y_test).mean()bias1_list.append(bias1)rmse_df=pd.DataFrame({'site':site_list,'RF_RMSE':rmse_list,'IP_RMSE':rmse1_list,'rmse量':rmseliang,'插补量':chabuliang,'插补率':tianchongliang,'RF_R2':r2_list,'IP_R2':r21_list,'RF_BIAS':bias_list,'IP_BIAS':bias1_list})print(rmse_df)print(tianchongliang[qian])rmse_df.to_csv(os.path.join(r'D:\Fluxnet\OUTCOME\RMSE', str(file.split('_',6)[1])  +'.csv'),index = False)# =============================================================================
#       DYNAMIC RMSE
# =============================================================================print(rmse_list[qian] , rmse_list[hou])print(tianchongliang[qian] , tianchongliang[hou])if qian==0 or rmse_list[qian] < rmse_list[hou] or tianchongliang[qian] > tianchongliang[hou]   :y_test6 = y_test[~y_test.index.isin(ALL_y_test.index)] #在y_test里不在大的合集里x_test6 = pd.Series(rf.predict(x_test),index=y_test.index)x_test6 = x_test6[y_test6.index]ALL_y_test = pd.concat([ALL_y_test, y_test6], axis=0, ignore_index=False)ALL_x_test = pd.concat([ALL_x_test, x_test6], axis=0,ignore_index=False)# print('拼接后\n',ALL_x_test)# print('拼接后\n',ALL_y_test)ALL_rmse=np.sqrt(mean_squared_error(ALL_y_test,ALL_x_test))ALL_rmse_list.append(ALL_rmse)r2=r2_score(y_test,rf.predict(x_test))  ALL_r2_list.append(r2)bias=(rf.predict(x_test)-y_test).mean() # bias=(pred_oob-LE).mean()ALL_bias_list.append(bias)#线性内插综合RMSEs_ori = pd.read_csv(os.path.join(path1,file))  s_ori.loc[:,'LE'] = ALL_y_tests_ori.loc[ALL_y_test.index,'LE_F_MDS'] = np.nans_ori['LE_F_MDS']= s_ori['LE_F_MDS'].interpolate()rmse1=np.sqrt(mean_squared_error(ALL_y_test,s_ori.loc[ALL_y_test.index,'LE_F_MDS'] ))all_rmse1_list.append(rmse1)r21=r2_score(ALL_y_test,s_ori.loc[ALL_y_test.index,'LE_F_MDS'])  all_r21_list.append(r21)bias1=(s_ori.loc[ALL_y_test.index,'LE_F_MDS'] - ALL_y_test).mean()all_bias1_list.append(bias1)pinjie_number.append(len(y_test6))rmse_number.append(len(ALL_y_test))train_number.append(int(trainset.shape[0]*0.2))ALL_rmse_df=pd.DataFrame({'RF_RMSE':ALL_rmse_list,'IP_RMSE':all_rmse1_list,'rmse_number':rmse_number,'pinjie_number':pinjie_number,'train_number':train_number,'RF_R2':ALL_r2_list,'IP_R2':all_r21_list,'RF_BIAS':ALL_bias_list,'IP_BIAS':all_bias1_list}) print(ALL_rmse_df)ALL_rmse_df.to_csv(os.path.join(r'D:\Fluxnet\OUTCOME\RMSE_ALL',str(file.split('_',6)[1])  +'.csv'),index = False)qian+=1hou+=1# ===========================高斯核密度散点图===========================# post_gs=pd.DataFrame({'predict':pred_oob,'in_situ':LE,})post_gs=pd.DataFrame({'predict':rf.predict(x_test),'in_situ':y_test,}) post_gs['index']=[i for i in range(post_gs.shape[0])]post_gs=post_gs.set_index('index')x=post_gs['in_situ']y=post_gs['predict']xy = np.vstack([x,y])#计算点密度z = gaussian_kde(xy)(xy)#高斯核密度idx = z.argsort()#根据密度对点进行排序,最密集的点在最后绘制x, y, z = x[idx], y[idx], z[idx]fw = 800ax = fig.add_subplot(len(gap_drople.columns)-1,1,u-2)scatter = ax.scatter(x,y,marker='o',c=z,s=15,label='LST',cmap='jet') # o是实心圆,c=是设置点的颜色,cmap设置色彩范围,'Spectral_r'和'Spectral'色彩映射相反divider = make_axes_locatable(ax) #画色域图# plt.scatter(x, y, c=z, s=7, cmap='jet')# plt.axis([0, fw, 0, fw])  # 设置线的范围# plt.title( file.split('_',6)[1], family = 'Times New Roman',size=21)# plt.text( 10, 700,len(feature), family = 'Times New Roman',size=21)# plt.text(10, 700, 'Driver numbers = %s' % len(feature), family = 'Times New Roman',size=21)# plt.text(10, 600, 'Size = %.f' % len(y), family = 'Times New Roman',size=18) # text的位置需要根据x,y的大小范围进行调整。# plt.text(10, 650, 'RMSE = %.3f W/m²' % rmse, family = 'Times New Roman',size=18)# plt.text(10, 700, 'R² = %.3f' % r2, family = 'Times New Roman',size=18)# plt.text(10, 750, 'BIAS = %.3f W/m²' % bias, family = 'Times New Roman',size=18)ax.set_xlabel('Station LE (W/m²)',family = 'Times New Roman',size=19)ax.set_ylabel('Estimated LE (W/m²)',family = 'Times New Roman',size=19)ax.plot([0,fw], [0,fw], 'gray', lw=2)  # 画的1:1线,线的颜色为black,线宽为0.8ax.set_xlim(0,fw)ax.set_ylim(0,fw)# ax.xaxis.set_tick_params(labelsize=19) # ax.xaxis.set_tick_params(labelsize=19) # plt.xticks(fontproperties='Times New Roman',size=19)# plt.yticks(fontproperties='Times New Roman',size=19)fig.set_tight_layout(True) #================================================================MDSMDS_GAP=s_oriif 'SW_IN' in MDS_GAP.columns.to_list() and 'TA' in  MDS_GAP.columns.to_list() and 'VPD' in  MDS_GAP.columns.to_list():MDS_GAP['Year']=MDS_GAP['TIMESTAMP_END']MDS_GAP['TIMESTAMP_END']=MDS_GAP['TIMESTAMP_END'].astype('str')MDS_GAP['TIMESTAMP_END']=pd.to_datetime(MDS_GAP['TIMESTAMP_END'])MDS_GAP['Year'] = MDS_GAP['TIMESTAMP_END'].dt.year  #Time stamp is not equidistant (half-)hours in rows: 35040, 35088, 52560, 52608, 70080, 70128, 87600, 87648MDS_GAP['DoY']=MDS_GAP['TIMESTAMP_END']MDS_GAP['TIMESTAMP_END']=MDS_GAP['TIMESTAMP_END'].astype('str')MDS_GAP['TIMESTAMP_END']=pd.to_datetime(MDS_GAP['TIMESTAMP_END'])doy=[]for k in MDS_GAP['TIMESTAMP_END']:doy += [k.strftime("%j")]MDS_GAP['DoY'] = doy  #Time stamp is not equidistant (half-)hours in rows: 35040, 35088, 52560, 52608, 70080, 70128, 87600, 87648MDS_GAP['Hour'] = MDS_GAP['TIMESTAMP_END']MDS_GAP['TIMESTAMP_END']=MDS_GAP['TIMESTAMP_END'].astype('str')MDS_GAP['TIMESTAMP_END']=pd.to_datetime(MDS_GAP['TIMESTAMP_END'])hour=[]for l in MDS_GAP['TIMESTAMP_END']:hour += [int(l.strftime('%H'))+float(l.strftime('%M'))/60]MDS_GAP['Hour'] = hour          MDS_GAP.loc[:,'LE'] = y_testprint(MDS_GAP['LE'].dropna().sum())MDS_GAP['LE'].to_csv(os.path.join(r'C:\Users\Lenovo\Desktop\R\用来rmse的原始值666', str(file.split('_',6)[1]) +  str(u)+ '.txt'),sep='	',index = False)MDS_GAP['LE_F_MDS']=s_ori['LE_F_MDS']MDS_GAP.loc[MDS_GAP['LE']>=-9999,['LE']] = -9999MDS_GAP['LE'].fillna(MDS_GAP['LE_F_MDS'],inplace=True)MDS_GAP['Rg']=MDS_GAP['SW_IN']        MDS_GAP['Tair']=MDS_GAP['TA']MDS_GAP['VPD']=MDS_GAP['VPD']# MDS_GAP['NEE']=MDS_GAP['NEE_VUT_REF']MDS_GAP=MDS_GAP[['Year','DoY','Hour','LE','Rg','Tair','VPD']]#,'Tsoil','rH',MDS_GAP.loc[MDS_GAP['Rg'] > 1200 , ['Rg']] = -9999 # Drivers control Rg <= 1200W/m² Ta <= 2.5℃W/m² VPD <= 50hPa# MDS_GAP.loc[MDS_GAP['Tair'] > 2.5 , ['Tair']] ==-9999MDS_GAP.loc[MDS_GAP['VPD'] > 50 , ['VPD']] = -9999#将单位插到第零行的位置上rrow = 0  # 插入的位置value = pd.DataFrame([['-', '-', '-','Wm-2', 'Wm-2', 'degC','hPa']],columns=MDS_GAP.columns)  # 插入的数据  'degC','%',df_tmp1 = MDS_GAP[:row]df_tmp2 = MDS_GAP[row:]# 插入合并数据表MDS_GAP = df_tmp1.append(value).append(df_tmp2)MDS_GAP = MDS_GAP.fillna(-9999) MDS_GAP.to_csv(os.path.join(r'D:\Fluxnet\OUTCOME\MDS_TRY666', str(file.split('_',6)[1]) + str(u) + '.txt'),sep='	',index = False)#+ str(gaplong)#==============================================================MDS_ALLs_ori = pd.read_csv(os.path.join(path1,file))MDS_GAP=s_oriif 'SW_IN' in MDS_GAP.columns.to_list() and 'TA' in  MDS_GAP.columns.to_list() and 'VPD' in  MDS_GAP.columns.to_list():MDS_GAP['Year']=MDS_GAP['TIMESTAMP_END']MDS_GAP['TIMESTAMP_END']=MDS_GAP['TIMESTAMP_END'].astype('str')MDS_GAP['TIMESTAMP_END']=pd.to_datetime(MDS_GAP['TIMESTAMP_END'])MDS_GAP['Year'] = MDS_GAP['TIMESTAMP_END'].dt.year  #老报错 Time stamp is not equidistant (half-)hours in rows: 35040, 35088, 52560, 52608, 70080, 70128, 87600, 87648MDS_GAP['DoY']=MDS_GAP['TIMESTAMP_END']MDS_GAP['TIMESTAMP_END']=MDS_GAP['TIMESTAMP_END'].astype('str')MDS_GAP['TIMESTAMP_END']=pd.to_datetime(MDS_GAP['TIMESTAMP_END'])doy=[]for k in MDS_GAP['TIMESTAMP_END']:doy += [k.strftime("%j")]MDS_GAP['DoY'] = doy  #老报错 Time stamp is not equidistant (half-)hours in rows: 35040, 35088, 52560, 52608, 70080, 70128, 87600, 87648MDS_GAP['Hour'] = MDS_GAP['TIMESTAMP_END']MDS_GAP['TIMESTAMP_END']=MDS_GAP['TIMESTAMP_END'].astype('str')MDS_GAP['TIMESTAMP_END']=pd.to_datetime(MDS_GAP['TIMESTAMP_END'])hour=[]for l in MDS_GAP['TIMESTAMP_END']:hour += [int(l.strftime('%H'))+float(l.strftime('%M'))/60]MDS_GAP['Hour'] = hour          MDS_GAP.loc[:,'LE'] = ALL_y_testprint(MDS_GAP['LE'].dropna().sum())MDS_GAP['LE'].to_csv(os.path.join(r'C:\Users\Lenovo\Desktop\R\用来ALL_rmse的原始值666', str(file.split('_',6)[1]) + '.txt'),sep='	',index = False)MDS_GAP['LE_F_MDS']=s_ori['LE_F_MDS']MDS_GAP.loc[MDS_GAP['LE']>=-9999,['LE']] = -9999MDS_GAP['LE'].fillna(MDS_GAP['LE_F_MDS'],inplace=True)MDS_GAP['Rg']=MDS_GAP['SW_IN']        MDS_GAP['Tair']=MDS_GAP['TA']MDS_GAP['VPD']=MDS_GAP['VPD']# MDS_GAP['NEE']=MDS_GAP['NEE_VUT_REF']MDS_GAP=MDS_GAP[['Year','DoY','Hour','LE','Rg','Tair','VPD']]#,'Tsoil','rH',MDS_GAP.loc[MDS_GAP['Rg'] > 1200 , ['Rg']] = -9999 # Drivers control Rg <= 1200W/m² Ta <= 2.5℃W/m² VPD <= 50hPa# MDS_GAP.loc[MDS_GAP['Tair'] > 2.5 , ['Tair']] ==-9999MDS_GAP.loc[MDS_GAP['VPD'] > 50 , ['VPD']] = -9999#将单位插到第零行的位置上rrow = 0  # 插入的位置value = pd.DataFrame([['-', '-', '-','Wm-2', 'Wm-2', 'degC','hPa']],columns=MDS_GAP.columns)  # 插入的数据  'degC','%',df_tmp1 = MDS_GAP[:row]df_tmp2 = MDS_GAP[row:]# 插入合并数据表MDS_GAP = df_tmp1.append(value).append(df_tmp2)MDS_GAP = MDS_GAP.fillna(-9999) MDS_GAP.to_csv(os.path.join(r'D:\Fluxnet\OUTCOME\ALL_MDS_TRY666', str(file.split('_',6)[1])  + '.txt'),sep='	',index = False)#+ str(gaplong)#==============================复制一下整个的 插补 保存 比较 导出ALL_y_testgap_dropna_copy=gap_dropna.copy()gap_dropna_copy=gap_dropna_copy[feature]gap_dropna_copy=gap_dropna_copy.dropna()gap_dropna_copy.loc[:, 'LE_gap_filled'] = rf.predict(gap_dropna_copy)le=sole.copy()le['LE_F_MDS_QC'].replace([1,2,3], np.nan, inplace=True)le['LE_F_MDS_QC'].replace(0, -9999, inplace=True)le['LE_F_MDS_QC'].fillna(gap_dropna_copy['LE_gap_filled'], inplace=True)le['RMSE']=[rmse]*sole.shape[0]dic0={'TIMESTAMP_START':le['TIMESTAMP_START'].tolist(),'TIMESTAMP_END':le['TIMESTAMP_END'].tolist() ,'LE_Gap_filled'+ str(u): le['LE_F_MDS_QC'].tolist(),'RMSE'+ str(u): le['RMSE'],'Drivers'+ str(u): [' '.join(Drivers.columns.tolist())]*sole.shape[0]}df0 = pd.DataFrame(dic0)dic={'list_name':df0, 'rmse':df0['RMSE'+ str(u)][df0.index[0]]} dic_list += [dic]sorted_dic=sorted(dic_list, key=lambda dic_list: dic_list['rmse'], reverse=False) list_name=[a['list_name'] for a in sorted_dic] # 打印出来的话就是整个dataframe countdf = pd.concat(list_name,axis=1)df = df.loc[:,~df.columns.duplicated()]shunxu = [''.join(list(filter(str.isdigit,x))) for x in df.columns]shunxu0 = list(filter(None,shunxu))shunxu = list(set(shunxu0)) #set的方法会改变顺序 按照原来的index排个序shunxu.sort(key = shunxu0.index)print(shunxu)  #=============================== 变量个数 VS.插补率# fig = plt.subplot(8,5,36+dalei)    # plt.savefig(os.path.join(r'D:\Fluxnet\PIC666\DoubleY',s.split('_',6)[1])#             , bbox_inches='tight', dpi=500)x = [x for x in reversed(range(3,len(gap_drople.columns)+1))] #reversed(range(len(df.index)+1),3)matplotlib does not support generators as inputy1 = rmse_listy2 = filling_rate_listax = fig.add_subplot(len(gap_drople.columns)-1,1,len(gap_drople.columns)-1)fig = plt.figure(figsize=(12,8),dpi=400)ax = fig.add_subplot(1,1,1)line1=ax.plot(x, y1,color='red',linestyle='--',marker='o',linewidth=2.5)ax.set_ylabel('RMSE of 25% tesing set', {'family':'Times New Roman','weight':'normal','size':21},color='red')ax.set_xlabel('Number of drivers',{'family':'Times New Roman','weight':'normal','size':21})ax.tick_params(labelsize=19)# ax1.set_title("")ax2 = ax.twinx()  # this is a important function#ax2.set_ylim([-0.05,1.05]) # 设置y轴取值范围   # ax2.set_yticks([0.0,0.3,0.5,0.7,0.9]) # 设置刻度范围 # ax2.set_yticklabels([0.0,0.3,0.5,0.7,0.9]) # 设置刻度line2=ax2.plot(x, y2,color='blue',marker='o',linewidth=2.5)ax2.tick_params(labelsize=19)ax2.set_ylabel('Filling rate', {'family':'Times New Roman','weight':'normal','size':21},color='blue')# a2.invert_yaxis() #invert_yaxis()翻转纵轴,invert_xaxis()翻转横轴# plt.tick_params(labelsize=19)# plt.xticks(np.arange(5, 13, 1),fontproperties='Times New Roman',size=19)plt.savefig(os.path.join(r'D:\Fluxnet\PIC666\1129',str(file.split('_',6)[1]) +'.png'), bbox_inches='tight', dpi=500)plt.show()# =============================================================================
#      动态插补
# =============================================================================# for latter in shunxu[1:]:#     a = df#     b=a.loc[a['LE_Gap_filled'+ str(shunxu[0])] > -9999, ['LE_Gap_filled'+ str(shunxu[0]), 'Drivers'+ str(shunxu[0]), 'RMSE'+ str(shunxu[0])]] # 只是有LE数值的地方,用来填充上边的空集#     a['Drivers'+ str(shunxu[0])]=a.loc[a['LE_Gap_filled'+ str(shunxu[0])] == np.nan, ['Drivers'+ str(shunxu[0])]]#     a['Drivers'+ str(shunxu[0])].fillna( b['Drivers'+ str(shunxu[0])] ,inplace = True ) # 自立门户 新建第一个模型的Drivers#     a['RMSE' + str(shunxu[0])]=a.loc[a['LE_Gap_filled'+str(shunxu[0])] == np.nan, ['RMSE' + str(shunxu[0])]]#     a['RMSE' + str(shunxu[0])].fillna( b['RMSE'+ str(shunxu[0])] ,inplace = True ) # 自立门户 新建第一个模型的RMSE#     b=a.loc[a['LE_Gap_filled'+ str(latter)] > -9999, ['LE_Gap_filled'+ str(latter), 'Drivers'+ str(latter), 'RMSE'+ str(latter)]] # 只是有LE数值的地方,用来填充上边的空集#     a['Drivers'+ str(latter)]=a.loc[a['LE_Gap_filled'+ str(latter)] == np.nan, ['Drivers'+ str(latter)]]#     a['Drivers'+ str(latter)].fillna( b['Drivers'+ str(latter)] ,inplace = True ) # 自立门户 新建第一个模型的Drivers#     a['RMSE' + str(latter)]=a.loc[a['LE_Gap_filled'+str(latter)] == np.nan, ['RMSE' + str(latter)]]#     a['RMSE' + str(latter)].fillna( b['RMSE'+ str(latter)] ,inplace = True ) # 自立门户 新建第一个模型的RMSE#     a['LE_Gap_filled'+str(shunxu[0])].fillna(a['LE_Gap_filled'+ str(latter)], inplace=True) # LE Update#     df2=pd.DataFrame(a.isna().sum().sort_values(ascending=False)) # 统计一下#     print(a['LE_Gap_filled'+str(shunxu[0])])#     a['Drivers'+str(shunxu[0])].fillna(a['Drivers'+ str(latter)],inplace=True)  # Drivers Update#     a['RMSE'+str(shunxu[0])].fillna(a['RMSE'+ str(latter)],inplace=True)  # Rmse Update#     # 加一下a的时间#     so=pd.read_csv(os.path.join(path1,file))#     so=so[['TIMESTAMP_START' ,'TIMESTAMP_END','LE_F_MDS']]#     print(a['TIMESTAMP_START'])#     a.to_csv(os.path.join(r'C:\Users\Lenovo\Desktop\R\用来rmse的原始值666', str(file.split('_',6)[1]) + '.csv'),index = False)# # print(a)# a['QC'] = np.nan # a.loc[a['LE_Gap_filled'+ str(shunxu[0])] != -9999, 'QC'] = 1# a.loc[a['LE_Gap_filled'+ str(shunxu[0])] == -9999 , 'QC'] = 0# a['LE_Gap_filled'+ str(shunxu[0])].replace(np.nan,-8888,inplace=True)   # 原本是空值的部分  由于变量缺失过多,压根儿补不了的部分 在原数据集中,QC为3,表示的是ERA的数据# a['LE_Gap_filled'+ str(shunxu[0])].replace(-9999,np.nan,inplace=True)   #        |          空值还有种原因是 因为变量组合的原因,没有补到那一块,所以仍旧空# a['LE_Gap_filled'+ str(shunxu[0])].fillna(so['LE_F_MDS'],inplace=True)#  最后依旧是空值     # a.loc[a['LE_Gap_filled'+ str(shunxu[0])] == -8888 , 'QC'] = -9999# a=a[[ 'TIMESTAMP_END', 'LE_Gap_filled'+ str(shunxu[0]), 'QC',  'Drivers'+ str(shunxu[0]), 'RMSE'+ str(shunxu[0])]]# a= pd.merge(so,a,how='outer',on='TIMESTAMP_END')# a['LE_Gap_filled'+ str(shunxu[0])].fillna(a['LE_F_MDS'],inplace=True)   # a['LE_Gap_filled'+ str(shunxu[0])].replace(-8888,np.nan,inplace=True)    # a=a[['TIMESTAMP_START', 'TIMESTAMP_END', 'LE_Gap_filled'+ str(shunxu[0]), 'QC',  'Drivers' + str(shunxu[0]), 'RMSE'+ str(shunxu[0])]]# bianliangmen = pd.read_csv(os.path.join(path1,file))# bianliangmen = bianliangmen.drop(['TIMESTAMP_START' ,'TIMESTAMP_END','LE_F_MDS'],axis=1).columns# for i in bianliangmen:#     a[str(i)]=np.nan# # print(a.columns)  year   # a['Drivers' + str(shunxu[0])].replace(np.nan,-9999,inplace=True)      # b=a.loc[a['Drivers' + str(shunxu[0])]!=-9999]# for i in b.columns[6:]:#     c=b[b['Drivers' + str(shunxu[0])].str.contains(i)]#     c[i].replace(np.nan,'+',inplace=True)#     a[i]=c[i]# b=a.count(axis=1)-6# b=pd.DataFrame(b)# a['n_drivers']=b# a['n_drivers'].replace([-1,-2,-3],np.nan,inplace=True)# a['Drivers' + str(shunxu[0])].replace(-9999,np.nan,inplace=True)# # print(a)# a.to_csv(os.path.join(r'D:\Fluxnet\OUTCOME\FILLED',str(file.split('_',6)[1]) +'.csv'),index = False)# # #     # total_number.append(int(sole.shape[0]))#     # post_dropna_number.append(int(train_option_dropna.shape[0]))#     # post_drop_le_abnormal_number.append(int(c.shape[0]))#     # test_number.append(int(c.shape[0]*0.25))#     # train_number.append(int(c.shape[0]*0.75))#     # # N_estimators.append(n_estimators)#     # # Max_depth.append(max_depth)# # ===========================================================绘制散点图file# s_ori = pd.read_csv(os.path.join(path1,file))# ori = s_ori.loc[s_ori['LE_F_MDS_QC']==0,['TIMESTAMP_START','LE_F_MDS']]# filled = s_ori.loc[s_ori['LE_F_MDS_QC']!=0,['TIMESTAMP_START','LE_F_MDS']]# s_ori['TIMESTAMP_START'] = pd.to_datetime(s_ori['TIMESTAMP_START'])# s_ori['year'] = s_ori['TIMESTAMP_START'].dt.year# gap_filled = a.loc[a['QC'] == 1,['TIMESTAMP_START','LE_Gap_filled'+ str(shunxu[0])]]# fig1 ,ax = plt.subplots(5,1,sharex='col',figsize=(25,9),dpi=300)# ax0 = ax[0]# ax0.plot( 'LE_F_MDS', data=ori, linestyle='none',marker='o')# ax1 = ax[1]# ax1.plot(  'LE_F_MDS', data=filled, color='#ff7f0e',linestyle='none', marker='o')# ax2 = ax[2]# ax2.plot(  'LE_F_MDS', data=ori, alpha=0.6, linestyle='none', marker='o')# ax2.plot( 'LE_F_MDS', data=filled, alpha=0.6, linestyle='none', marker='o')# ax3 = ax[3]# # ax2.plot(  'LE_F_MDS', data=s_ori, alpha=0.6, linestyle='none', marker='o')# ax3.plot('LE_Gap_filled'+ str(shunxu[0]),data=gap_filled, color='#FAA460', linestyle='none', marker='o' )# ax4 = ax[4]# ax4.plot(  'LE_F_MDS', data=ori, alpha=0.6, linestyle='none', marker='o')# ax4.plot('LE_Gap_filled'+ str(shunxu[0]),data=gap_filled,color='#FAA460', alpha=0.6, linestyle='none', marker='o' )# ax0.set_ylabel('in-situ', fontsize=19)# ax1.set_ylabel('MDS', fontsize=19)# ax2.set_ylabel('FLUXNET2015', fontsize=19)# ax3.set_ylabel('RF', fontsize=19)# ax4.set_ylabel('Dynamic', fontsize=19)# nianfen = int(file.split('_',6)[5].split('-',2)[0])# nianfen1 = int(file.split('_',6)[5].split('-',2)[1])# ax2.set_xticks([365*48*x  for x in range(nianfen1+2-nianfen)]) # ax2.set_xticklabels([x  for x in range(nianfen,nianfen1+2)],fontproperties='Times New Roman',size=19)# ax4.set_xlabel('Year', fontsize=19)# plt.savefig(os.path.join(r'D:\Fluxnet\PIC666\1128',str(file.split('_',6)[1]) +'.png')#                   , bbox_inches='tight', dpi=500)# plt.show()#===============================================导出# dic={'SITES':site_list,'YEAR':year_list,'原始数目':total_number#           ,'去掉空值后':post_dropna_number#           ,'去掉LE异常值后':post_drop_le_abnormal_number#           ,'TRAIN_NUMBER':train_number#           ,'TEST_NUMBER':test_number#           # ,'n_estimators':N_estimators,'max_depth':Max_depth#           ,'RMSE':Rmse_list,'R2':R2_list,'BIAS':Bias_list#           ,'Drivers_column':Drivers_column#           ,'Filling_rate' : Filling_rate_list#         }# dic=pd.DataFrame(dic)# # print(dic)# dic.to_csv(r'D:\Fluxnet\OUTCOME\RMSE_ALL\RMSE_All_Day.csv')# dic_sole={#           'RMSE':rmse_list,'R2':r2_list,'BIAS':bias_list#           } # dic_sole=pd.DataFrame(dic_sole)# dic_sole.to_csv(os.path.join(r'D:\Fluxnet\OUTCOME\RMSE', str(file.split('_',6)[1])  +'.csv'),index = False)#===============================================Various length of gap# for j,k in zip([0.05,0.075,0.125],[6,24,48]): #一天 七天 一月 一共占总数据的0.25# #48,336,720#   df0=sole.copy()#   print(len(df0))#   df=df0[df0['LE_F_MDS_QC']==0]#   print(df['LE_F_MDS_QC'])#   print(len(df))#   print('!!!!!!!!!!!!!!!!!!!!!!!!!!!!!!!!!!!')#   #可以开始make gap的位置区间#   start_point=np.arange(df['LE_F_MDS_QC'].index[0],df['LE_F_MDS_QC'].index[-1]-k+1) #k是gap长度 #   #gap的个数#   gap_number=int(len(df)*j/k)#   print(gap_number)#   # 随机选择开始的位置#   # np.random.seed(1) # 每次的随机数都是一样的#   gap_posi=np.random.choice(start_point,gap_number*3) #多一点选择的余地#   posi=sorted(gap_posi) # 排一下顺序}#   print(posi)#   count=0#   gap_qujian=[]#   # 并不是每个随机开始的位置都可以用,不能和以前的gap开始的位置重叠,gap的位置数据量也要充足#   for m,n in enumerate(posi): # m是索引 n是开始的位置(其实也是索引)#       # 单个gap的区间#       # 意思是从第多少位到多少位是gap区间#       gap_danqujian_list =[h for h in np.arange(n,n+k)]#       print(gap_danqujian_list)#       print('==')#       # 整个DataFrame中的gap#       gap_df = df0.iloc[gap_danqujian_list]#       # print(gap_df)#       # gap区间要在限定的范围内#       if np.isin(gap_danqujian_list,start_point).all():#           # 不同长度gap不能重叠#           if m>0 and n-posi[m-1] <= k: #               continue#           # gap区间内要有足够的原始数据#           if len(gap_df.dropna()) / len(gap_df) < 0.5:#               continue#           gap_qujian.extend(gap_danqujian_list)#           print(gap_qujian)#           count += 1#       if count == gap_number: # 每种gap的数目都要达到gap_number,达到规定的比例才会停止#           print('@@@@@@@@@@@@@@@@@@@@@')#           print(count)#           break#   # 要去掉索引对应的le为空的suoyin#   test_df=df0.iloc[gap_qujian] # pd.iloc[[1,2,3]] 查找方括号内数字所在的行#   print(test_df)#   print(len(test_df))#   test=test_df.loc[test_df['LE_F_MDS_QC']==0,].dropna(axis=0) # pd.iloc[[1,2,3]] 查找方括号内数字所在的行#   print(test)#   print(len(test))#   train_index=np.setdiff1d(df0.index,test_df.index) # setdiff1d 前面那个数组有 后边那个没有的值#   print(train_index)#   train_df=df0.iloc[train_index] # # pd.iloc[[1,2,3]] 查找方括号内数字所在的行#   train=train_df.loc[train_df['LE_F_MDS_QC']==0,].dropna(axis=0)#   print(train)#   print(len(train))#   pd.set_option('display.max_columns', None)# # print(test.head(5))#   print(train.shape)#   print(test.shape)#   a=pd.DataFrame(test.isna().sum().sort_values(ascending=False))# # des=test.describe()# # shangxu=des.loc['75%']+1.5*(des.loc['75%']-des.loc['25%'])# # xiaxu=des.loc['25%']-1.5*(des.loc['75%']-des.loc['25%'])# # test=test[(test['LE_F_MDS'] <=shangxu[3])# #           &(test['LE_F_MDS'] >=xiaxu[3])]#  # print(des)#  # des=train.describe()#  # shangxu=des.loc['75%']+1.5*(des.loc['75%']-des.loc['25%'])#  # xiaxu=des.loc['25%']-1.5*(des.loc['75%']-des.loc['25%'])#  # train=train[(train['LE_F_MDS'] <=shangxu[3])#  #             &(train['LE_F_MDS'] >=xiaxu[3])]#  # print(xiaxu)#   train=train.drop(['TIMESTAMP_START','TIMESTAMP_END','LE_F_MDS_QC'],axis=1)#   test=test.drop(['TIMESTAMP_START','TIMESTAMP_END','LE_F_MDS_QC'],axis=1)#   # train_Drivers=train.drop(['LE_F_MDS'],axis=1)#   train_Drivers=train[feature]#   print(train_Drivers.index)#   # test_Drivers=test.drop(['LE_F_MDS'],axis=1) #   test_Drivers=test[feature]#   print(test_Drivers.index)#   train_LE=train['LE_F_MDS']#   print(train_LE.index)#   test_LE=test['LE_F_MDS']#   print(test_LE.index)#   # x_train,x_test,y_train,y_test=train_test_split(Drivers,LE#   #                                                ,test_size=0.25#   #                                                ,random_state=(0))                            #   print(train_Drivers.shape)#   print(test_Drivers.shape)#   print(train_LE.shape)#   print(test_LE.shape)#   # ==============================建模====================================#   rf1=RandomForestRegressor(n_estimators=1100#                             ,max_depth=80#                             ,random_state=(0))   #   rf1.fit(train_Drivers,train_LE)    #   rmse1=np.sqrt(mean_squared_error(test_LE,rf1.predict(test_Drivers)))#   rmse_list1.append(rmse1)#   rmse_df=pd.DataFrame({'rmse':rmse_list1})#   print(rmse_df)#   r2=r2_score(test_LE,rf1.predict(test_Drivers))  #   r2_list1.append(r2)#   r2_df=pd.DataFrame({'r2':r2_list1})#   bias=(rf1.predict(test_Drivers)-test_LE).mean()#   bias_list1.append(bias)#   bias_df=pd.DataFrame({'bias':bias_list1})#   site_list1+=[s.split('_',6)[1]]#   year_list1+=[int(s.split('_',6)[5].split('-',1)[1])#               -int(s.split('_',6)[5].split('-',1)[0])+1]  #   # total_number.append(int(b.shape[0]))#   # post_dropna_number.append(int(a.shape[0]))#   # post_drop_le_abnormal_number.append(int(c.shape[0]))#   test_number1.append(int(test.shape[0]))#   train_number1.append(int(train.shape[0]))#   dic2={'SITES':site_list1,'YEAR':year_list1#         # ,'原始数目':total_number#         # ,'去掉空值后':post_dropna_number#         # ,'去掉LE异常值后':post_drop_le_abnormal_number#         ,'TRAIN_NUMBER':train_number1#         ,'TEST_NUMBER':test_number1#         # ,'n_estimators':N_estimators,'max_depth':Max_depth#         ,'RMSE':rmse_list1,'R2':r2_list1,'BIAS':bias_list1#       }#   dic2=pd.DataFrame(dic2)#   print(dic2)#   dic2.to_csv(os.path.join(r'D:\Fluxnet\OUTCOME\GAP_diff', str(s.split('_',6)[1]) + '.csv'),index = False)#========================================读一下八个csv#     dic_list=[]#     for i in range(3,5):#         df=pd.read_csv(os.path.join(outpath,str(s.split('_',6)[1]) + str(i) + '.csv'))#         dic={'list_name':df, 'rmse':df['RMSE'][0]}#         dic_list+=[dic]#         print(dic_list)
#     print('=============================================')#     # df3=pd.read_csv(os.path.join(r'D:\Fluxnet\OUTCOME',str(s.split('_',6)[1]) + '3' +'.csv'))
#     # df4=pd.read_csv(os.path.join(r'D:\Fluxnet\OUTCOME',str(s.split('_',6)[1]) + '4' +'.csv'))
#     # df5=pd.read_csv(os.path.join(r'D:\Fluxnet\OUTCOME',str(s.split('_',6)[1]) + '5' +'.csv'))
#     # df6=pd.read_csv(os.path.join(r'D:\Fluxnet\OUTCOME',str(s.split('_',6)[1]) + '6' +'.csv'))
#     # df7=pd.read_csv(os.path.join(r'D:\Fluxnet\OUTCOME',str(s.split('_',6)[1]) + '7' +'.csv'))
#     # df8=pd.read_csv(os.path.join(r'D:\Fluxnet\OUTCOME',str(s.split('_',6)[1]) + '8' +'.csv'))
#     # df9=pd.read_csv(os.path.join(r'D:\Fluxnet\OUTCOME',str(s.split('_',6)[1]) + '9' +'.csv'))
#     # df10=pd.read_csv(os.path.join(r'D:\Fluxnet\OUTCOME',str(s.split('_',6)[1]) + '10' +'.csv'))
#     # df11=pd.read_csv(os.path.join(r'D:\Fluxnet\OUTCOME',str(s.split('_',6)[1]) + '11' +'.csv'))   #     # dic=[{'list_name':df3, 'rmse':df3['RMSE'][0]}
#     #      ,{'list_name':df4, 'rmse':df4['RMSE'][0]}
#     #      ,{'list_name':df5, 'rmse':df5['RMSE'][0]}
#     #      ,{'list_name':df6, 'rmse':df6['RMSE'][0]}
#     #      ,{'list_name':df7, 'rmse':df7['RMSE'][0]}
#     #      ,{'list_name':df8, 'rmse':df8['RMSE'][0]}
#     #      ,{'list_name':df9, 'rmse':df9['RMSE'][0]}
#     #      ,{'list_name':df10, 'rmse':df10['RMSE'][0]}
#     #      ,{'list_name':df11, 'rmse':df11['RMSE'][0]}
#     #     ]#     sorted_dic=sorted(dic_list, key=lambda dic_list: dic_list['rmse'], reverse=False)
#     print(sorted_dic)
#     list_name=[a['list_name'] for a in sorted_dic] # 打印出来的话就是整个dataframe
#     print(list_name)
#     df=pd.concat(list_name,axis=1)#     print(df)
#     df.to_csv(os.path.join(outpath, str(s.split('_',6)[1]) +'6666'+'.csv'))#     a=pd.read_csv(os.path.join(outpath, str(s.split('_',6)[1]) +'6666'+'.csv'))
#     # pd.set_option('display.max_columns', None)
#     df=pd.DataFrame(a.isna().sum().sort_values(ascending=False))
#     print(a)
#     # 直接用fillna来填,可行, 但还要填drivers!!!
#     # 找rmse最低值 对应的来开始填补
#     print(df.columns)# 一# b=a.loc[a['LE_Gap_filled'] > -9999, ['LE_Gap_filled','Drivers','RMSE']]# a['Drivers']=a.loc[a['LE_Gap_filled'] == np.nan, ['Drivers']]# a['Drivers'].fillna( b['Drivers'] ,inplace = True ) # 自立门户 新建第一个模型的Drivers# print(a['Drivers'].describe())# a['RMSE']=a.loc[a['LE_Gap_filled'] == np.nan, ['RMSE']]# a['RMSE'].fillna( b['RMSE'] ,inplace = True ) # 自立门户 新建第一个模型的RMSE# print(a['RMSE'].describe())# b=a.loc[a['LE_Gap_filled.1'] > -9999, ['LE_Gap_filled.1', 'Drivers.1', 'RMSE.1']] # 只是有LE数值的地方,用来填充上边的空集# a['Drivers.1']=a.loc[a['LE_Gap_filled.1'] == np.nan, ['Drivers.1']]# a['Drivers.1'].fillna( b['Drivers.1'] ,inplace = True ) # 自立门户 新建第二个模型的Drivers# print(a['Drivers.1'].describe())# a['RMSE.1']=a.loc[a['LE_Gap_filled'] == np.nan, ['RMSE.1']]# a['RMSE.1'].fillna( b['RMSE.1'] ,inplace = True ) # 自立门户 新建第一个模型的RMSE# print(a['RMSE.1'].describe())# a['LE_Gap_filled'].fillna(a['LE_Gap_filled.1'], inplace=True) # LE Update# df1=pd.DataFrame(a.isna().sum().sort_values(ascending=False)) # 统计一下# print(df1)# a['Drivers'].fillna(a['Drivers.1'],inplace=True)  # Drivers Update# print(a['Drivers'].describe())# a['RMSE'].fillna(a['RMSE.1'],inplace=True)  # Rmse Update# print(a['RMSE'].describe())#     # 二
#     b=a.loc[a['LE_Gap_filled.2'] > -9999, ['LE_Gap_filled.2', 'Drivers.2', 'RMSE.2']] # 只是有LE数值的地方,用来填充上边的空集#     a['Drivers.2']=a.loc[a['LE_Gap_filled.2'] == np.nan, ['Drivers.2']]
#     a['Drivers.2'].fillna( b['Drivers.2'] ,inplace = True ) # 自立门户 新建第二个模型的Drivers
#     print(a['Drivers.2'].describe())#     a['RMSE.2']=a.loc[a['LE_Gap_filled'] == np.nan, ['RMSE.2']]
#     a['RMSE.2'].fillna( b['RMSE.2'] ,inplace = True ) # 自立门户 新建第一个模型的RMSE
#     print(a['RMSE.2'].describe())#     a['LE_Gap_filled'].fillna(a['LE_Gap_filled.2'], inplace=True) # LE Update
#     df2=pd.DataFrame(a.isna().sum().sort_values(ascending=False)) # 统计一下
#     print(df2)#     a['Drivers'].fillna(a['Drivers.2'],inplace=True)  # Drivers Update
#     print(a['Drivers'].describe())#     a['RMSE'].fillna(a['RMSE.2'],inplace=True)  # Rmse Update
#     print(a['RMSE'].describe())#     # 三
#     b=a.loc[a['LE_Gap_filled.3'] > -9999, ['LE_Gap_filled.3', 'Drivers.3', 'RMSE.3']] # 只是有LE数值的地方,用来填充上边的空集#     a['Drivers.3']=a.loc[a['LE_Gap_filled.3'] == np.nan, ['Drivers.3']]
#     a['Drivers.3'].fillna( b['Drivers.3'] ,inplace = True ) # 自立门户 新建第二个模型的Drivers
#     print(a['Drivers.3'].describe())#     a['RMSE.3']=a.loc[a['LE_Gap_filled'] == np.nan, ['RMSE.3']]
#     a['RMSE.3'].fillna( b['RMSE.3'] ,inplace = True ) # 自立门户 新建第一个模型的RMSE
#     print(a['RMSE.3'].describe())#     a['LE_Gap_filled'].fillna(a['LE_Gap_filled.3'], inplace=True) # LE Update
#     df3=pd.DataFrame(a.isna().sum().sort_values(ascending=False)) # 统计一下
#     print(df3)#     a['Drivers'].fillna(a['Drivers.3'],inplace=True)  # Drivers Update
#     print(a['Drivers'].describe())#     a['RMSE'].fillna(a['RMSE.3'],inplace=True)  # Rmse Update
#     print(a['RMSE'].describe())#     # 四
#     b=a.loc[a['LE_Gap_filled.4'] > -9999, ['LE_Gap_filled.4', 'Drivers.4', 'RMSE.4']] # 只是有LE数值的地方,用来填充上边的空集#     a['Drivers.4']=a.loc[a['LE_Gap_filled.4'] == np.nan, ['Drivers.4']]
#     a['Drivers.4'].fillna( b['Drivers.4'] ,inplace = True ) # 自立门户 新建第二个模型的Drivers
#     print(a['Drivers.4'].describe())#     a['RMSE.4']=a.loc[a['LE_Gap_filled'] == np.nan, ['RMSE.4']]
#     a['RMSE.4'].fillna( b['RMSE.4'] ,inplace = True ) # 自立门户 新建第一个模型的RMSE
#     print(a['RMSE.4'].describe())#     a['LE_Gap_filled'].fillna(a['LE_Gap_filled.4'], inplace=True) # LE Update
#     df4=pd.DataFrame(a.isna().sum().sort_values(ascending=False)) # 统计一下
#     print(df4)#     a['Drivers'].fillna(a['Drivers.4'],inplace=True)  # Drivers Update
#     print(a['Drivers'].describe())#     a['RMSE'].fillna(a['RMSE.4'],inplace=True)  # Rmse Update
#     print(a['RMSE'].describe())#     # 五
#     b=a.loc[a['LE_Gap_filled.5'] > -9999, ['LE_Gap_filled.5', 'Drivers.5', 'RMSE.5']] # 只是有LE数值的地方,用来填充上边的空集#     a['Drivers.5']=a.loc[a['LE_Gap_filled.5'] == np.nan, ['Drivers.5']]
#     a['Drivers.5'].fillna( b['Drivers.5'] ,inplace = True ) # 自立门户 新建第二个模型的Drivers
#     print(a['Drivers.5'].describe())#     a['RMSE.5']=a.loc[a['LE_Gap_filled'] == np.nan, ['RMSE.5']]
#     a['RMSE.5'].fillna( b['RMSE.5'] ,inplace = True ) # 自立门户 新建第一个模型的RMSE
#     print(a['RMSE.5'].describe())#     a['LE_Gap_filled'].fillna(a['LE_Gap_filled.5'], inplace=True) # LE Update
#     df5=pd.DataFrame(a.isna().sum().sort_values(ascending=False)) # 统计一下
#     print(df5)#     a['Drivers'].fillna(a['Drivers.5'],inplace=True)  # Drivers Update
#     print(a['Drivers'].describe())#     a['RMSE'].fillna(a['RMSE.5'],inplace=True)  # Rmse Update
#     print(a['RMSE'].describe())#     # 六
#     b=a.loc[a['LE_Gap_filled.6'] > -9999, ['LE_Gap_filled.6', 'Drivers.6', 'RMSE.6']] # 只是有LE数值的地方,用来填充上边的空集#     a['Drivers.6']=a.loc[a['LE_Gap_filled.6'] == np.nan, ['Drivers.6']]
#     a['Drivers.6'].fillna( b['Drivers.6'] ,inplace = True ) # 自立门户 新建第二个模型的Drivers
#     print(a['Drivers.6'].describe())#     a['RMSE.6']=a.loc[a['LE_Gap_filled'] == np.nan, ['RMSE.6']]
#     a['RMSE.6'].fillna( b['RMSE.6'] ,inplace = True ) # 自立门户 新建第一个模型的RMSE
#     print(a['RMSE.5'].describe())#     a['LE_Gap_filled'].fillna(a['LE_Gap_filled.6'], inplace=True) # LE Update
#     df6=pd.DataFrame(a.isna().sum().sort_values(ascending=False)) # 统计一下
#     print(df6)#     a['Drivers'].fillna(a['Drivers.6'],inplace=True)  # Drivers Update
#     print(a['Drivers'].describe())#     a['RMSE'].fillna(a['RMSE.6'],inplace=True)  # Rmse Update
#     print(a['RMSE'].describe())#     # 七
#     b=a.loc[a['LE_Gap_filled.7'] > -9999, ['LE_Gap_filled.7', 'Drivers.7', 'RMSE.7']] # 只是有LE数值的地方,用来填充上边的空集#     a['Drivers.7']=a.loc[a['LE_Gap_filled.7'] == np.nan, ['Drivers.7']]
#     a['Drivers.7'].fillna( b['Drivers.7'] ,inplace = True ) # 自立门户 新建第二个模型的Drivers
#     print(a['Drivers.7'].describe())#     a['RMSE.7']=a.loc[a['LE_Gap_filled'] == np.nan, ['RMSE.7']]
#     a['RMSE.7'].fillna( b['RMSE.7'] ,inplace = True ) # 自立门户 新建第一个模型的RMSE
#     print(a['RMSE.7'].describe())#     a['LE_Gap_filled'].fillna(a['LE_Gap_filled.7'], inplace=True) # LE Update
#     df7=pd.DataFrame(a.isna().sum().sort_values(ascending=False)) # 统计一下
#     print(df7)#     a['Drivers'].fillna(a['Drivers.7'],inplace=True)  # Drivers Update
#     print(a['Drivers'].describe())#     a['RMSE'].fillna(a['RMSE.7'],inplace=True)  # Rmse Update
#     print(a['RMSE'].describe())#     # 八
#     b=a.loc[a['LE_Gap_filled.8'] > -9999, ['LE_Gap_filled.8', 'Drivers.8', 'RMSE.8']] # 只是有LE数值的地方,用来填充上边的空集#     a['Drivers.8']=a.loc[a['LE_Gap_filled.8'] == np.nan, ['Drivers.8']]
#     a['Drivers.8'].fillna( b['Drivers.8'] ,inplace = True ) # 自立门户 新建第二个模型的Drivers
#     print(a['Drivers.8'].describe())#     a['RMSE.8']=a.loc[a['LE_Gap_filled'] == np.nan, ['RMSE.8']]
#     a['RMSE.8'].fillna( b['RMSE.8'] ,inplace = True ) # 自立门户 新建第一个模型的RMSE
#     print(a['RMSE.8'].describe())#     a['LE_Gap_filled'].fillna(a['LE_Gap_filled.8'], inplace=True) # LE Update
#     df8=pd.DataFrame(a.isna().sum().sort_values(ascending=False)) # 统计一下
#     print(df8)#     a['Drivers'].fillna(a['Drivers.8'],inplace=True)  # Drivers Update
#     print(a['Drivers'].describe())#     a['RMSE'].fillna(a['RMSE.8'],inplace=True)  # Rmse Update
#     print(a['RMSE'].describe())#     # 九
#     b=a.loc[a['LE_Gap_filled.9'] > -9999, ['LE_Gap_filled.9', 'Drivers.9', 'RMSE.9']] # 只是有LE数值的地方,用来填充上边的空集#     a['Drivers.9']=a.loc[a['LE_Gap_filled.9'] == np.nan, ['Drivers.9']]
#     a['Drivers.9'].fillna( b['Drivers.9'] ,inplace = True ) # 自立门户 新建第二个模型的Drivers
#     print(a['Drivers.9'].describe())#     a['RMSE.9']=a.loc[a['LE_Gap_filled'] == np.nan, ['RMSE.9']]
#     a['RMSE.9'].fillna( b['RMSE.9'] ,inplace = True ) # 自立门户 新建第一个模型的RMSE
#     print(a['RMSE.9'].describe())#     a['LE_Gap_filled'].fillna(a['LE_Gap_filled.9'], inplace=True) # LE Update
#     df8=pd.DataFrame(a.isna().sum().sort_values(ascending=False)) # 统计一下
#     print(df8)#     a['Drivers'].fillna(a['Drivers.9'],inplace=True)  # Drivers Update
#     print(a['Drivers'].describe())#     a['RMSE'].fillna(a['RMSE.9'],inplace=True)  # Rmse Update
#     print(a['RMSE'].describe())#     # 加一下a的时间#     so=pd.read_csv(os.path.join(path1,s))
#     so=so[['TIMESTAMP_START' ,'TIMESTAMP_END','LE_F_MDS']]#     print(a['TIMESTAMP_START'])#     print(a.shape)#     a['QC'] = np.nan
#     a.loc[a['LE_Gap_filled'] > -9999, 'QC'] = 1
#     a.loc[a['LE_Gap_filled'] == -9999 , 'QC'] = 0#     a['LE_Gap_filled'].replace(np.nan,-8888,inplace=True) # 原本是空值的部分  由于变量缺失过多,压根儿补不了的部分 在原数据集中,QC为3,表示的是ERA的数据
#     a['LE_Gap_filled'].replace(-9999,np.nan,inplace=True) #       |          空值还有种原因是 因为变量组合的原因,没有补到那一块,所以仍旧空
#     a['LE_Gap_filled'].fillna(sole['LE_F_MDS'],inplace=True)#  最后依旧是空值     #     a.loc[a['LE_Gap_filled'] == -8888 , 'QC'] = -9999#     print(a.dropna().shape[0]/a.shape[0])#     a=a[[ 'TIMESTAMP_END', 'LE_Gap_filled', 'QC',  'Drivers', 'RMSE']]#     a= pd.merge(so,a,how='outer',on='TIMESTAMP_END')#     a['LE_Gap_filled'].fillna(a['LE_F_MDS'],inplace=True)
#     a['LE_Gap_filled'].replace(-8888,np.nan,inplace=True)    #     a=a[['TIMESTAMP_START', 'TIMESTAMP_END', 'LE_Gap_filled', 'QC',  'Drivers', 'RMSE']]#     a['SW_IN_F_MDS']=np.nan
#     a['NETRAD']=np.nan
#     a['G_F_MDS']=np.nan
#     a['TA_F_MDS']=np.nan
#     a['RH']=np.nan
#     a['WD']=np.nan
#     a['WS']=np.nan #     a['PA_F']=np.nan
#     a['VPD_F_MDS']=np.nan
#     a['NDVI']=np.nan
#     a['TS_F_MDS_1']=np.nan
#     a['SWC_F_MDS_1']=np.nan
#     a['TA_F_MDS']=np.nan#     a['Drivers'].replace(np.nan,-9999,inplace=True)#     b=a.loc[a['Drivers']!=-9999]
#     # print(b)#     for i in b.columns[6:]:#         # print(i)#         c=b[b['Drivers'].str.contains(i)]#         c[i].replace(np.nan,'+',inplace=True)#         a[i]=c[i]#     b=a.count(axis=1)-6
#     b=pd.DataFrame(b)#     a['n_drivers']=b#     a['n_drivers'].replace([-1,-2,-3],np.nan,inplace=True)#     a['Drivers'].replace(-9999,np.nan,inplace=True)#     # a.to_csv(os.path.join(path,sole+'.csv'),index = False)#     a.to_csv(os.path.join(r'D:\Fluxnet\OUTCOME\FILLED',str(s.split('_',6)[1]) +'.csv'),index = False)# #  创造空列
# # df["Empty_1"] = ""
# # df["Empty_2"] = np.nan
# # df['Empty_3'] = pd.Series()
在这里插入代码片
欢迎使用Markdown编辑器
你好! 这是你第一次使用 Markdown编辑器 所展示的欢迎页。如果你想学习如何使用Markdown编辑器, 可以仔细阅读这篇文章,了解一下Markdown的基本语法知识。
新的改变
我们对Markdown编辑器进行了一些功能拓展与语法支持,除了标准的Markdown编辑器功能,我们增加了如下几点新功能,帮助你用它写博客:
- 全新的界面设计 ,将会带来全新的写作体验;
- 在创作中心设置你喜爱的代码高亮样式,Markdown 将代码片显示选择的高亮样式 进行展示;
- 增加了 图片拖拽 功能,你可以将本地的图片直接拖拽到编辑区域直接展示;
- 全新的 KaTeX数学公式 语法;
- 增加了支持甘特图的mermaid语法1 功能;
- 增加了 多屏幕编辑 Markdown文章功能;
- 增加了 焦点写作模式、预览模式、简洁写作模式、左右区域同步滚轮设置 等功能,功能按钮位于编辑区域与预览区域中间;
- 增加了 检查列表 功能。
功能快捷键
撤销:Ctrl/Command + Z
重做:Ctrl/Command + Y
加粗:Ctrl/Command + B
斜体:Ctrl/Command + I
标题:Ctrl/Command + Shift + H
无序列表:Ctrl/Command + Shift + U
有序列表:Ctrl/Command + Shift + O
检查列表:Ctrl/Command + Shift + C
插入代码:Ctrl/Command + Shift + K
插入链接:Ctrl/Command + Shift + L
插入图片:Ctrl/Command + Shift + G
查找:Ctrl/Command + F
替换:Ctrl/Command + G
合理的创建标题,有助于目录的生成
直接输入1次#,并按下space后,将生成1级标题。
输入2次#,并按下space后,将生成2级标题。
以此类推,我们支持6级标题。有助于使用TOC语法后生成一个完美的目录。
如何改变文本的样式
强调文本 强调文本
加粗文本 加粗文本
标记文本
删除文本
引用文本
H2O is是液体。
210 运算结果是 1024.
插入链接与图片
链接: link.
图片:
带尺寸的图片:
居中的图片:
居中并且带尺寸的图片:
当然,我们为了让用户更加便捷,我们增加了图片拖拽功能。
如何插入一段漂亮的代码片
去博客设置页面,选择一款你喜欢的代码片高亮样式,下面展示同样高亮的 代码片.
// An highlighted block
var foo = 'bar';
生成一个适合你的列表
- 项目
- 项目
- 项目
- 项目
- 项目1
- 项目2
- 项目3
- 计划任务
- 完成任务
创建一个表格
一个简单的表格是这么创建的:
| 项目 | Value |
|---|---|
| 电脑 | $1600 |
| 手机 | $12 |
| 导管 | $1 |
设定内容居中、居左、居右
使用:---------:居中
使用:----------居左
使用----------:居右
| 第一列 | 第二列 | 第三列 |
|---|---|---|
| 第一列文本居中 | 第二列文本居右 | 第三列文本居左 |
SmartyPants
SmartyPants将ASCII标点字符转换为“智能”印刷标点HTML实体。例如:
| TYPE | ASCII | HTML |
|---|---|---|
| Single backticks | 'Isn't this fun?' | ‘Isn’t this fun?’ |
| Quotes | "Isn't this fun?" | “Isn’t this fun?” |
| Dashes | -- is en-dash, --- is em-dash | – is en-dash, — is em-dash |
创建一个自定义列表
- Markdown
- Text-to-HTML conversion tool Authors
- John
- Luke
如何创建一个注脚
一个具有注脚的文本。2
注释也是必不可少的
Markdown将文本转换为 HTML。
KaTeX数学公式
您可以使用渲染LaTeX数学表达式 KaTeX:
Gamma公式展示 Γ(n)=(n−1)!∀n∈N\Gamma(n) = (n-1)!\quad\forall n\in\mathbb NΓ(n)=(n−1)!∀n∈N 是通过欧拉积分
Γ(z)=∫0∞tz−1e−tdt.\Gamma(z) = \int_0^\infty t^{z-1}e^{-t}dt\,. Γ(z)=∫0∞tz−1e−tdt.
你可以找到更多关于的信息 LaTeX 数学表达式here.
新的甘特图功能,丰富你的文章
- 关于 甘特图 语法,参考 这儿,
UML 图表
可以使用UML图表进行渲染。 Mermaid. 例如下面产生的一个序列图:
这将产生一个流程图。:
- 关于 Mermaid 语法,参考 这儿,
FLowchart流程图
我们依旧会支持flowchart的流程图:
- 关于 Flowchart流程图 语法,参考 这儿.
导出与导入
导出
如果你想尝试使用此编辑器, 你可以在此篇文章任意编辑。当你完成了一篇文章的写作, 在上方工具栏找到 文章导出 ,生成一个.md文件或者.html文件进行本地保存。
导入
如果你想加载一篇你写过的.md文件,在上方工具栏可以选择导入功能进行对应扩展名的文件导入,
继续你的创作。
mermaid语法说明 ↩︎
注脚的解释 ↩︎
相关文章:
【不知道是啥】浅保存哈
这里写自定义目录标题欢迎使用Markdown编辑器新的改变功能快捷键合理的创建标题,有助于目录的生成如何改变文本的样式插入链接与图片如何插入一段漂亮的代码片生成一个适合你的列表创建一个表格设定内容居中、居左、居右SmartyPants创建一个自定义列表如何创建一个注…...

2021 WAIC 世界人工智能大会参会总结
前言 2021 年世界人工智能大会(WAIC)于2021年7月7日至10日在上海世博展览馆举办,本届大会继续秉持「智联世界」的理念,以「众智成城」为主题,促进全球人工智能创新思想、技术、应用、人才和资本的集聚和交流ÿ…...
ThingsBoard-实现定时任务调度器批量RPC
1、概述 ThingsBoard-CE版是不支持调度器的,只有PE版才支持,但是系统中很多时候需要使用调度器来实现功能,例如:定时给设备下发rpc查询数据,我们如何来实现呢?下面我将教你使用巧妙的方法来实现。 2、使用什么实现 我们可以使用规则链提供的一个节点来实现,这个节点可…...

MySQL数据库调优————数据库调优维度及测试数据准备
MySQL性能优化金字塔法则 不合理的需求,会造成很多问题。(比如未分页,数据需要多表联查等)做架构设计的时候,应充分考虑业务的实际情况,考虑好数据库的各种选择(比如是否要读写分离,…...

电子货架标签多种固定方式
2.1寸和2.9寸电子价格标签多种固定方式: 1、桌面支架,放置在桌面或是货架上,用于桌面产品的价格或是信息显示 2、粘贴架,方便用于墙面桌面等应用 3、半透明支架,用于货架上的商品吊挂显示价格信息 4、轨道架ÿ…...
基于JavaEE的智能化跨境电子商务平台的设计
技术:Java、JSP、框架等摘要:伴随着近年来互联网的迅猛发展,网上零售逐渐成为了一种影响广泛、方便快捷的购物渠道。我国网上零售业发展的步伐很快。在如今经济全球化的影响下,消费者的网购行为趋于开放化、多元化,对于…...
C语言学习笔记(二): 简单的C程序设计
数据的表现形式 常量 在C语言中常量有以下几种: 整型常量: 0,-1,100实型常量: 小数形式(12.12);指数形式(12.1e312.110312.1\times 10^312.1103)字符常量: 普通字符(’a’,’Z’,’#’);转义字符(’\n’…...

十、STM32端口复用重映射
目录 1.什么是端口复用? 2.如何配置端口复用? 3.什么是端口重映射 ? 4.什么是部分重映射和完全重映射? 5.重映射的配置过程 1.什么是端口复用? STM32有很多外设,外设的外部引脚与GPIO复用。也就是说一…...
【C++1】函数重载,类和对象,引用,string类,vector容器,类继承和多态,/socket,进程信号
文章目录1.函数重载:writetofile(),Ctrue和false,C0和非02.类和对象:vprintf2.1 构造函数:对成员变量初始化2.2 析构函数:一个类只有一个,不允许被重载3.引用:C中&取地址&#x…...
Spring基础知识
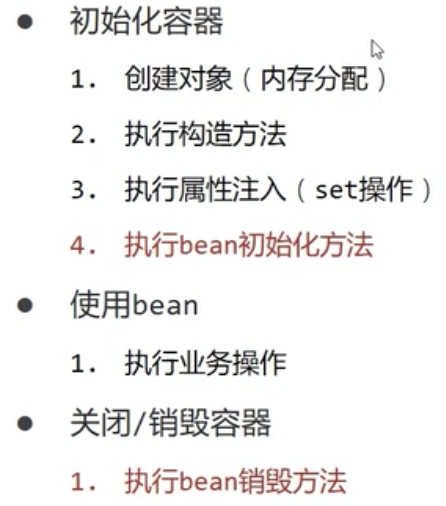
1 简介官网:https://spring.io/projects,Spring发展到今天已经形成了一种开发生态圈,Spring提供了若干个项目,每个项目用于完成特定的功能。Spring Framework是最底层的框架,是其他项目的根基。Spring Boot Spring MVC…...

proxy代理与reflect反射
proxy代理与reflect 在这之前插入一个知识点arguments,每个函数里面都有一个arguments,执行时候不传默认是所有参数,如果传了就是按顺序匹配,箭头函数没有 代理函数 代理对象也就是生成一个替身,然后这个替身处理一切的…...

机器视觉 多模态学习11篇经典论文代码以及解读
此处整理了深度学习-机器视觉,最新的发展方向-多模态学习,中的11篇经典论文,整理了相关解读博客和对应的Github代码,看完此系列论文和博客,相信你能快速切入这个方向。每篇论文、博客或代码都有…...
Redis过期删除策略
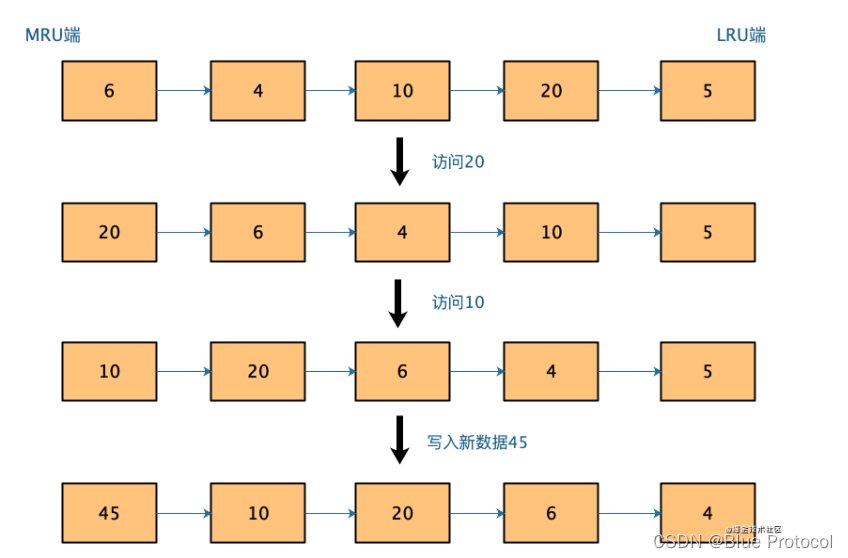
目录引出Redis过期删除策略Redis的两种过期策略:定期删除 惰性删除定期删除惰性删除Redis两种过期删除策略存在的问题Redis缓存淘汰策略Redis中的LRU和LFU算法1、LRU(Least Recently Userd最近最少使用)LFU 算法的引入2、LFU(lea…...

数据流分析之def-use链分析
数据流分析之def-use链分析引言1 相关概念2 算法2.1 算法规则2.2 算法流程2.3 算法优化3 举例引言 编译过程中,知道函数中每个指令引用的变量(或虚拟寄存器)来自于前面的哪一次赋值是很有必要的。例如llvm中对store/load转phi优化,就需要准确知道该信息…...
)
【0175】【内存上下文】如何利用context_freelists[]来彻底释放MemoryContext中分配的所有内存(8 - 2)
文章目录 1. MemoryContext 删除的另一种形式1.1 context_freelists[] 数组1.1.1 context_freelists[0] 和 context_freelists[1] 的意义1.1.2 context_freelists[0] 和 context_freelists[1] 各自功能示意图1.2 context_freelists[] 各成员在删除context时的初始化情况1.2.1 c…...

Redis实战—黑马点评(一) 登录篇
Redis实战 — 黑马点评(一) 登录篇 来自黑马的redis课程的笔记 【黑马程序员Redis入门到实战教程,深度透析redis底层原理redis分布式锁企业解决方案黑马点评实战项目】 目录Redis实战 — 黑马点评(一) 登录篇1. 项目…...

建造者模式-搭建Qt窗口案例
文章目录logging日志输出子线程设计模式可视化插件类界面设计呼吸灯实现综合案例实现本综合案例,应用到如下的知识点。logging日志输出 自定义日志记录器,实现将日志输出到指定的控件中。 # 自定义日志记录器类子线程 threading实现子线程及Qt中的子线…...

*from . import _imaging as core : ImportError: DLL load failed: 找不到指定的模块
错误提示如上。为了解决这个问题,首先参考了解决 from . import _imag…模块。. 首先尝试了彻底卸载pillow:conda uninstall pillow ; pip uninstall pillow 然后重装 pip install pillow,发现问题仍然没有解决。 并且尝试了windo…...

关于尚硅谷Hadoop-报错解决方案日志
以后都会将学习Hadoop中遇到的问题写到这里,供自己参考,能帮到大家更好SecondaryNameNode未启动解决办法:可能是端口被占用(我没遇到)hadoop104未在/etc/hosts配置映射路径我在hadoop104的/etc/hosts 添加了所有hadoop…...
)
前端高频面试题-HTML和CSS篇(二)
💻 前端高频面试题-HTML和CSS篇(二) 🏠专栏:前端面试题 👀个人主页:繁星学编程🍁 🧑个人简介:一个不断提高自我的平凡人🚀 🔊分享方向…...

synchronized 学习
学习源: https://www.bilibili.com/video/BV1aJ411V763?spm_id_from333.788.videopod.episodes&vd_source32e1c41a9370911ab06d12fbc36c4ebc 1.应用场景 不超卖,也要考虑性能问题(场景) 2.常见面试问题: sync出…...

盘古信息PCB行业解决方案:以全域场景重构,激活智造新未来
一、破局:PCB行业的时代之问 在数字经济蓬勃发展的浪潮中,PCB(印制电路板)作为 “电子产品之母”,其重要性愈发凸显。随着 5G、人工智能等新兴技术的加速渗透,PCB行业面临着前所未有的挑战与机遇。产品迭代…...

大数据零基础学习day1之环境准备和大数据初步理解
学习大数据会使用到多台Linux服务器。 一、环境准备 1、VMware 基于VMware构建Linux虚拟机 是大数据从业者或者IT从业者的必备技能之一也是成本低廉的方案 所以VMware虚拟机方案是必须要学习的。 (1)设置网关 打开VMware虚拟机,点击编辑…...

学校招生小程序源码介绍
基于ThinkPHPFastAdminUniApp开发的学校招生小程序源码,专为学校招生场景量身打造,功能实用且操作便捷。 从技术架构来看,ThinkPHP提供稳定可靠的后台服务,FastAdmin加速开发流程,UniApp则保障小程序在多端有良好的兼…...

QT: `long long` 类型转换为 `QString` 2025.6.5
在 Qt 中,将 long long 类型转换为 QString 可以通过以下两种常用方法实现: 方法 1:使用 QString::number() 直接调用 QString 的静态方法 number(),将数值转换为字符串: long long value 1234567890123456789LL; …...
RNN避坑指南:从数学推导到LSTM/GRU工业级部署实战流程
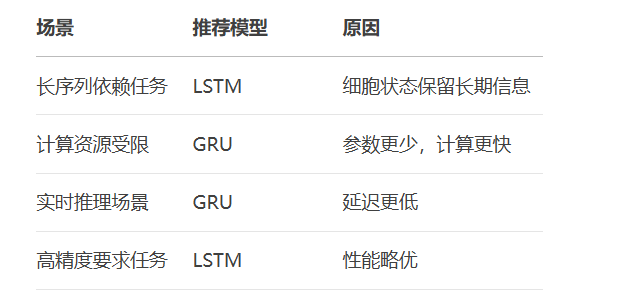
本文较长,建议点赞收藏,以免遗失。更多AI大模型应用开发学习视频及资料,尽在聚客AI学院。 本文全面剖析RNN核心原理,深入讲解梯度消失/爆炸问题,并通过LSTM/GRU结构实现解决方案,提供时间序列预测和文本生成…...
力扣热题100 k个一组反转链表题解
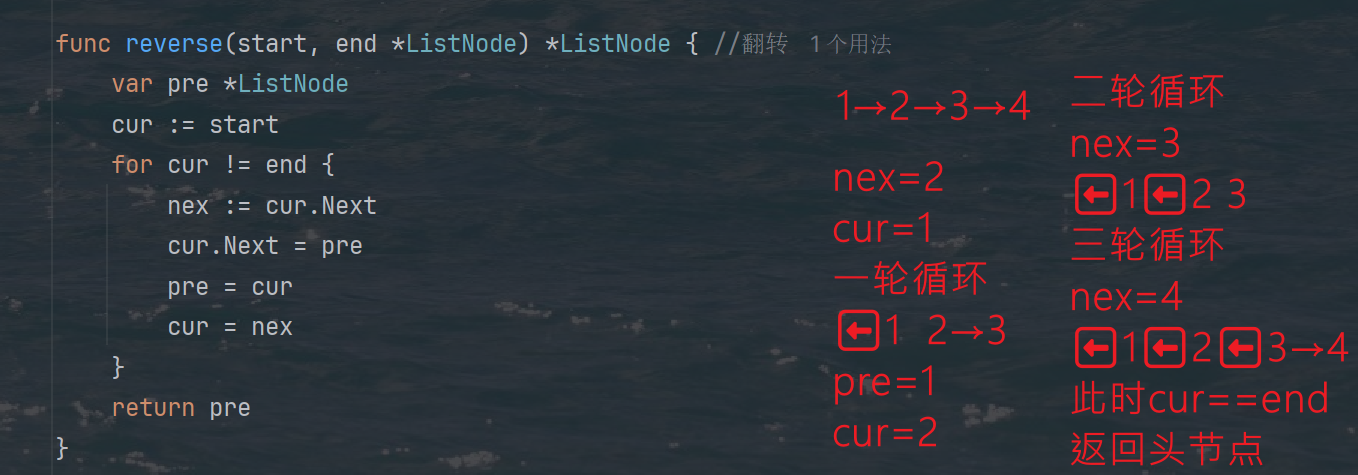
题目: 代码: func reverseKGroup(head *ListNode, k int) *ListNode {cur : headfor i : 0; i < k; i {if cur nil {return head}cur cur.Next}newHead : reverse(head, cur)head.Next reverseKGroup(cur, k)return newHead }func reverse(start, end *ListNode) *ListN…...
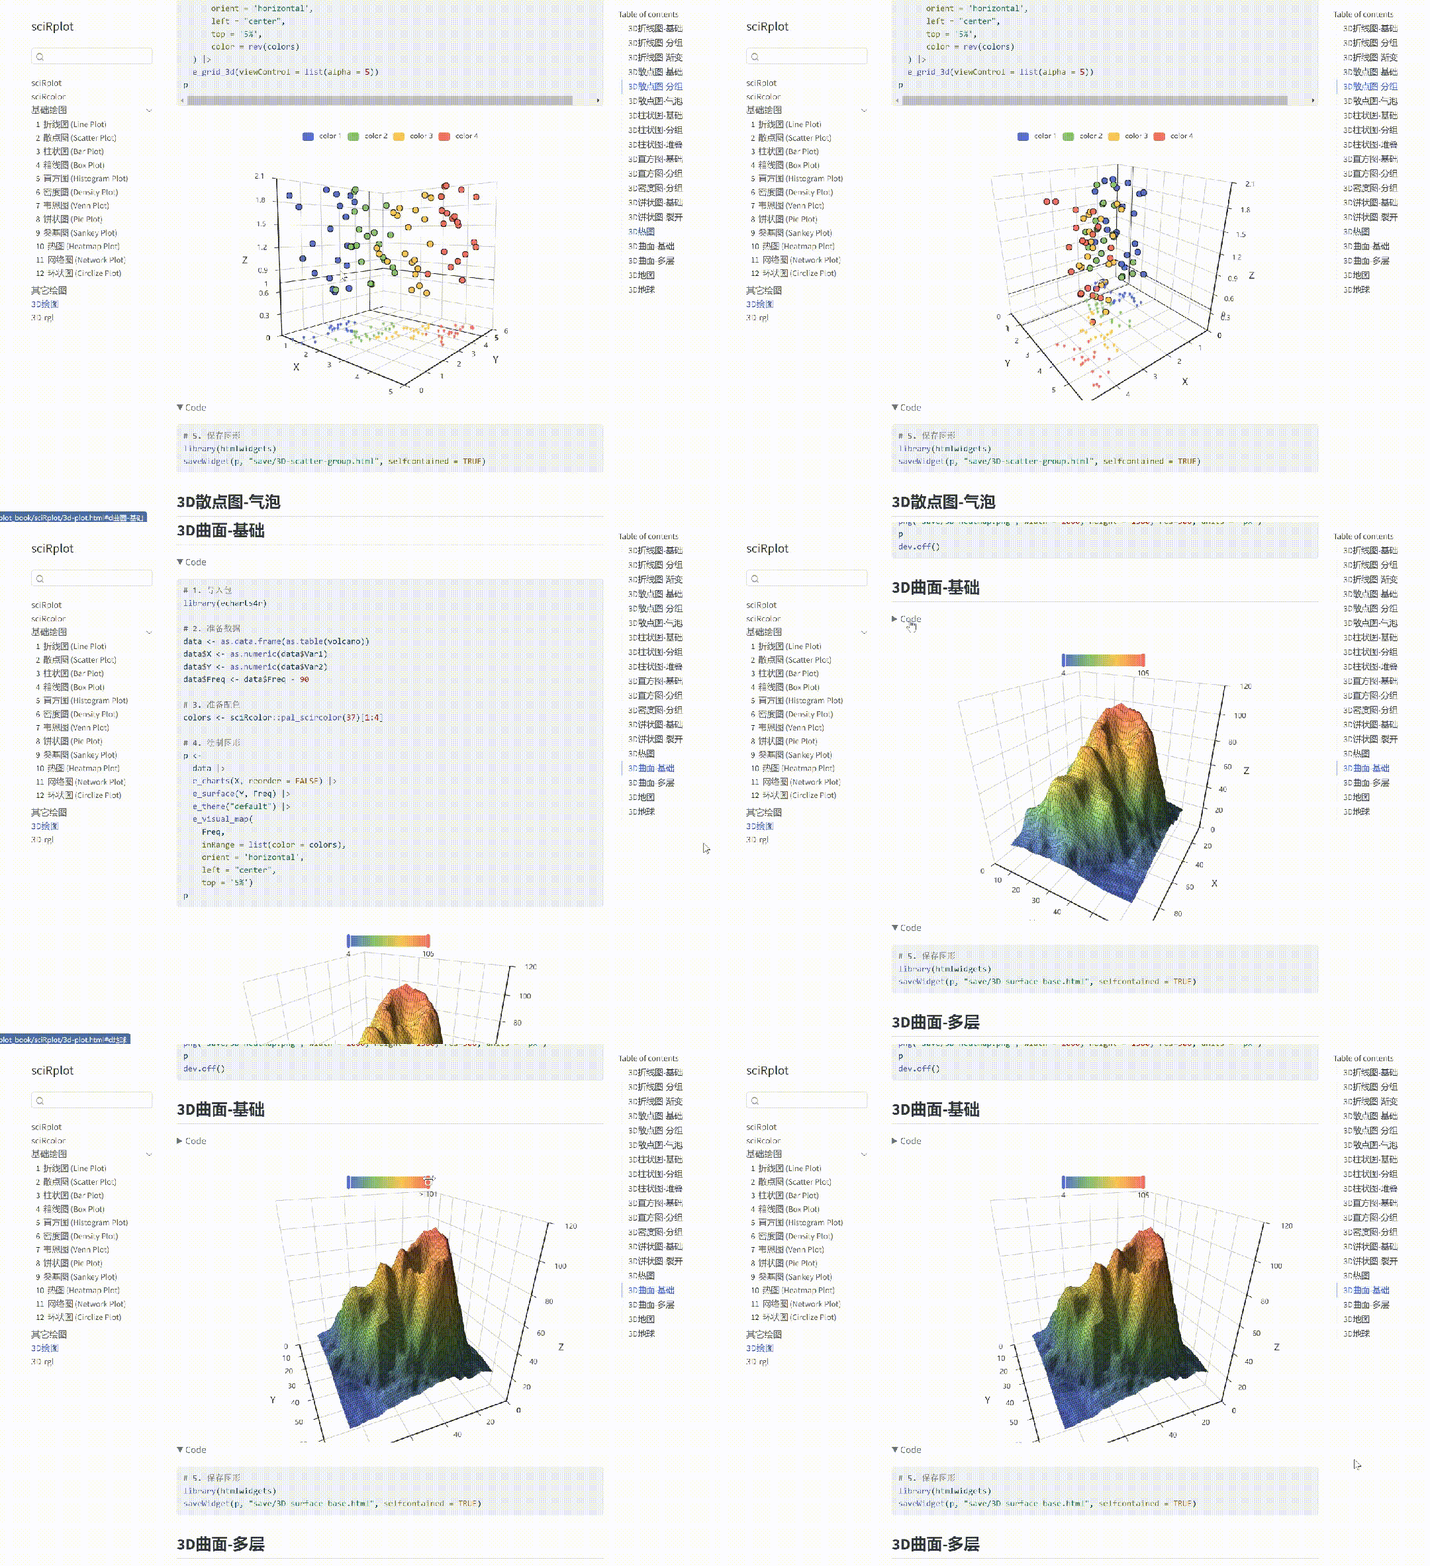
R 语言科研绘图第 55 期 --- 网络图-聚类
在发表科研论文的过程中,科研绘图是必不可少的,一张好看的图形会是文章很大的加分项。 为了便于使用,本系列文章介绍的所有绘图都已收录到了 sciRplot 项目中,获取方式: R 语言科研绘图模板 --- sciRplothttps://mp.…...
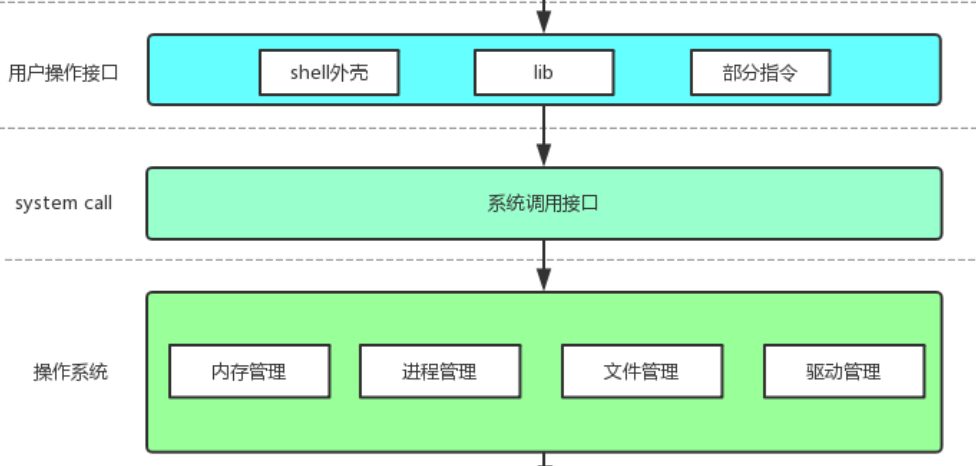
【Linux手册】探秘系统世界:从用户交互到硬件底层的全链路工作之旅
目录 前言 操作系统与驱动程序 是什么,为什么 怎么做 system call 用户操作接口 总结 前言 日常生活中,我们在使用电子设备时,我们所输入执行的每一条指令最终大多都会作用到硬件上,比如下载一款软件最终会下载到硬盘上&am…...

0x-3-Oracle 23 ai-sqlcl 25.1 集成安装-配置和优化
是不是受够了安装了oracle database之后sqlplus的简陋,无法删除无法上下翻页的苦恼。 可以安装readline和rlwrap插件的话,配置.bahs_profile后也能解决上下翻页这些,但是很多生产环境无法安装rpm包。 oracle提供了sqlcl免费许可,…...
