word poi-tl 图表功能增强,插入图表折线图、柱状图、饼状图
目录
- 问题
- 解决问题
- poi-tl介绍
- 功能实现
- 引入依赖
- 功能介绍
- 功能实例
- 饼图
- 模版
- 代码
- 效果图
- 雷达图(模版同饼图)
- 代码
- 效果图
- 柱状图(模版同饼图)
- 代码
- 效果图
- 附加
- CustomCharts 工具类
- CustomChartSingleSeriesRenderData 数据对象
- CustomChartRenderPolicy 插件类
问题
由于在开发功能需求中,word文档需要根据数据动态生成图表,不同的数据类型生成不同的图表信息,而word模版引擎原有功能只能做替换,不满足需求;
解决问题
- 目前选择的poi-tl的模版引擎,在原有的基础上新增自定义插件来实现功能
poi-tl介绍
poi-tl 是一个基于Apache POI的Word模板引擎,也是一个免费开源的Java类库,你可以非常方便的加入到你的项目中;
| Word模板引擎功能 | 描述 |
|---|---|
| 文本 | 将标签渲染为文本 |
| 图片 | 将标签渲染为图片 |
| 表格 | 将标签渲染为表格 |
| 图表 | 条形图(3D条形图)、柱形图(3D柱形图)、面积图(3D面积图)、折线图(3D折线图)、雷达图、饼图(3D饼图)、散点图等图表渲染 |
| If Condition判断 | 根据条件隐藏或者显示某些文档内容(包括文本、段落、图片、表格、列表、图表等) |
| Foreach Loop循环 | 根据集合循环某些文档内容(包括文本、段落、图片、表格、列表、图表等) |
| Loop表格行 | 循环复制渲染表格的某一行 |
| Loop表格列 | 循环复制渲染表格的某一列 |
| Loop有序列表 | 支持有序列表的循环,同时支持多级列表 |
| Highlight代码高亮 | word中代码块高亮展示,支持26种语言和上百种着色样式 |
| Markdown | 将Markdown渲染为word文档 |
| Word批注 | 完整的批注功能,创建批注、修改批注等 |
| Word附件 | Word中插入附件 |
| SDT内容控件 | 内容控件内标签支持 |
| Textbox文本框 | 文本框内标签支持 |
| 图片替换 | 将原有图片替换成另一张图片 |
| 书签、锚点、超链接 | 支持设置书签,文档内锚点和超链接功能 |
| Expression Language | 完全支持SpringEL表达式,可以扩展更多的表达式:OGNL, MVEL |
| 样式 | 支持有序列表的循环,同时支持多级列表 |
| 模板嵌套 | 模板包含子模板,子模板再包含子模板 |
| 模板嵌套 | 模板包含子模板,子模板再包含子模板 |
| 合并 | Word合并Merge,也可以在指定位置进行合并 |
| 用户自定义函数(插件) | 插件化设计,在文档任何位置执行函数 |
功能实现
引入依赖
<dependency><groupId>com.deepoove</groupId><artifactId>poi-tl</artifactId><version>1.12.2</version></dependency><dependency><groupId>org.apache.poi</groupId><artifactId>poi-ooxml-full</artifactId><version>5.2.5</version></dependency><dependency><groupId>org.apache.poi</groupId><artifactId>poi-ooxml</artifactId><version>5.2.5</version></dependency><dependency><groupId>org.apache.poi</groupId><artifactId>poi</artifactId><version>5.2.5</version></dependency><dependency><groupId>cn.hutool</groupId><artifactId>hutool-all</artifactId><version>5.8.25</version></dependency><!-- spring el表达式 --><dependency><groupId>org.springframework</groupId><artifactId>spring-expression</artifactId><version>5.3.18</version></dependency>
功能介绍
- 目前支持的图表类型有饼图、柱形图、面积图、折线图、雷达图等
- 同时支持添加到表格一起渲染
功能实例
饼图
模版

代码
@Testpublic void test() throws Exception {Configure config = Configure.builder().addPlugin('&',new CustomChartRenderPolicy()).useSpringEL(false).build();Map<String,Object> dataMap = new HashMap<String, Object>();CustomChartSingleSeriesRenderData chartSingleSeriesRenderData = CustomCharts.ofPie("日期", new String[]{"2024-01", "2024-02", "2024-03", "2024-04", "2024-05", "2024-06","2024-07", "2024-08", "2024-09", "2024-10", "2024-11", "2024-12"}).series("数值", new Integer[]{10, 35, 21, 46, 79, 55,39, 32, 71, 28, 22, 11}).setWidthAndHeight(10,10).create();dataMap.put("testChars", chartSingleSeriesRenderData);ClassPathResource classPathResource = new ClassPathResource("static/word/template.docx");try (InputStream resourceInputStream = classPathResource.getInputStream();XWPFTemplate template = XWPFTemplate.compile(resourceInputStream,config);){template.render(dataMap);template.writeAndClose(new FileOutputStream("output.docx"));} catch (Exception e) {e.printStackTrace();}}
效果图

雷达图(模版同饼图)
代码
@Testpublic void test() throws Exception {Configure config = Configure.builder().addPlugin('&',new CustomChartRenderPolicy()).useSpringEL(false).build();Map<String,Object> dataMap = new HashMap<String, Object>();CustomChartSingleSeriesRenderData chartSingleSeriesRenderData = CustomCharts.ofRadar("日期", new String[]{"2024-01", "2024-02", "2024-03", "2024-04", "2024-05", "2024-06","2024-07", "2024-08", "2024-09", "2024-10", "2024-11", "2024-12"}).series("数值", new Integer[]{10, 35, 21, 46, 79, 55,39, 32, 71, 28, 22, 11}).setWidthAndHeight(10,10).create();dataMap.put("testChars", chartSingleSeriesRenderData);ClassPathResource classPathResource = new ClassPathResource("static/word/template.docx");try (InputStream resourceInputStream = classPathResource.getInputStream();XWPFTemplate template = XWPFTemplate.compile(resourceInputStream,config);){template.render(dataMap);template.writeAndClose(new FileOutputStream("output.docx"));} catch (Exception e) {e.printStackTrace();}}
效果图

柱状图(模版同饼图)
代码
@Testpublic void test() throws Exception {Configure config = Configure.builder().addPlugin('&',new CustomChartRenderPolicy()).useSpringEL(false).build();Map<String,Object> dataMap = new HashMap<String, Object>();CustomChartSingleSeriesRenderData chartSingleSeriesRenderData = CustomCharts.ofBar("日期", new String[]{"2024-01", "2024-02", "2024-03", "2024-04", "2024-05", "2024-06","2024-07", "2024-08", "2024-09", "2024-10", "2024-11", "2024-12"}).series("数值", new Integer[]{10, 35, 21, 46, 79, 55,39, 32, 71, 28, 22, 11}).setWidthAndHeight(10,10).create();dataMap.put("testChars", chartSingleSeriesRenderData);ClassPathResource classPathResource = new ClassPathResource("static/word/template.docx");try (InputStream resourceInputStream = classPathResource.getInputStream();XWPFTemplate template = XWPFTemplate.compile(resourceInputStream,config);){template.render(dataMap);template.writeAndClose(new FileOutputStream("output.docx"));} catch (Exception e) {e.printStackTrace();}}
效果图

附加
CustomCharts 工具类
import com.deepoove.poi.data.RenderData;
import com.deepoove.poi.data.RenderDataBuilder;
import com.deepoove.poi.data.SeriesRenderData;
import org.apache.poi.xddf.usermodel.chart.ChartTypes;public class CustomCharts {public static CustomCharts.ChartSingles ofArea(String chartTitle, String[] categories) {return ofSingleSeries(chartTitle, categories, ChartTypes.AREA);}public static CustomCharts.ChartSingles ofRadar(String chartTitle, String[] categories) {return ofSingleSeries(chartTitle, categories, ChartTypes.RADAR);}public static CustomCharts.ChartSingles ofLine(String chartTitle, String[] categories) {return ofSingleSeries(chartTitle, categories, ChartTypes.LINE);}public static CustomCharts.ChartSingles ofBar(String chartTitle, String[] categories) {return ofSingleSeries(chartTitle, categories, ChartTypes.BAR);}public static CustomCharts.ChartSingles ofPie(String chartTitle, String[] categories) {return ofSingleSeries(chartTitle, categories, ChartTypes.PIE);}public static CustomCharts.ChartSingles ofPie3D(String chartTitle, String[] categories) {return ofSingleSeries(chartTitle, categories, ChartTypes.PIE3D);}public static CustomCharts.ChartSingles ofDoughnut(String chartTitle, String[] categories) {return ofSingleSeries(chartTitle, categories, ChartTypes.DOUGHNUT);}public static CustomCharts.ChartSingles ofSingleSeries(String chartTitle, String[] categories, ChartTypes chartTypes) {return new CustomCharts.ChartSingles(chartTitle, categories, chartTypes);}public static interface ChartSetting<T extends RenderData> {CustomCharts.ChartBuilder<T> setxAsixTitle(String xAxisTitle);CustomCharts.ChartBuilder<T> setyAsixTitle(String yAxisTitle);}public static abstract class ChartBuilder<T extends RenderData> implements RenderDataBuilder<T>, CustomCharts.ChartSetting<T> {protected String chartTitle;protected String xAxisTitle;protected String yAxisTitle;protected String[] categories;protected ChartTypes chartTypes;protected ChartBuilder(String chartTitle, String[] categories, ChartTypes chartTypes) {this.chartTitle = chartTitle;this.categories = categories;this.chartTypes = chartTypes;}protected void checkLengh(int length) {if (categories.length != length) {throw new IllegalArgumentException("The length of categories and series values in chart must be the same!");}}public CustomCharts.ChartBuilder<T> setxAsixTitle(String xAxisTitle) {this.xAxisTitle = xAxisTitle;return this;}public CustomCharts.ChartBuilder<T> setyAsixTitle(String yAxisTitle) {this.yAxisTitle = yAxisTitle;return this;}}/*** builder to build single series chart*/public static class ChartSingles extends CustomCharts.ChartBuilder<CustomChartSingleSeriesRenderData> {private SeriesRenderData series;/*** 宽度*/private Integer width = 10;/*** 高度*/private Integer height = 6;private ChartSingles(String chartTitle, String[] categories, ChartTypes chartTypes) {super(chartTitle, categories, chartTypes);}public CustomCharts.ChartSingles series(String name, Number[] value) {checkLengh(value.length);series = new SeriesRenderData(name, value);return this;}public CustomCharts.ChartSingles setWidthAndHeight(Integer width, Integer height) {this.width = width;this.height = height;return this;}@Overridepublic CustomChartSingleSeriesRenderData create() {CustomChartSingleSeriesRenderData data = new CustomChartSingleSeriesRenderData();data.setChartTitle(chartTitle);data.setxAxisTitle(xAxisTitle);data.setyAxisTitle(yAxisTitle);data.setCategories(categories);data.setSeriesData(series);data.setChartTypes(chartTypes);data.setWidth(width);data.setHeight(height);return data;}}
}
CustomChartSingleSeriesRenderData 数据对象
import com.deepoove.poi.data.ChartSingleSeriesRenderData;
import lombok.Data;
import org.apache.poi.xddf.usermodel.chart.ChartTypes;@Data
public class CustomChartSingleSeriesRenderData extends ChartSingleSeriesRenderData {private ChartTypes chartTypes;/*** 宽度*/private Integer width;/*** 高度*/private Integer height;
}
CustomChartRenderPolicy 插件类
import cn.hutool.core.util.StrUtil;
import com.deepoove.poi.data.SeriesRenderData;
import com.deepoove.poi.policy.AbstractRenderPolicy;
import com.deepoove.poi.render.RenderContext;
import org.apache.poi.ss.util.CellRangeAddress;
import org.apache.poi.util.Units;
import org.apache.poi.xddf.usermodel.PresetColor;
import org.apache.poi.xddf.usermodel.XDDFColor;
import org.apache.poi.xddf.usermodel.XDDFShapeProperties;
import org.apache.poi.xddf.usermodel.XDDFSolidFillProperties;
import org.apache.poi.xddf.usermodel.chart.AxisCrosses;
import org.apache.poi.xddf.usermodel.chart.AxisPosition;
import org.apache.poi.xddf.usermodel.chart.BarDirection;
import org.apache.poi.xddf.usermodel.chart.ChartTypes;
import org.apache.poi.xddf.usermodel.chart.LegendPosition;
import org.apache.poi.xddf.usermodel.chart.MarkerStyle;
import org.apache.poi.xddf.usermodel.chart.RadarStyle;
import org.apache.poi.xddf.usermodel.chart.XDDFBarChartData;
import org.apache.poi.xddf.usermodel.chart.XDDFCategoryAxis;
import org.apache.poi.xddf.usermodel.chart.XDDFCategoryDataSource;
import org.apache.poi.xddf.usermodel.chart.XDDFChartAxis;
import org.apache.poi.xddf.usermodel.chart.XDDFChartData;
import org.apache.poi.xddf.usermodel.chart.XDDFChartLegend;
import org.apache.poi.xddf.usermodel.chart.XDDFDataSource;
import org.apache.poi.xddf.usermodel.chart.XDDFDataSourcesFactory;
import org.apache.poi.xddf.usermodel.chart.XDDFLineChartData;
import org.apache.poi.xddf.usermodel.chart.XDDFNumericalDataSource;
import org.apache.poi.xddf.usermodel.chart.XDDFPieChartData;
import org.apache.poi.xddf.usermodel.chart.XDDFRadarChartData;
import org.apache.poi.xddf.usermodel.chart.XDDFValueAxis;
import org.apache.poi.xwpf.usermodel.XWPFChart;
import org.apache.poi.xwpf.usermodel.XWPFDocument;
import org.apache.poi.xwpf.usermodel.XWPFRun;
import org.openxmlformats.schemas.drawingml.x2006.chart.CTPieSer;import java.util.ArrayList;
import java.util.List;
import java.util.Objects;public class CustomChartRenderPolicy extends AbstractRenderPolicy<CustomChartSingleSeriesRenderData> {private Boolean titleOverlayCode;public CustomChartRenderPolicy() {this(false);}public CustomChartRenderPolicy(Boolean titleOverlayCode) {this.titleOverlayCode = titleOverlayCode;}@Overrideprotected void afterRender(RenderContext<CustomChartSingleSeriesRenderData> context) {//清空标签 clearParagraph 为true 存在表外的图表渲染不了clearPlaceholder(context, false);}@Overridepublic void doRender(RenderContext<CustomChartSingleSeriesRenderData> context) throws Exception {XWPFRun run = context.getRun();XWPFDocument xwpfDocument = (XWPFDocument)context.getXWPFDocument();CustomChartSingleSeriesRenderData singleSeriesRenderData = context.getData();if (Objects.isNull(singleSeriesRenderData)) {return;}Integer height = singleSeriesRenderData.getHeight();Integer width = singleSeriesRenderData.getWidth();//在标签位置创建chart图表对象XWPFChart chart = xwpfDocument.createChart(run, width * Units.EMU_PER_CENTIMETER, height * Units.EMU_PER_CENTIMETER);SeriesRenderData seriesData = singleSeriesRenderData.getSeriesData();//图例是否覆盖标题chart.setTitleOverlay(this.titleOverlayCode);String[] xAxisData = singleSeriesRenderData.getCategories();Number[] yAxisData = seriesData.getValues();ChartTypes chartTypes = singleSeriesRenderData.getChartTypes();//创建图表对象execChartData(chart, chartTypes, singleSeriesRenderData, xAxisData, yAxisData);//图表相关设置//图表标题if (StrUtil.isNotEmpty(singleSeriesRenderData.getChartTitle())) {chart.setTitleText(singleSeriesRenderData.getChartTitle());} else {chart.removeTitle();chart.deleteLegend();}}private static void solidFillSeries(XDDFChartData.Series series, PresetColor color) {XDDFSolidFillProperties fill = new XDDFSolidFillProperties(XDDFColor.from(color));XDDFShapeProperties properties = series.getShapeProperties();if (properties == null) {properties = new XDDFShapeProperties();}properties.setFillProperties(fill);series.setShapeProperties(properties);}private void execChartData(XWPFChart chart, ChartTypes chartType, CustomChartSingleSeriesRenderData singleSeriesRenderData, String[] xAxisData, Number[] yAxisData) {XDDFChartData xddfChartData = null;switch (chartType) {case AREA:break;case AREA3D:break;case BAR:xddfChartData = performBarRendering(chart, chartType, singleSeriesRenderData, xAxisData, yAxisData);break;case BAR3D:break;case DOUGHNUT:break;case LINE:xddfChartData = performLineRendering(chart, chartType, singleSeriesRenderData, xAxisData, yAxisData);break;case LINE3D:break;case PIE:xddfChartData = performPieRendering(chart, chartType, singleSeriesRenderData, xAxisData, yAxisData);break;case PIE3D:break;case RADAR:performRadarRendering(chart, chartType, singleSeriesRenderData, xAxisData, yAxisData);break;case SCATTER:break;case SURFACE:break;case SURFACE3D:break;default:break;}//在标签位置绘制折线图if (Objects.nonNull(xddfChartData)) {chart.plot(xddfChartData);}}/*** PIE** @param chart* @param chartType* @param xAxisData* @param yAxisData* @return*/private XDDFChartData performPieRendering(XWPFChart chart, ChartTypes chartType, CustomChartSingleSeriesRenderData singleSeriesRenderData, String[] xAxisData, Number[] yAxisData) {// 图例位置XDDFChartLegend legend = chart.getOrAddLegend();legend.setPosition(LegendPosition.TOP_RIGHT);//设置X轴数据XDDFCategoryDataSource xAxisSource = XDDFDataSourcesFactory.fromArray(xAxisData);//设置Y轴数据XDDFNumericalDataSource<Number> yAxisSource = XDDFDataSourcesFactory.fromArray(yAxisData);//创建对象// 将数据源绑定到饼图上XDDFChartData xddfPieChartData = chart.createData(ChartTypes.PIE, null, null);XDDFPieChartData.Series series = (XDDFPieChartData.Series)xddfPieChartData.addSeries(xAxisSource, yAxisSource);series.setTitle(null,null);// 为了在饼图上显示百分比等信息,需要调用下面的方法series.setShowLeaderLines(true);if (StrUtil.isEmpty(singleSeriesRenderData.getChartTitle())) {// 隐藏图例标识、系列名称、分类名称和数值CTPieSer ctPieSer = series.getCTPieSer();showCateName(ctPieSer, false);showVal(ctPieSer, false);showLegendKey(ctPieSer, false);showSerName(ctPieSer, false);}return xddfPieChartData;}public void showCateName(CTPieSer series, boolean val) {if (series.getDLbls().isSetShowCatName()) {series.getDLbls().getShowCatName().setVal(val);} else {series.getDLbls().addNewShowCatName().setVal(val);}}public void showVal(CTPieSer series, boolean val) {if (series.getDLbls().isSetShowVal()) {series.getDLbls().getShowVal().setVal(val);} else {series.getDLbls().addNewShowVal().setVal(val);}}public void showSerName(CTPieSer series, boolean val) {if (series.getDLbls().isSetShowSerName()) {series.getDLbls().getShowSerName().setVal(val);} else {series.getDLbls().addNewShowSerName().setVal(val);}}public void showLegendKey(CTPieSer series, boolean val) {if (series.getDLbls().isSetShowLegendKey()) {series.getDLbls().getShowLegendKey().setVal(val);} else {series.getDLbls().addNewShowLegendKey().setVal(val);}}private XDDFChartData performBarRendering(XWPFChart chart, ChartTypes chartType, CustomChartSingleSeriesRenderData singleSeriesRenderData, String[] xAxisData, Number[] yAxisData) {// 定义类别轴和数值轴XDDFCategoryAxis bottomAxis = chart.createCategoryAxis(AxisPosition.BOTTOM);XDDFValueAxis leftAxis = chart.createValueAxis(AxisPosition.LEFT);leftAxis.setCrosses(AxisCrosses.AUTO_ZERO);//设置X轴数据XDDFCategoryDataSource catSource = XDDFDataSourcesFactory.fromArray(xAxisData);//设置Y轴数据XDDFNumericalDataSource<Number> valSource = XDDFDataSourcesFactory.fromArray(yAxisData);// 创建柱状图数据系列XDDFBarChartData barChartData = (XDDFBarChartData) chart.createData(chartType, bottomAxis, leftAxis);XDDFBarChartData.Series series1 = (XDDFBarChartData.Series) barChartData.addSeries(catSource, valSource);series1.setTitle("示例系列", null); // 设置系列标题// 设置柱状图样式barChartData.setBarDirection(BarDirection.COL);return barChartData;}private XDDFChartData performRadarRendering(XWPFChart chart, ChartTypes chartType, CustomChartSingleSeriesRenderData singleSeriesRenderData, String[] xAxisData, Number[] yAxisData) {List<Number[]> list = new ArrayList<>();list.add(yAxisData);setRadarData(chart, new String[]{"系列一"}, xAxisData, list);return null;}private void setRadarData(XWPFChart chart, String[] series, String[] categories,List<Number[]> list) {XDDFChartAxis bottomAxis = chart.createCategoryAxis(AxisPosition.BOTTOM);XDDFValueAxis leftAxis = chart.createValueAxis(AxisPosition.LEFT);leftAxis.setCrosses(AxisCrosses.AUTO_ZERO);XDDFRadarChartData radar = (XDDFRadarChartData) chart.createData(org.apache.poi.xddf.usermodel.chart.ChartTypes.RADAR, bottomAxis, leftAxis);final int numOfPoints = categories.length;final String categoryDataRange = chart.formatRange(new CellRangeAddress(1, numOfPoints, 0, 0));final XDDFDataSource<?> categoriesData = XDDFDataSourcesFactory.fromArray(categories, categoryDataRange, 0);for (int i = 0; i < list.size(); i++) {final String valuesDataRange = chart.formatRange(new CellRangeAddress(1, numOfPoints, i + 1, i + 1));final XDDFNumericalDataSource<? extends Number> valuesData = XDDFDataSourcesFactory.fromArray(list.get(i),valuesDataRange, i);XDDFChartData.Series s = radar.addSeries(categoriesData, valuesData);s.setTitle(series[i], chart.setSheetTitle(series[i], i));}radar.setStyle(RadarStyle.STANDARD);chart.plot(radar);if (list.size() > 1) {XDDFChartLegend legend = chart.getOrAddLegend();legend.setPosition(LegendPosition.BOTTOM);legend.setOverlay(false);}}/*** LINE 渲染*/private XDDFChartData performLineRendering(XWPFChart chart, ChartTypes chartType, CustomChartSingleSeriesRenderData singleSeriesRenderData, String[] xAxisData, Number[] yAxisData) {//图例设置XDDFChartLegend legend = chart.getOrAddLegend();//图例位置:上下左右legend.setPosition(LegendPosition.TOP);//X轴(分类轴)相关设置//创建X轴,并且指定位置XDDFCategoryAxis xAxis = chart.createCategoryAxis(AxisPosition.BOTTOM);String xAxisTitle = singleSeriesRenderData.getxAxisTitle();//x轴标题if (StrUtil.isNotEmpty(xAxisTitle)) {xAxis.setTitle(xAxisTitle);}//Y轴(值轴)相关设置XDDFValueAxis yAxis = chart.createValueAxis(AxisPosition.LEFT); // 创建Y轴,指定位置if (StrUtil.isNotEmpty(singleSeriesRenderData.getyAxisTitle())) {yAxis.setTitle(singleSeriesRenderData.getyAxisTitle()); // Y轴标题}//创建折线图对象XDDFLineChartData customChartData = (XDDFLineChartData) chart.createData(chartType, xAxis, yAxis);//设置X轴数据XDDFCategoryDataSource xAxisSource = XDDFDataSourcesFactory.fromArray(xAxisData);//设置Y轴数据XDDFNumericalDataSource<Number> yAxisSource = XDDFDataSourcesFactory.fromArray(yAxisData);//加载折线图数据集XDDFLineChartData.Series lineSeries = (XDDFLineChartData.Series) customChartData.addSeries(xAxisSource, yAxisSource);//线条样式:true平滑曲线,false折线lineSeries.setSmooth(false);// 标记点样式lineSeries.setMarkerStyle(MarkerStyle.CIRCLE);//lineSeries.setMarkerSize((short) 5);return customChartData;}
}
相关文章:
word poi-tl 图表功能增强,插入图表折线图、柱状图、饼状图
目录 问题解决问题poi-tl介绍 功能实现引入依赖功能介绍 功能实例饼图模版代码效果图 雷达图(模版同饼图)代码效果图 柱状图(模版同饼图)代码效果图 附加CustomCharts 工具类CustomChartSingleSeriesRenderData 数据对象CustomCha…...

常见网络钓鱼类型
网络钓鱼是一种网络攻击,是指具有恶意动机的攻击者伪装欺骗人们并收集用户名或密码等敏感信息的一系列行为。由于网络钓鱼涉及心理操纵并依赖于人为失误(而不是硬件或软件漏洞),因此被认定为是一种社会工程攻击。 1. 普通网络钓鱼(群攻&…...

数字图像处理考研考点(持续更新)
一、数字图像基本概念 1、人眼视觉特性 (1)眼睛上有两类光感受器:锥状体和杆状体 锥状体(锥细胞):约 700 万个,对颜色高度敏感,每个锥状体都连接到神经末梢,人可以充分地分辨图像细节。锥细胞…...

Spring Cloud Alibaba:一站式微服务解决方案
Spring Cloud Alibaba介绍 在当今的软件开发领域,微服务架构因其灵活性、可扩展性和独立性等优势而备受青睐。Spring Cloud Alibaba 作为一款强大的一站式微服务解决方案,为开发者提供了丰富的工具和组件,帮助他们轻松构建和管理复杂的微服务…...

ubuntu16.04部署dify教程
文章目录 1、克隆 Dify 源代码至本地环境2、加速Dify镜像文件下载3、启动 Dify4、访问 Dify5、更新 Dify6、常见问题及解决方案(1)容器restarting(2)日志文件上限(3)重置管理员密码(4࿰…...

JavaWeb文件上传
文件上传总览 文件上传主要是指将本地文件(包括但不限于图片、视频、音频等)上传到服务器,提供其他用户浏览或下载的过程。在日常生活中,我们在很多情况下都需要使用文件上传功能,比如:发微博、发朋友圈等…...

软件工程——期末复习(3)
一、题目类(老师重点提到过的题目) 1、高可靠性是否意味着高可用性?试举例证明自己的观点? 答:高可靠性不意味着高可用性 可靠性说明系统已经准备好,马上可以使用;可用性是系统可以无故障的持续运行,是一…...

apache的BeanUtils的Converter被相互污染覆盖问题
问题描述 apache的BeanUtils工具集中用来把map对象转换为java对象的BeanUtils#populate方法会因为单例的原因其转换器Converter被相互污染覆盖问题 maven依赖 <dependency><groupId>commons-beanutils</groupId><artifactId>commons-beanutils</…...

TCP的“可靠性”(上)
目录 TCP的“可靠性”(上)确认应答(可靠性传输的基础)超时重传连接管理(三次握手,四次挥手) TCP的“可靠性”(上) 想必大家都或多或少的听说过TCP的特性:有连…...

超标量处理器设计笔记(5)虚拟存储器、地址转换、page fault
虚拟存储器 概述地址转换单级页表多级页表案例最好情况:虚拟地址是连续的最差情况:每个第二级 PT 都装有一项 增加级数 Page Fault 程序保护 概述 当程序比物理内存空间更大时,无法全部装在物理内存中,需要对程序进行切片 虚拟…...

SparkSQL 读写数据攻略:从基础到实战
目录 一、输入Source 1)代码演示最普通的文件读取方式: 2) 通过jdbc读取数据库数据 3) 读取table中的数据【hive】 二、输出Sink 实战一:保存普通格式 实战二:保存到数据库中 实战三:将结果保存在h…...
,避免重复多次调用接口的方法)
react 使用状态管理调用列表接口渲染列表(包含条件查询,统一使用查询按钮,重置功能),避免重复多次调用接口的方法
react开发调用api接口一般使用useEffect来监听值的变化,通过值的变化与否来进行接口调用。 比如我们要进行一个查询接口 const [pageParams, setPage] useState({name: ,id: ,});const [dataList, setDataList] useState([]);const getList async () > {const…...

Stable Audio Open模型部署教程:用AI打造独家节拍,让声音焕发新活力!
Stable Audio Open 是一个开源的文本到音频模型,允许用户从简单的文本提示中生成长达 47 秒的高质量音频数据。该模型非常适合创建鼓点、乐器即兴演奏、环境声音、拟音录音和其他用于音乐制作和声音设计的音频样本。用户还可以根据他们的自定义音频数据微调模型&…...
)
加油站-(贪心算法)
题目描述 在一条环路上有 n 个加油站,其中第 i 个加油站有汽油 gas[i] 升。 你有一辆油箱容量无限的的汽车,从第 i 个加油站开往第 i1 个加油站需要消耗汽油 cost[i] 升。你从其中的一个加油站出发,开始时油箱为空。 给定两个整数数组 gas…...
)
k8s-持久化存储PV与PVC(1)
1、概述 为什么 kubernetes 要持久化存储? 在 kubernetes 中部署应用都是以 Pod 的容器运行的,而 Pod 是有生命周期,一旦 Pod 被删除或重启后,这些数据也会随着丢失,则需要对这些数据进行持久化存储。 PV࿱…...

Linux Red Hat Enterprise
下载 https://developers.redhat.com/products/rhel/download 安装...

《中型 Vue 项目:挑战与成长》
一、引言 在当今的前端开发领域,Vue 作为一款渐进式 JavaScript 框架,以其强大的功能和灵活性备受开发者青睐。对于中型 Vue 项目而言,其重要性不言而喻。中型 Vue 项目通常在功能复杂度和规模上介于小型项目和大型项目之间,既需要…...

配置 DNS over HTTPS阻止DNS污染
概念介绍 DOH简介 DNS(域名系统)的主要功能是将域名解析成IP地址,域名的解析工作由DNS服务器完成。从安全角度来看,域名解析的请求传输时通常不进行任何加密,这导致第三方能够很容易拦截用户的DNS,将用…...

Facebook广告文案流量秘诀
Facebook 广告文案是制作有效 Facebook 广告的关键方面。它侧重于伴随广告视觉元素的文本内容。今天我们的博客将深入探讨成功的 Facebook 广告文案的秘密! 一、广告文案怎么写? 正文:这是帖子的正文,出现在您姓名的正下方。它可…...

22. 五子棋小游戏
文章目录 概要整体架构流程技术名词解释技术细节小结 1. 概要 🔊 JackQiao 对 米粒 说:“今天咱们玩个五子棋小游戏,电脑与你轮流在一个 nn 的网格上放置棋子(X 或 O),网格由你输入的正整数n决定࿰…...
eNSP-Cloud(实现本地电脑与eNSP内设备之间通信)
说明: 想象一下,你正在用eNSP搭建一个虚拟的网络世界,里面有虚拟的路由器、交换机、电脑(PC)等等。这些设备都在你的电脑里面“运行”,它们之间可以互相通信,就像一个封闭的小王国。 但是&#…...

STM32F4基本定时器使用和原理详解
STM32F4基本定时器使用和原理详解 前言如何确定定时器挂载在哪条时钟线上配置及使用方法参数配置PrescalerCounter ModeCounter Periodauto-reload preloadTrigger Event Selection 中断配置生成的代码及使用方法初始化代码基本定时器触发DCA或者ADC的代码讲解中断代码定时启动…...

五年级数学知识边界总结思考-下册
目录 一、背景二、过程1.观察物体小学五年级下册“观察物体”知识点详解:由来、作用与意义**一、知识点核心内容****二、知识点的由来:从生活实践到数学抽象****三、知识的作用:解决实际问题的工具****四、学习的意义:培养核心素养…...
linux arm系统烧录
1、打开瑞芯微程序 2、按住linux arm 的 recover按键 插入电源 3、当瑞芯微检测到有设备 4、松开recover按键 5、选择升级固件 6、点击固件选择本地刷机的linux arm 镜像 7、点击升级 (忘了有没有这步了 估计有) 刷机程序 和 镜像 就不提供了。要刷的时…...
Mac软件卸载指南,简单易懂!
刚和Adobe分手,它却总在Library里给你写"回忆录"?卸载的Final Cut Pro像电子幽灵般阴魂不散?总是会有残留文件,别慌!这份Mac软件卸载指南,将用最硬核的方式教你"数字分手术"࿰…...

【git】把本地更改提交远程新分支feature_g
创建并切换新分支 git checkout -b feature_g 添加并提交更改 git add . git commit -m “实现图片上传功能” 推送到远程 git push -u origin feature_g...

Matlab | matlab常用命令总结
常用命令 一、 基础操作与环境二、 矩阵与数组操作(核心)三、 绘图与可视化四、 编程与控制流五、 符号计算 (Symbolic Math Toolbox)六、 文件与数据 I/O七、 常用函数类别重要提示这是一份 MATLAB 常用命令和功能的总结,涵盖了基础操作、矩阵运算、绘图、编程和文件处理等…...
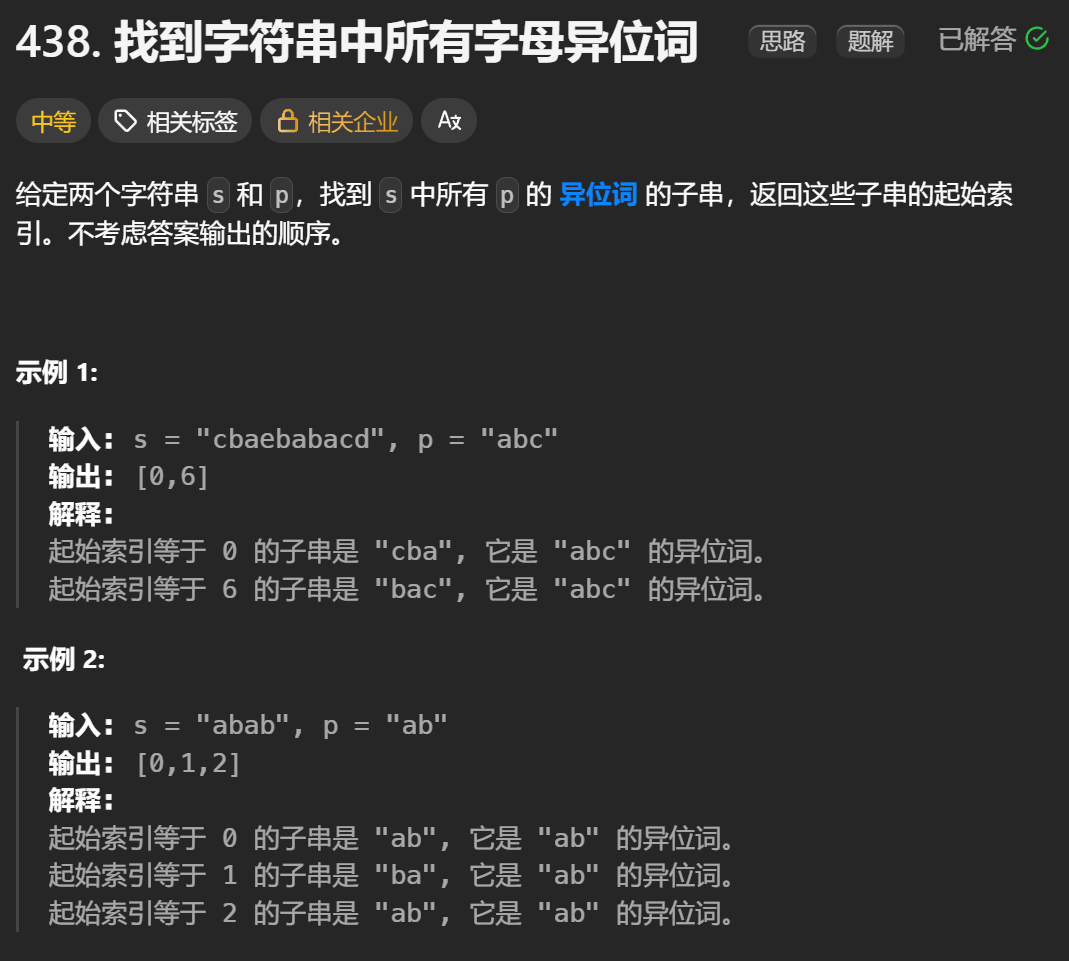
12.找到字符串中所有字母异位词
🧠 题目解析 题目描述: 给定两个字符串 s 和 p,找出 s 中所有 p 的字母异位词的起始索引。 返回的答案以数组形式表示。 字母异位词定义: 若两个字符串包含的字符种类和出现次数完全相同,顺序无所谓,则互为…...

学习STC51单片机32(芯片为STC89C52RCRC)OLED显示屏2
每日一言 今天的每一份坚持,都是在为未来积攒底气。 案例:OLED显示一个A 这边观察到一个点,怎么雪花了就是都是乱七八糟的占满了屏幕。。 解释 : 如果代码里信号切换太快(比如 SDA 刚变,SCL 立刻变&#…...
视觉slam十四讲实践部分记录——ch2、ch3
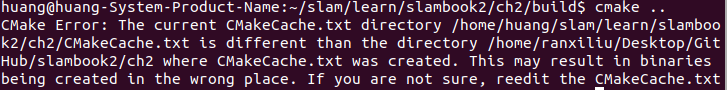
ch2 一、使用g++编译.cpp为可执行文件并运行(P30) g++ helloSLAM.cpp ./a.out运行 二、使用cmake编译 mkdir build cd build cmake .. makeCMakeCache.txt 文件仍然指向旧的目录。这表明在源代码目录中可能还存在旧的 CMakeCache.txt 文件,或者在构建过程中仍然引用了旧的路…...