uprobe 实战
观测数据源
目前按照我的理解,和trace相关的常用数据源–探针 大致分为四类。
内核
Trace point
kprobe
用户程序
USDT
uprobe
在用户程序中,USDT是所谓的静态Tracepoint。和内核代码中的Trace point类似。实现方式是在代码开发时,使用USDT的库和头文件。在代码中埋点。在运行时可以通过一些手段使能这些Tracepoint。而uprobe,是在kprobe的基础上沿袭下来。属于是动态探针。实现方式需要依托内核支持。在执行到此指令前或者后,进行代码注入。实现trace。
内核支持
引用参考文献
Uprobe-tracer: Uprobe-based Event Tracing=========================================Documentation written by Srikar DronamrajuOverview
--------
Uprobe based trace events are similar to kprobe based trace events.
To enable this feature, build your kernel with CONFIG_UPROBE_EVENTS=y.Similar to the kprobe-event tracer, this doesn't need to be activated via
current_tracer. Instead of that, add probe points via
/sys/kernel/debug/tracing/uprobe_events, and enable it via
/sys/kernel/debug/tracing/events/uprobes/<EVENT>/enabled.However unlike kprobe-event tracer, the uprobe event interface expects the
user to calculate the offset of the probepoint in the object.
6.6. Dynamic Tracing
For kernel analysis, I'm using CONFIG_KPROBES=y and CONFIG_KPROBE_EVENTS=y, to enable kernel dynamic tracing, and CONFIG_FRAME_POINTER=y, for frame pointer-based kernel stacks. For user-level analysis, CONFIG_UPROBES=y and CONFIG_UPROBE_EVENTS=y, for user-level dynamic tracing.
Kernel Config: 3.8.6
Here are some kernel CONFIG options for perf_events functionality:
# for perf_events:
CONFIG_PERF_EVENTS=y
# for stack traces:
CONFIG_FRAME_POINTER=y
# kernel symbols:
CONFIG_KALLSYMS=y
# tracepoints:
CONFIG_TRACEPOINTS=y
# kernel function trace:
CONFIG_FTRACE=y
# kernel-level dynamic tracing:
CONFIG_KPROBES=y
CONFIG_KPROBE_EVENTS=y
# user-level dynamic tracing:
CONFIG_UPROBES=y
CONFIG_UPROBE_EVENTS=y
# full kernel debug info:
CONFIG_DEBUG_INFO=y
# kernel lock tracing:
CONFIG_LOCKDEP=y
# kernel lock tracing:
CONFIG_LOCK_STAT=y
# kernel dynamic tracepoint variables:
CONFIG_DEBUG_INFO=y
You may need to build your own kernel to enable these. The exact set you need depends on your needs and kernel version, and list is likely to grow as new features are added to perf_events.
测试代码
#include <stdio.h>
#include <unistd.h>static void
print_curr_state_one(void)
{printf("This is the print current state one function\n");
}static void
print_curr_state_two(void)
{printf("This is the print current state two function\n");
}int main() {while(1) {print_curr_state_one();sleep(1);print_curr_state_two();}
}
通过 perf 使用 uprobe
uprobe作为数据源,可以通过多种途径使用。不同的工具实现的功能可能有所差别。
# perf probeUsage: perf probe [<options>] 'PROBEDEF' ['PROBEDEF' ...]or: perf probe [<options>] --add 'PROBEDEF' [--add 'PROBEDEF' ...]or: perf probe [<options>] --del '[GROUP:]EVENT' ...or: perf probe --list [GROUP:]EVENT ...or: perf probe [<options>] --funcs-a, --add <[EVENT=]FUNC[+OFF|%return] [[NAME=]ARG ...]>probe point definition, whereGROUP: Group name (optional)EVENT: Event nameFUNC: Function nameOFF: Offset from function entry (in byte)%return: Put the probe at function returnARG: Probe argument (kprobe-tracer argument format.)-D, --definition <[EVENT=]FUNC[+OFF|%return] [[NAME=]ARG ...]>Show trace event definition of given traceevent for k/uprobe_events.-d, --del <[GROUP:]EVENT>delete a probe event.-f, --force forcibly add events with existing name-F, --funcs <[FILTER]>Show potential probe-able functions.-k, --vmlinux <file> vmlinux pathname(not built-in because NO_DWARF=1)-L, --line <FUNC[:RLN[+NUM|-RLN2]]|SRC:ALN[+NUM|-ALN2]>Show source code lines.(not built-in because NO_DWARF=1)-l, --list <[GROUP:]EVENT>list up probe events-m, --module <modname|path>target module name (for online) or path (for offline)-n, --dry-run dry run-q, --quiet be quiet (do not show any messages)-s, --source <directory>path to kernel source(not built-in because NO_DWARF=1)-V, --vars <FUNC[@SRC][+OFF|%return|:RL|;PT]|SRC:AL|SRC;PT>Show accessible variables on PROBEDEF(not built-in because NO_DWARF=1)-v, --verbose be more verbose (show parsed arguments, etc)-x, --exec <executable|path>target executable name or path--cache Manipulate probe cache--demangle Enable symbol demangling--demangle-kernelEnable kernel symbol demangling--externs Show external variables too (with --vars only)(not built-in because NO_DWARF=1)--filter <[!]FILTER>Set a filter (with --vars/funcs only)(default: "!__k???tab_* & !__crc_*" for --vars,"!_*" for --funcs)--max-probes <n> Set how many probe points can be found for a probe.--no-inlines Don't search inlined functions(not built-in because NO_DWARF=1)--range Show variables location range in scope (with --vars only)(not built-in because NO_DWARF=1)--symfs <directory>Look for files with symbols relative to this directory--target-ns <pid>target pid for namespace contexts
其中这个(not built-in because NO_DWARF=1)很有意思,这是否意味着,不能通过debug info 去获取局部变量?也不能通过行号加probe?
通过搜索perf的源码,发现似乎是编译perf的时候没有开启。
那么我需要自己编译perf? 然后移植?
查看可用的probe并添加记录
查看可以插入探针的函数
# perf probe -x a.out -F
abort@plt
call_weak_fn
completed.8444
data_start
deregister_tm_clones
frame_dummy
main
print_curr_state_one
print_curr_state_two
puts@plt
register_tm_clones
sleep@plt
通过-x指定执行文件。-F显示可能被用来插入探针的函数。
插入探针
# perf probe -x a.out -a print_curr_state_one
Added new event:probe_a:print_curr_state_one (on print_curr_state_one in /home/root/test_uprobe/a.out)You can now use it in all perf tools, such as:perf record -e probe_a:print_curr_state_one -aR sleep 1
查看插入的探针
# perf probe -lprobe_a:print_curr_state_one (on print_curr_state_one in /home/root/test_uprobe/a.out)probe_a:print_curr_state_two (on print_curr_state_two in /home/root/test_uprobe/a.out)
开启记录新增的探针
# perf record -e probe_a:* -a
Couldn't synthesize bpf events.
^C[ perf record: Woken up 1 times to write data ]
[ perf record: Captured and wrote 0.159 MB perf.data (24 samples) ]
查看记录的结果
# perf scripta.out 3198 [000] 15137.303918: probe_a:print_curr_state_two: (40060c)a.out 3198 [000] 15137.304015: probe_a:print_curr_state_one: (4005ec)a.out 3198 [000] 15138.304117: probe_a:print_curr_state_two: (40060c)a.out 3198 [000] 15138.304153: probe_a:print_curr_state_one: (4005ec)a.out 3198 [000] 15139.304244: probe_a:print_curr_state_two: (40060c)a.out 3198 [000] 15139.304278: probe_a:print_curr_state_one: (4005ec)a.out 3198 [000] 15140.304378: probe_a:print_curr_state_two: (40060c)a.out 3198 [000] 15140.304415: probe_a:print_curr_state_one: (4005ec)a.out 3198 [001] 15141.304575: probe_a:print_curr_state_two: (40060c)a.out 3198 [001] 15141.304614: probe_a:print_curr_state_one: (4005ec)a.out 3198 [001] 15142.304696: probe_a:print_curr_state_two: (40060c)a.out 3198 [001] 15142.304729: probe_a:print_curr_state_one: (4005ec)a.out 3198 [001] 15143.304829: probe_a:print_curr_state_two: (40060c)a.out 3198 [001] 15143.304866: probe_a:print_curr_state_one: (4005ec)a.out 3198 [001] 15144.304969: probe_a:print_curr_state_two: (40060c)a.out 3198 [001] 15144.305004: probe_a:print_curr_state_one: (4005ec)a.out 3198 [001] 15145.305104: probe_a:print_curr_state_two: (40060c)a.out 3198 [001] 15145.305137: probe_a:print_curr_state_one: (4005ec)a.out 3198 [000] 15146.305243: probe_a:print_curr_state_two: (40060c)a.out 3198 [000] 15146.305279: probe_a:print_curr_state_one: (4005ec)a.out 3198 [000] 15147.305373: probe_a:print_curr_state_two: (40060c)a.out 3198 [000] 15147.305406: probe_a:print_curr_state_one: (4005ec)a.out 3198 [000] 15148.305499: probe_a:print_curr_state_two: (40060c)a.out 3198 [000] 15148.305533: probe_a:print_curr_state_one: (4005ec)
删去不再使用的probe
# perf probe -d probe_a:*
在LTTng中使用
Create or enable a recording event rule to match Linux kernel events created from a dynamic instrumentation point:
lttng [GENERAL OPTIONS] enable-event --kernel(--probe=LOC | --function=LOC | --userspace-probe=LOC) RECORDNAME[--session=SESSION] [--channel=CHANNEL]
# lttng enable-event --kernel --userspace-probe=./a.out:print_curr_state_one FUNC_A
kernel event FUNC_A created in channel channel0# lttng enable-event --kernel --userspace-probe=./a.out:print_curr_state_two FUNC_B
kernel event FUNC_B created in channel channel0
在设定上,uprobe仍然属于是内核提供 所以还是内核的trace事件。
在LTTng中,好像没有找到关于uretprobe的内容。也没有发现类似可以按照行或者抓取局部变量的内容。可能是LTTng没有做。
之后正常使能所有内核Trace事件。
然后记录log。进行分析。
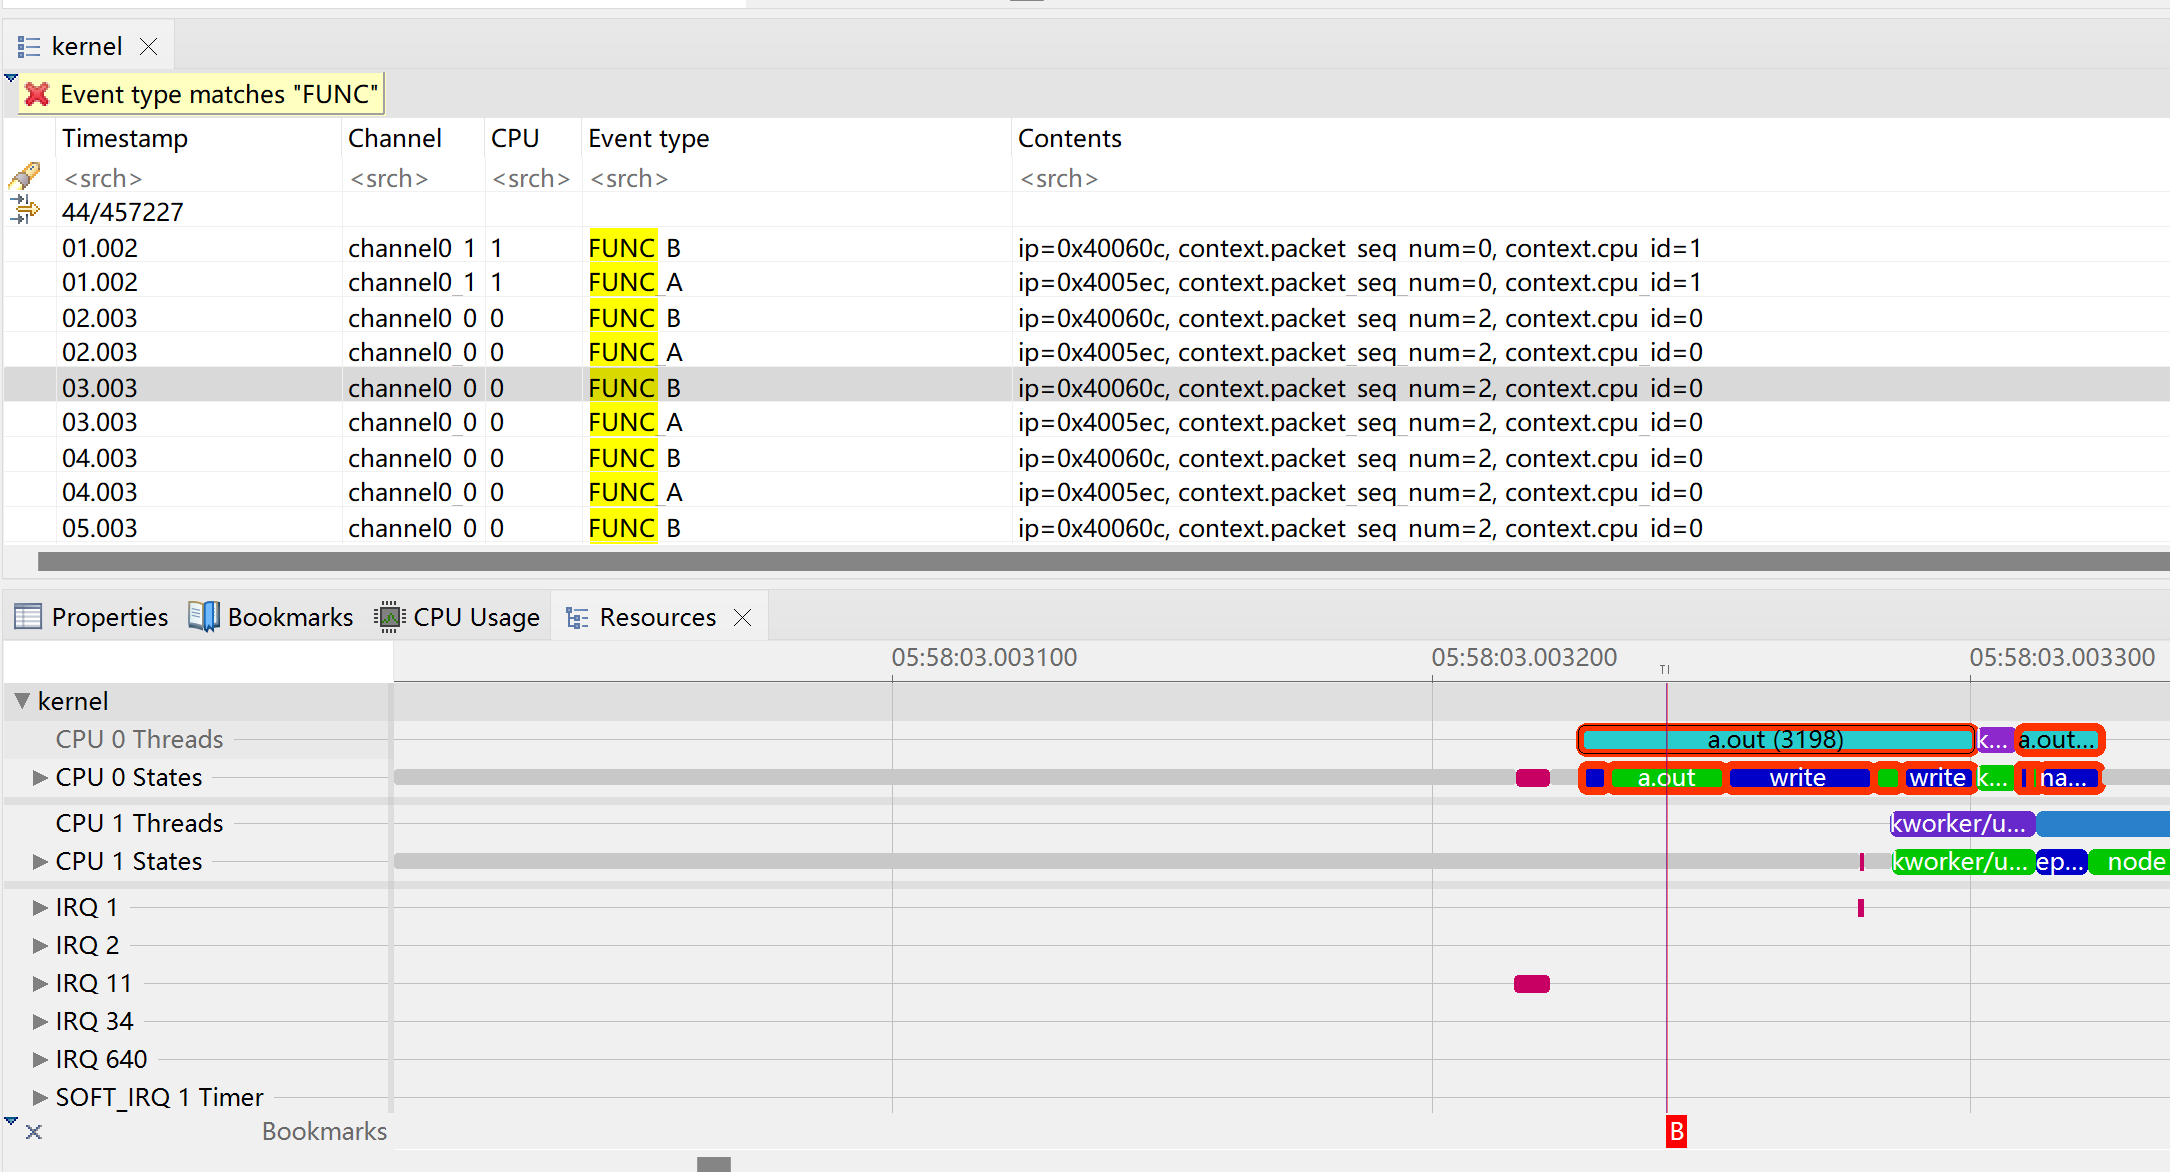
之后可以在可视化工具中查看进程调度,以及进程运行的细节。
在LTTng的log中,没有更多的细节,甚至函数名都没有保留,只有在注册probe的时候自定义的命名。
可能他们推荐大家使用LTTng-UST的USDT吧。
下一步工作
目前实际上是没有实现更细致的观测。例如perf prob -V /L这种。
可能需要重新编译移植perf.或者寻找其他的数据采集和分析工具。
或者有其他的工具可以使用。我甚至想尝试bpf了。但这意味着重新编译内核打开bpf的支持。
参考文献
- Linux K/Uprobe 使用指南 · GitBook (t-head.cn)
- Linux uprobe: User-Level Dynamic Tracing (brendangregg.com)
- https://www.kernel.org/doc/Documentation/trace/uprobetracer.txt
- Linux perf Examples (brendangregg.com)
- lttng-enable-event(1) [v2.13] — LTTng
相关文章:
uprobe 实战
观测数据源 目前按照我的理解,和trace相关的常用数据源–探针 大致分为四类。 内核 Trace point kprobe 用户程序 USDT uprobe 在用户程序中,USDT是所谓的静态Tracepoint。和内核代码中的Trace point类似。实现方式是在代码开发时,使用USDT…...
| 真题+思路+考点+代码+岗位)
华为OD机试 - 求最大数字(Python)| 真题+思路+考点+代码+岗位
求最大数字 题目 给定一个由纯数字组成以字符串表示的数值,现要求字符串中的每个数字最多只能出现2次,超过的需要进行删除;删除某个重复的数字后,其它数字相对位置保持不变。 如34533,数字3重复超过2次,需要删除其中一个3,删除第一个3后获得最大数值4533 请返回经过删…...

雨水情测报与大坝安全监测系统
压电式雨量传感器产品概述传感器由上盖、外壳和下盖组成,壳体内部有压电片和电路板,可以固定在外径50mm立柱上和气象站横杆上。传感器采用冲击测量原理对单个雨滴重量进行测算,进而计算降雨量。雨滴在降落过程中受到雨滴重量和空气阻力的作用…...

抖音广告投放形式有哪些?新品牌进入抖音怎么建立口碑
坐拥5亿用户的抖音平台,已经成为各大品牌的兵家必争之地。想要在这块宣传的“高地”,做出声量,就必须了解抖音广告投放形式有哪些。这里整理的这份抖音广告投放指南,你一定不能错过。一、抖音为何如此牛想要弄清楚抖音广告的投放形…...

Beefxss使用教程图文教程(超详细)
「作者主页」:士别三日wyx 「作者简介」:CSDN top100、阿里云博客专家、华为云享专家、网络安全领域优质创作者 Beefxss一、首次使用二、修改账号密码三、自带练习页面四、简单使用五、工具界面介绍六、功能演示1、网页重定向2、社工弹窗3、功能颜色标识…...
)
【Python学习笔记】35.Python3 CGI编程(2)
前言 本章继续介绍Python的CGI编程。 通过CGI程序传递checkbox数据 checkbox用于提交一个或者多个选项数据,HTML代码如下: 实例 <!DOCTYPE html> <html> <head> <meta charset"utf-8"> <title>csdn教程(csd…...

博客等级说明
CSDN 博客等级是按照用户的博客积分数量进行的设定,为 Lv1 至 Lv10 共 10 个等级,不同的等级创作者可以享受到不同的权益待遇。例如,皮肤奖励、自定义域名、客服优先处理、自定义文章标签等特权。您需要提高博客积分进一步提升等级࿰…...
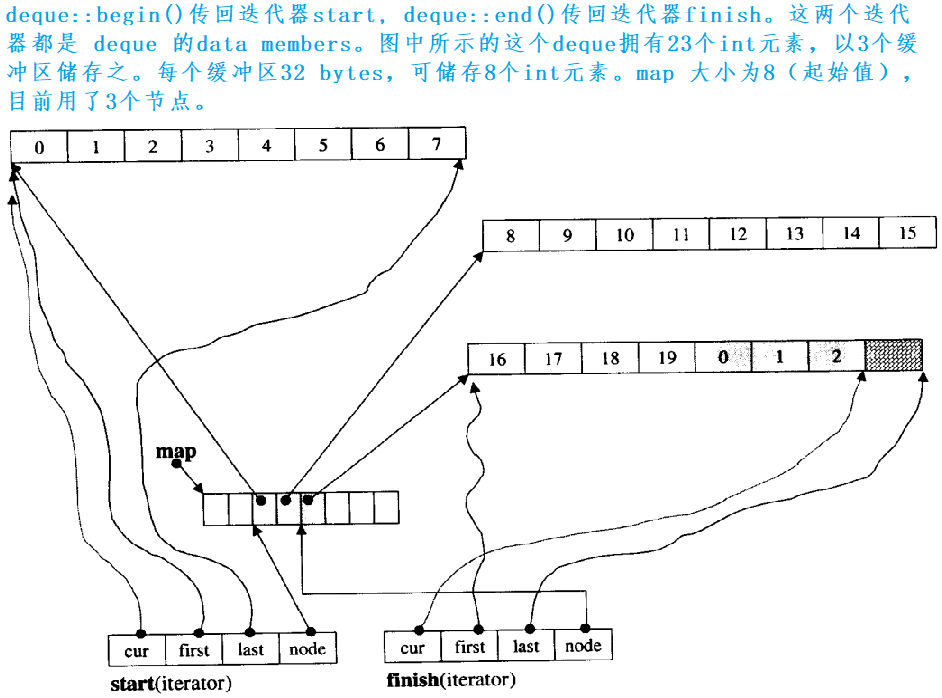
STL——容器适配器、deque
一、容器适配器 1.适配器 适配器是一种设计模式(设计模式是一套被反复使用的、多数人所知晓的、经过分类编目的、代码设计经验的总结),该种模式是将一个类的接口转换成客户希望的另外一个接口。 2.STL标准库中stack和queue的底层结构 stack…...

VBA数组和Excel工作表数据传递
本文介绍如何利用 VBA 的数组(Array) 来提高 Excel 单元格和外部数据传输的性能。如果数量比较大,通过 Array 来传输数据比直接操作单元格要快若干倍。 将 Range 的数据写入 VBA Array 将 Range 数据写入 VBA 的数组非常简单。下面的例子演示了用法&am…...
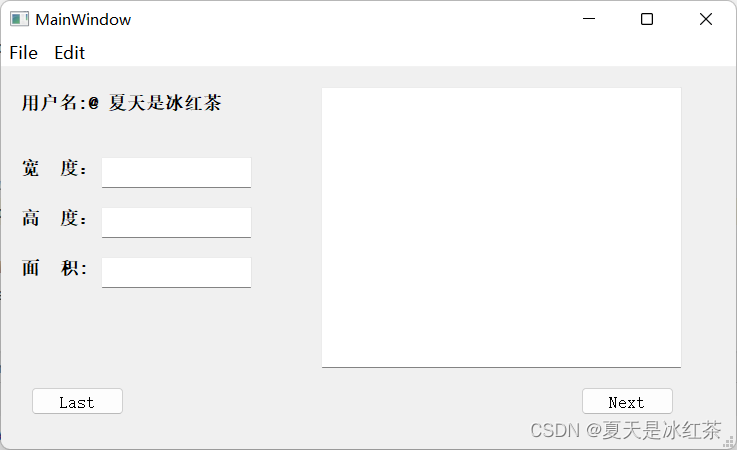
PyQt5保姆级入门教程——从安装到使用
目录 Part1:安装PyQt5 Part 2:PyCharm配置PyQt5 Part 3:PyQt5设计界面介绍 Part 4:PyQt5设计UI 今天看了多个大佬的教程,总算是把PyQt5开发弄好了,每个部分都要看几个人的十分不方便,我十分…...
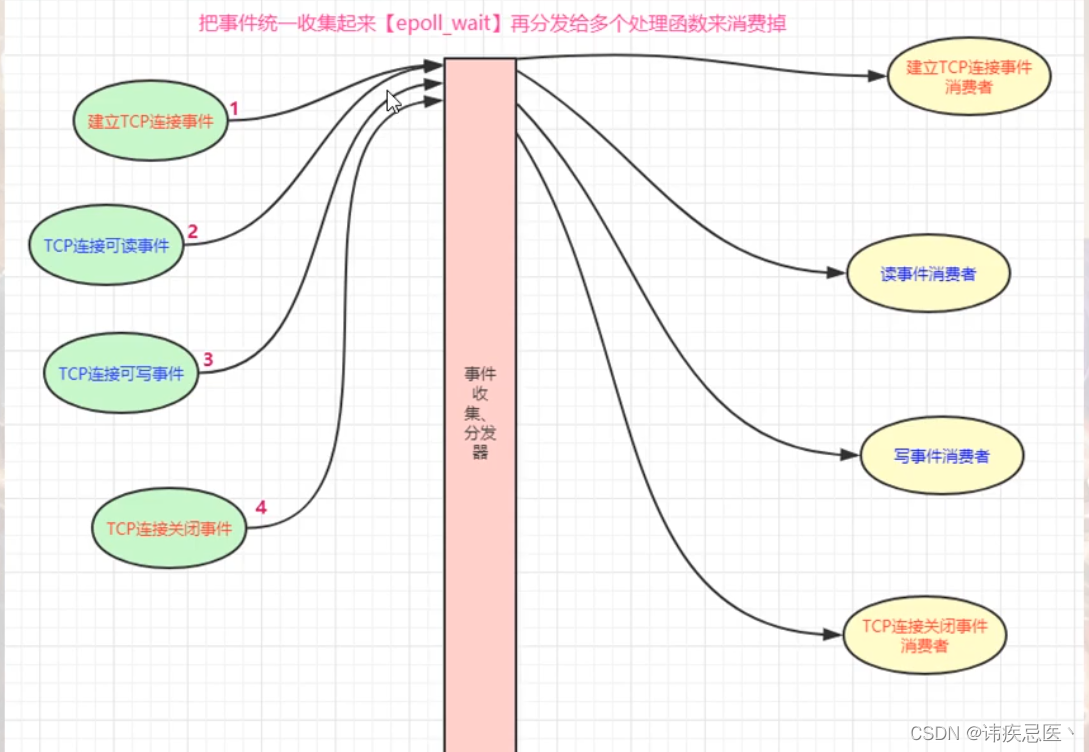
1.6 epoll实战使用
文章目录1、连接池2、epoll两种工作模式2.1、LT模式2.2、ET模式3、后端开发面试题4、epoll验证1、连接池 将每一个套接字和一块内存进行绑定,连接池就是一个结构体数组,通过链表来维护一个空闲连接。 1、ngx_get_connection(int fd)从空闲链表取一个空闲…...

JDK定时、Spring定时、时间轮定时小结
Timer使用一个线程,一个小根堆。线程执行根上的任务,小根堆会根据执行时间戳重新调整,根上的任务是下一个执行的任务。 DelayedQueue维护一个优先级队列,本质也是一个数组方式的堆。任务生成时也有时间戳,只提供存储。…...
关于cFosSpeed如何配置
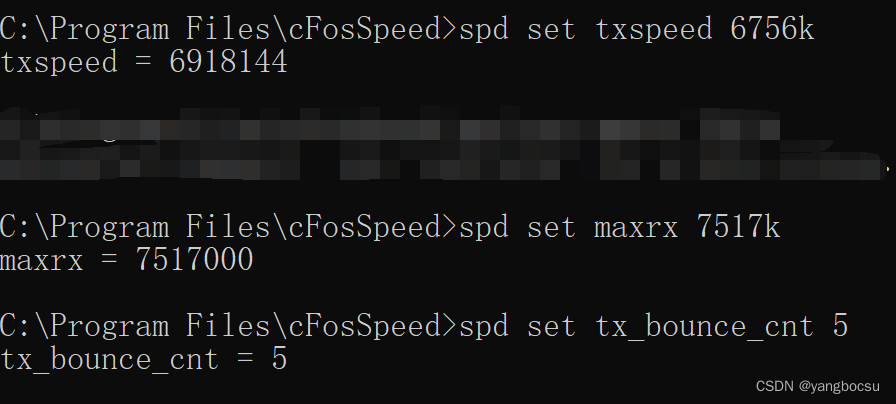
cFosSpeed配置一、检查Calibration Done情况二、优化Ping时间和线路校准三、测网速四、cFosSpeed控制台五、配置参数一、检查Calibration Done情况 安装完毕,激活成功后。 右键------>选项------>设置, 打开适配器信息,查看Calibra…...
YOLOV5输出的txt里面有什么猫腻(用于图像分类竞赛中提升图像信息密度)
背景概括: kaggle最近举办了一场医学乳腺癌检测的比赛(图像分类) 比赛官网地址 给的数据是dcm的专业的医学格式,自己通过DICOM库转为png后,发现该图像胸部不同的患者乳腺大小不一,简言之乳腺的CT有效图在…...

vue+axios常用操作
vueaxios常用操作vue2axios请求拦截依赖项http.jsvue2axios设置请求头依赖项http.js获取并设置请求头api.jsa.vuevue2axios请求拦截 依赖项 “vue”: “^2.6.11” “axios”: “^0.21.0” “element-ui”: “^2.13.2”(做弹窗提示,可以不用) http.js // 引入axi…...
Xshell连接阿里云服务器搭建网站
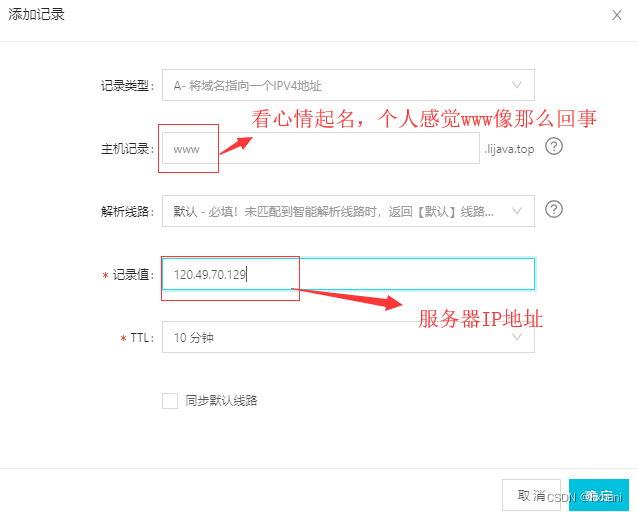
一、建设一个网站的基本要求 申请一个独立的域名申请一台云服务器ECS在服务器上安装网站环境,如:Apache发布网站内容至云服务器将第一步注册的域解析至云服务器的外网IP地址进行ICP备案 二、用户访问网站的过程 在浏览器上输入域名浏览器自动调用DNS&…...
嵌入式ARM设计编程(三) 处理器工作模式
文章和代码已归档至【Github仓库:hardware-tutorial】,需要的朋友们自取。或者公众号【AIShareLab】回复 嵌入式 也可获取。 一、实验目的 (1) 通过实验掌握学会使用msr/mrs 指令实现ARM 处理器工作模式的切换,观察不…...
jenkins构建报错:.java:16: error: package javafx.util does not exist
1、报错 jenkins构建报错 package javafx.util does not exist2、报错原因 代码发现使用了javafx类,该类仅存在OracleJDK中,OpenJDK中没有该类。 jenkins服务器安装的是openjdk 3、卸载OpenJDK 具体不概述了 4、离线安装OracleJDK 1)…...
【第三天】策略模式
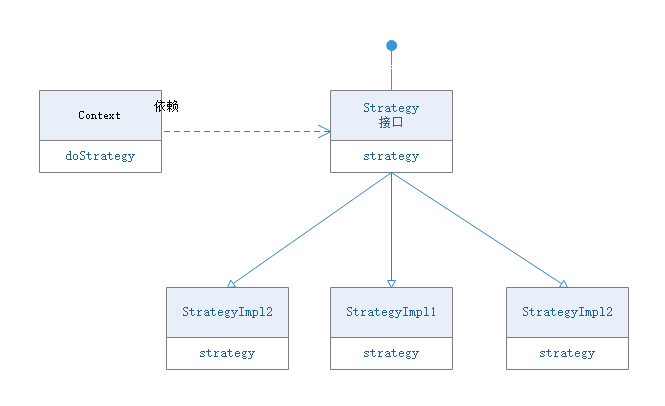
前言 策略模式是针对不同算法给出不同实现的方式,解耦代码,减少代码中if.....else代码书写量。 一、策略模式UNL类图 对象角色Context 上下文对象,依赖Strategy接口,一般像Context传入Strategy实现对象,执行策略方法…...
以应用为导向,看声纹识别中的音频伪造问题
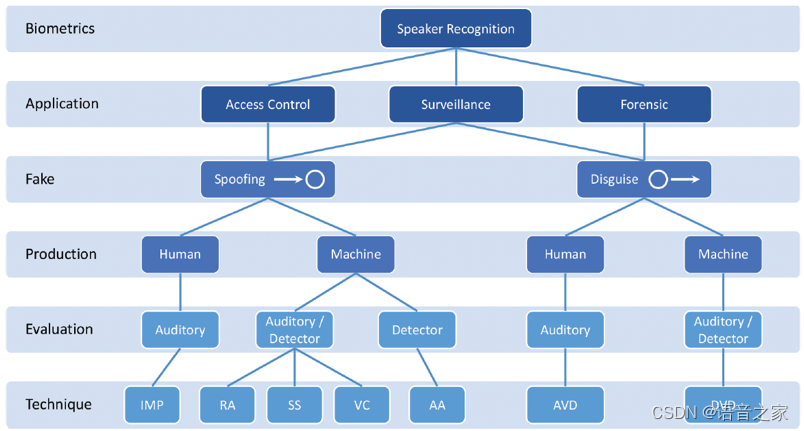
声纹识别,又称说话人识别,是根据语音信号中的声纹特征来识别话者身份的过程,也是一种重要的生物认证手段。历经几十年的研究,当前声纹识别系统已取得了令人满意的性能表现,并在安防、司法、金融、家居等诸多领域中完成…...

Three.js模型加载太慢?试试这个gltf-pipeline压缩技巧,亲测有效!
Three.js模型加载优化实战:gltf-pipeline压缩技巧详解 在Web 3D开发中,Three.js无疑是构建沉浸式体验的首选工具之一。然而,随着3D模型复杂度的提升,文件体积膨胀导致的加载延迟成为开发者面临的普遍挑战。想象一下,用…...

Go语言的gRPC服务开发
Go语言的gRPC服务开发 1. gRPC简介 gRPC是Google开发的高性能、开源的RPC框架,基于HTTP/2协议和Protocol Buffers序列化格式。它支持多种语言,包括Go、Java、C、Python等,非常适合构建微服务架构。 gRPC的优势 高性能:基于HTTP/2协…...

从选题到发布全托管:我用OpenClaw搭建了个人自媒体AI流水线
一、引言:内容创作者的普遍痛点 作为技术博主,相信很多人都遇到过这些问题: 选题焦虑:每天花1-2小时刷各大平台找热点,不知道写什么内容读者喜欢效率低下:写一篇技术文章需要查资料、写内容、排版、配图、同…...

抖音视频批量下载工具全攻略:从效率提升到合规应用
抖音视频批量下载工具全攻略:从效率提升到合规应用 【免费下载链接】douyin-downloader A practical Douyin downloader for both single-item and profile batch downloads, with progress display, retries, SQLite deduplication, and browser fallback support.…...

快马AI五分钟搭建Node.js服务器原型,验证你的后端想法
最近在验证一个后端服务的想法时,发现从零开始搭建服务器环境特别耗时。经过一番探索,发现用InsCode(快马)平台可以快速生成可运行的Node.js服务器原型,整个过程比想象中简单很多。这里记录下具体实现思路和操作过程,给有类似需求…...

OpenClaw进阶配置:千问3.5-9B模型参数调优全解析
OpenClaw进阶配置:千问3.5-9B模型参数调优全解析 1. 为什么需要调优模型参数? 上周我在用OpenClaw自动处理一批技术文档时遇到了奇怪的现象:同样的任务指令,有时能完美执行,有时却会漏掉关键步骤。经过两天排查&…...

效率倍增,用快马AI一键生成数据库批量备份与巡检脚本
破解版安装太折腾?用快马AI一键生成数据库运维脚本提升效率 最近接手了一个需要管理多个MySQL数据库的项目,日常的备份、巡检和测试数据准备成了头疼的问题。手动操作不仅效率低,还容易出错。更糟的是,团队里有人为了图方便用了破…...

基于DSP28335的CAN升级方案:自主开发的BootLoader与上位机完全支持
基于dsp28335的can升级方案 bootloader、上位机等全部自主开发 文件说明: 1、setup为上位机安装文件; 2、V5为dsp28335的BootLoader源代码,我用的CCS10.3.1; 3、WindowsApplication3为VS平台的上位机源代码,我用的VS2013ÿ…...

嵌入式开发知识管理:基于BERT文本分割的STM32项目文档整理
嵌入式开发知识管理:基于BERT文本分割的STM32项目文档整理 每次接手一个老旧的STM32项目,你是不是也感到头疼?打开工程文件夹,里面混杂着各种版本的代码、零散的调试日志、不同工程师留下的注释,还有一堆硬件连接说明…...

如何用AutoUnipus彻底改变你的U校园学习工作流:2025全新范式
如何用AutoUnipus彻底改变你的U校园学习工作流:2025全新范式 【免费下载链接】AutoUnipus U校园脚本,支持全自动答题,百分百正确 2024最新版 项目地址: https://gitcode.com/gh_mirrors/au/AutoUnipus 还在为U校园平台的繁重复习任务而困扰吗?每天…...