echarts饼图封装
1. 组件
<template>
<div
:id="id"
class="main"
:style="{ width: width, height: height }"
:ref="id"
></div>
</template>
<script>
import * as echarts from "echarts";
export default {
name: "roseChart",
data() {
return {
myEchart: null,
};
},
props: {
width: {
type: String,
default: "100%",
},
height: {
type: String,
default: "100%",
},
// 数据(数组)
typeAnalysisData: {
type: Array,
default: () => [],
},
id: {
type: String,
default: "roseChart",
},
// 是否显示提示(方框)
legendShow: {
type: Boolean,
default: true,
},
// 上面距离
legendTop: {
type: String,
default: "auto",
},
// 左面距离
legendLeft: {
type: String,
default: "auto",
},
// 排列方式
legendOrient: {
type: String,
default: "vertical",
},
// 字体颜色(方框)
legendColor: {
type: String,
default: "#8493c3",
},
// 字体大小(方框)
legendFontSize: {
type: String,
default: "16px",
},
titleFontSize: {
type: Number,
default: 34,
},
titleColor: {
type: String,
default: "#8493c3",
},
// 饼图的半径
radius: {
type: Array,
default: () => [],
},
// 文本标签
labelShow: {
type: Boolean,
default: true,
},
labelPosition: {
type: String,
default: "center",
},
// 文本字体大小
labelFontSize: {
type: Number,
default: 14,
},
// 文本字体行高
lineHeight: {
type: Number,
default: 15,
},
// 文本字体颜色
labelColor: {
type: String,
default: "#8493c3",
},
activeFontSize: {
type: Number,
default: 15,
},
activeColor: {
type: String,
default: "#8493c3",
},
// 中心
center: {
type: Array,
default: () => [],
},
// 标题
titleShow: {
type: Boolean,
default: true,
},
// 主标题
text: {
type: String,
default: "主标题",
},
// 副标题
subtext: {
type: String,
default: "副标题",
},
// 标题位置(上下)
titleTop: {
type: String,
default: "center",
},
// 标题位置(左右)
titleLeft: {
type: String,
default: "center",
},
},
methods: {
drawChart() {
let timer = null;
timer = setTimeout(() => {
if (
this.myEchart != null &&
this.myEchart != "" &&
this.myEchart != undefined
) {
this.myEchart.dispose(); //销毁
}
if (!this.$refs[this.id]) return;
this.myEchart = echarts.init(this.$refs[this.id]);
let option = {
title: {
show: this.titleShow,
// x: "44%", //X坐标
// y: "35%", //Y坐标
top: this.titleTop,
left: this.titleLeft,
text: this.text, //主标题
subtext: this.subtext, //副标题
textStyle: {
//标题样式
fontSize: 20,
fontWeight: "bolder",
color: "rgb(113, 116, 123)",
// formatter: "",
// marginTop: this.marginTop,
// marginLeft: this.marginLeft,
// transfrom: "translate(-50%,-50%)",
},
subtextStyle: {
//副标题样式
fontSize: 14,
fontWeight: "bolder",
color: "rgb(113, 116, 123)",
// transform: "translate(-50%,-50%)",
// marginTop: this.marginTop,
// marginLeft: this.marginLeft,
},
},
legend: {
show: this.legendShow,
orient: this.legendOrient,
top: this.legendTop,
left: this.legendLeft,
textStyle: {
color: this.legendColor,
fontSize: this.legendFontSize,
},
},
series: [
{
name: "Nightingale Chart",
type: "pie",
radius: this.radius,
center: this.center,
// roseType: "area",
itemStyle: {
normal: {
color: function (colors) {
var colorList = [
"rgb(250, 133, 133)",
"rgb(108, 200, 121)",
];
return colorList[colors.dataIndex];
},
borderRadius: 0,
},
},
label: {
show: this.labelShow,
alignTo: "edge",
formatter: "{name|{b}}\n{time|{d} %}",
minMargin: 5,
edgeDistance: 10,
lineHeight: this.lineHeight,
rich: {
time: {
fontSize: this.labelFontSize,
color: this.labelColor,
},
name: {
fontSize: this.labelFontSize,
color: this.labelColor,
},
},
},
labelLine: {
length: 15,
length2: 0,
maxSurfaceAngle: 80,
},
// label: {
// normal: {
// show: true,
// textStyle: {
// color: this.labelColor,
// fontSize: this.labelFontSize,
// },
// formatter: "{per|{d}%}",
// rich: {
// }
// },
// },
data: this.typeAnalysisData,
},
],
};
this.myEchart.setOption(option);
}, 500);
},
},
mounted() {
this.drawChart();
},
watch: {
typeAnalysisData: {
handler(newName, oldName) {
this.$nextTick(() => {
this.drawChart();
window.addEventListener("resize", this.drawChart);
});
},
deep: true,
},
},
destroyed() {
window.removeEventListener("resize", this.drawChart);
},
};
</script>
<style lang="scss" scoped>
</style>
2.内容
(1)标签
<rose-chart
:typeAnalysisData="dataList"
:color="color"
:labelShow="false"
:radius="radius"
:center="center"
legendLeft="right"
legendTop="middle"
></rose-chart>
(2)数据
// 饼状图
dataList: [
{ value: 1048, name: "异常设备" },
{ value: 735, name: "正常设备" },
],
color: ["#3c4a73", "#00a0e9", "#090", "#f00", "#f00"],
radius: ["50%", "60%"],
center: ["50%", "50%"],
相关文章:

echarts饼图封装
1. 组件 <template> <div :id"id" class"main" :style"{ width: width, height: height }" :ref"id" ></div> </template> <script> import * as echarts from "echarts"; export default { …...

Web3.0 教学基础一
目录 什么是web3.0 Web 1.0 概念 Web 2.0 概念 Web 3.0 概念 Web 3.0 的优势 什么是DAPP 什么是web3.0 在了解web3.0之前我们需要了解下前面的web1.0与web2.0。 Web 1.0 概念 Web1.0是万维网最初的版本,而静态网站则被认为是全网Web 1.0的起源,用…...

body使用渐变色无效的原因之一:html没有设置高度
直接在css文件中对body设置渐变色: body {height: 100%;background: -webkit-linear-gradient(120deg, #a1c4fd 0%, #c2e9fb 100%);background: -moz-linear-gradient(120deg, #a1c4fd 0%, #c2e9fb 100%);background: -o-linear-gradient(120deg, #a1c4fd 0%, #c2e…...
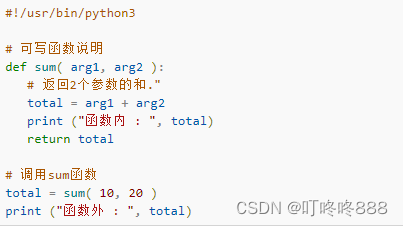
Python3 函数实例及演示
函数是组织好的,可重复使用的,用来实现单一,或相关联功能的代码段。 函数能提高应用的模块性,和代码的重复利用率。我们已经知道Python提供了许多内建函数,比如print()。但也可以自己创建函数,这被叫做用户…...
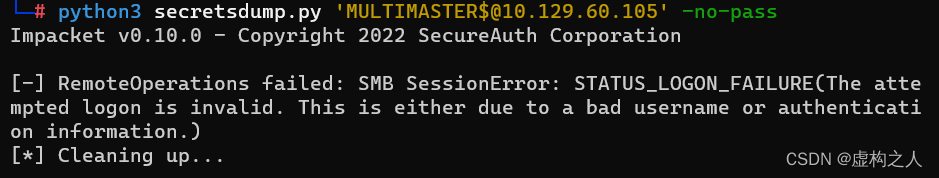
HTB打靶(Active Directory 101 Multimaster)
Nmap扫描 Starting Nmap 7.93 ( https://nmap.org ) at 2023-02-08 02:52 EST Stats: 0:00:51 elapsed; 0 hosts completed (1 up), 1 undergoing SYN Stealth Scan SYN Stealth Scan Timing: About 55.85% done; ETC: 02:54 (0:00:40 remaining) Nmap scan report for 10.129…...

漏洞预警|Apache Sling JCR Base 存在JNDI注入漏洞
棱镜七彩安全预警 近日网上有关于开源项目Apache Sling JCR Base 存在JNDI注入漏洞,棱镜七彩威胁情报团队第一时间探测到,经分析研判,向全社会发起开源漏洞预警公告,提醒相关安全团队及时响应。 项目介绍 Apache Sling是一个基于…...

【学习笔记】DFA的构造
虽然平时做过但是考场上肯定还是不会,不过没事干还是写一下吧 Myhill-Nerode\text{Myhill-Nerode}Myhill-Nerode 定理:给定一个语言LLL,定义在字符串上一个关系为,若对于所有的zzz,xzxzxz在LLL中当且仅当yzyzyz在LLL中…...
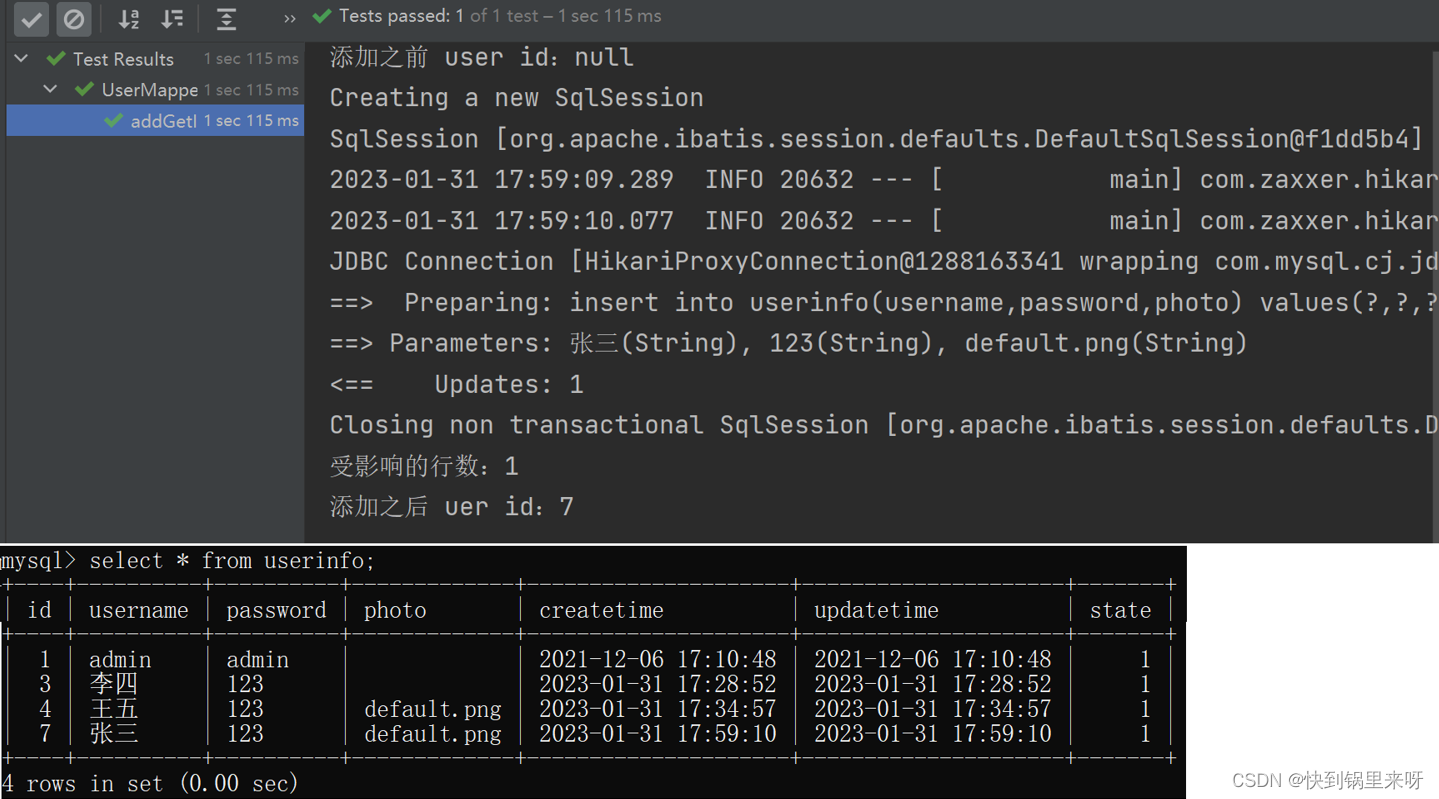
MyBatis 之二(增、删、改操作)
文章目录1. 修改操作1.1 在 mapper(interface)里面添加修改方法的声明1.2 在 XMl 中添加 <update> 标签和修改的 sql 代码1.3 在 UserMapper 中右键 Generate 点击 Test 生成 update 测试类2. 删除操作2.1 在 mapper (interface&#x…...

28k入职腾讯测试岗那天,我哭了,这5个月付出的一切总算没有白费~
先说一下自己的个人情况,计算机专业,16年普通二本学校毕业,经历过一些失败的工作经历后,经推荐就进入了华为的测试岗,进去才知道是接了个外包项目,不太稳定的样子,可是刚毕业谁知道什么外包不外…...
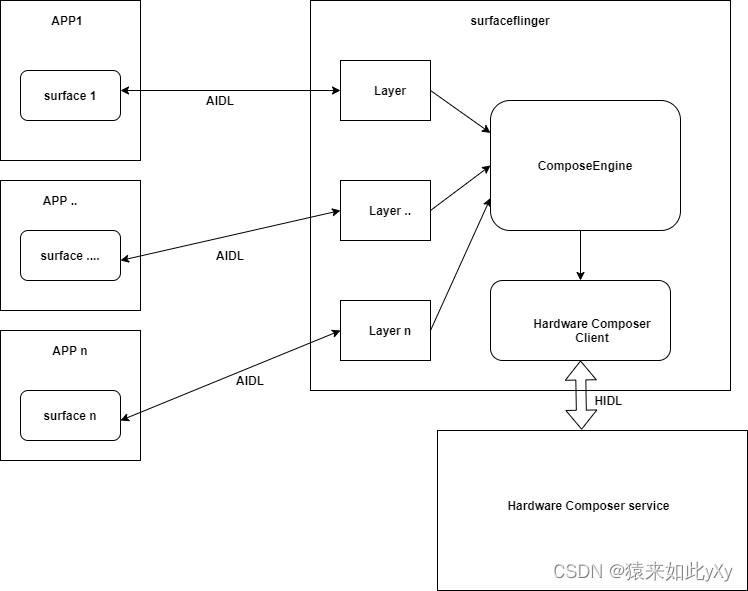
【surfaceflinger源码分析】surfaceflinger进程的消息驱动模型
概述 对于surfaceflinger大多数人都知道它的功能是做图形合成的,用英语表示就是指composite。其大致框图如下: 各个Android app将自己的图形画面通过surface为载体通过AIDL接口(Binder IPC)传递到surfaceflinger进程surfaceflinger进程中的composition engine与HW…...

「架构师」001计算机组成与体系结构
文章目录 前言一、计算机结构1.1 计算机组成结构1.2 CPU组成1.3 冯诺依曼结构与哈佛结构二、存储结构2.1 层次化存储结构2.2 Cache三、数据传输控制方式四、总线五、CISC与RISC六、流水线七、校验码八、嵌入式前言 本文主要介绍计算机组成与体系结构。 一、计算机结构 1.1 计…...
既然有HTTP协议,为什么还要有RPC
既然有HTTP协议,为什么还要有RPC? 从TCP聊起 作为一个程序员,假设我们需要在A电脑的进程发一段数据到B电脑的进程,我们一般会在代码里使用socket进行编程。 这时候,我们可选项一般也就TCP和UDP二选一。TCP可靠&…...
)
【新2023】华为OD机试 - 选座位(Python)
华为 OD 清单查看地址:blog.csdn.net/hihell/category_12199275.html 选座位 题目 疫情期间需要大家保证一定的社交距离 公司组织开交流会议,座位有一排共N个座位 编号分别为[0...n-1] 要求员工一个接着一个进入会议室 并且还可以在任何时候离开会议室 每当一个员工进入时…...
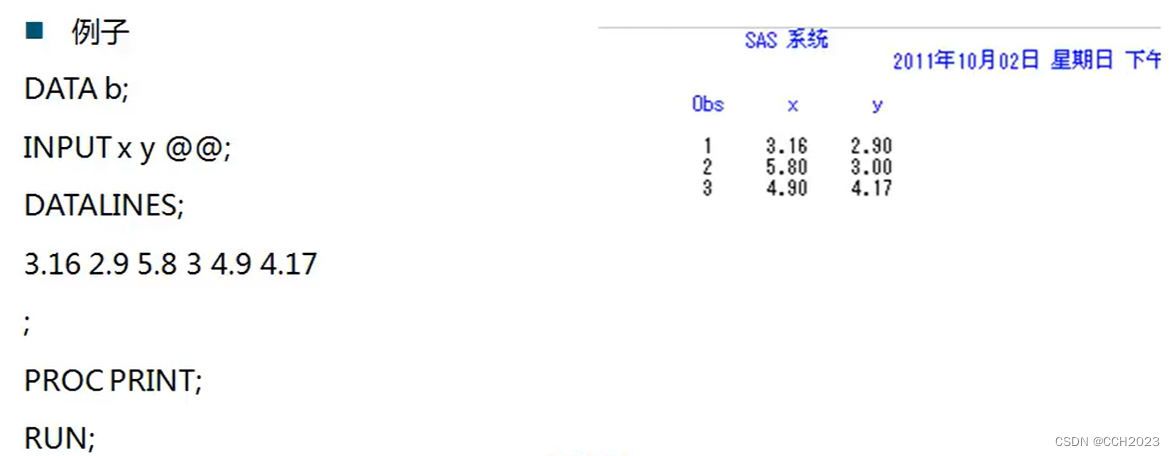
数据分析与SAS学习笔记4
INPUT语句:格式修饰符: “:” 修饰符。表示从下一个非空格列读入数据,直到:1 遇到再下一个空格列; 2 读到预先定义的变量长度; 3 数据行结束。哪个先出现就在哪儿结束。 “&” 修饰符。表示从下一个非空格列读入…...

Xepor:一款针对逆向工程和安全分析的Web路由框架
关于Xepor Xepor是一款专为逆向分析工程师和安全研究专家设计的Web路由框架,该工具可以为研究人员提供类似Flask API的功能,支持以人类友好的方式拦截和修改HTTP请求或HTTP响应信息。 该项目需要与mitmproxy一起结合使用,用户可以使用Xepor…...
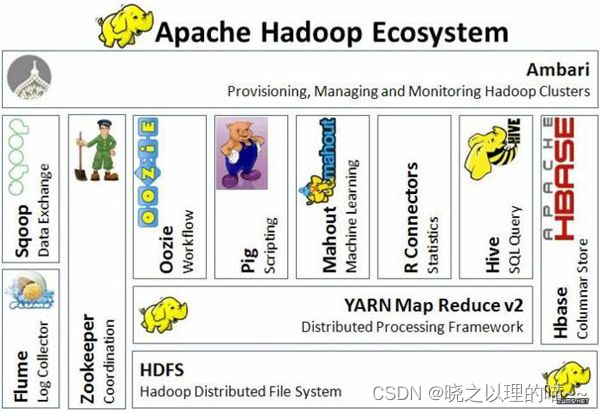
Hadoop核心组成和生态系统简介
一、Hadoop的概念 Hadoop是一个由Apache基金会所开发的分布式系统基础架构。用户可以在不了解分布式底层细节的情况下,开发分布式程序。充分利用集群的威力进行高速运算和存储。Hadoop实现了一个分布式文件系统( Distributed File System)&am…...
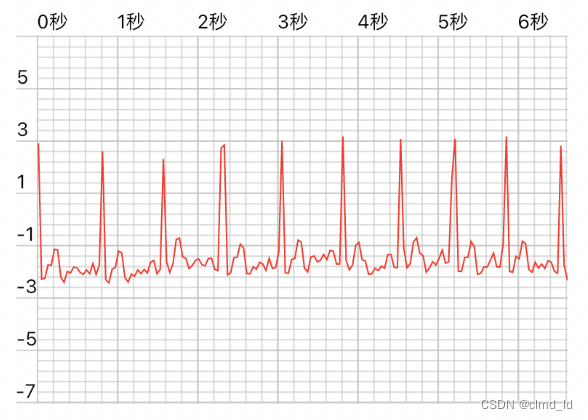
Flutter-Charts_painter大数据量绘制性能优化-数据收敛
Flutter-Charts_painter大数据量绘制性能优化-数据收敛 1、背景介绍 HRV测量仪器上传的数据,每秒有250个数据,业务上需要测量180秒,预计有3w-5w个数据点需要绘制到折线图上去。Charts_painter绘制这么大的数据是时候会有些卡顿,…...

使用 GeForce Experience 更新 NVIDIA GPU 显卡驱动
使用 GeForce Experience 更新 NVIDIA GPU 显卡驱动1. NVIDIA GeForce Experience 2. 驱动程序 -> 检查更新文件 3. 下载 如果有可用的新版驱动的话,点击后方的 [下载] 按钮即可。 4. 安装 [快速安装] 按照默认设置安装驱动,[自定义安装] 可以自行…...

Java泛型的<? super T>,<? extend T>的区别
? extends T ? extends T 描述了通配符上界, 即具体的泛型参数需要满足条件: 泛型参数必须是 T 类型或它的子类, 例如: List<? extends Number> numberArray new ArrayList<Number>(); // Number 是 Number 类型的 List<? extends Number>…...

如何做出好看的Excel可视化图表?
可视化死磕excel是不行的,作为数据分析行业的偷懒大户,分享一些我在可视化工具上的使用心得,总结了三大类:快速出图类、专业图表类、高端大屏类。个人经验,大家按需采纳: 一、快速出图类 如果你只是因为偶…...

无机布防火卷帘门报价透明,包工包料,一次说清所有费用
很多客户在选购无机布防火卷帘门时,最关心实际成交价格,也担心报价不清晰,后期产生各类额外支出。行业内产品定价参差不齐,选材做工不同,最终价位自然存在差距,挑选时不能只看表面低价。 👉 点击…...

从分立逻辑到单片机:基于ATmega8的MIDI通道分析仪设计与实现
1. 项目概述:从分立逻辑到单片机的MIDI通道分析仪进化史二十年前,当我在《Elektor》杂志上发表第一版MIDI通道分析仪时,整个数字音乐世界还处于一个相当“硬核”的阶段。那个版本的设计,用今天的话来说,简直就是一场“…...

NHSE终极教程:5分钟掌握动物森友会存档编辑技巧
NHSE终极教程:5分钟掌握动物森友会存档编辑技巧 【免费下载链接】NHSE Animal Crossing: New Horizons save editor 项目地址: https://gitcode.com/gh_mirrors/nh/NHSE 还在为《集合啦!动物森友会》的收集烦恼吗?想快速打造梦想岛屿却…...

基于PIC32单片机实现Android USB音频转SPDIF输出的DIY方案
1. 项目概述:为Android设备打造一个高保真SPDIF音频接口作为一名长期折腾嵌入式音频和家庭影院的玩家,我经常遇到一个痛点:手头那些性能不错的Android手机或平板,其内置的3.5mm耳机孔或者USB-C口的音频输出质量,在连接…...

基于Atmega 1284P的16位复古计算器:硬件设计与软件实现全解析
1. 项目概述与核心思路最近在整理工作室时,翻出了一堆老旧的7段数码管和矩阵键盘,看着这些充满复古气息的元件,一个想法冒了出来:为什么不自己动手做一台复古风格的计算器呢?不是那种用液晶屏显示的现代计算器…...

收藏干货|2026 版双非零基础入局大模型开发,RAG 与 Agent 就业上岸全攻略
日常总能收到不少初学伙伴的私信,大家普遍都有同一个疑惑:二本及普通院校学历,零基础入门 RAG、Agent 大模型应用开发,究竟能不能顺利入职?行业后续发展前景又如何? 本篇 2026 年全新内容,不空谈…...

终极指南:三步搞定Windows系统安卓APK文件安装,告别模拟器时代
终极指南:三步搞定Windows系统安卓APK文件安装,告别模拟器时代 【免费下载链接】APK-Installer An Android Application Installer for Windows 项目地址: https://gitcode.com/GitHub_Trending/ap/APK-Installer 还在为电脑无法直接运行手机应用…...

Safe Exam Browser虚拟机绕过实战:深度解析与安全研究指南
Safe Exam Browser虚拟机绕过实战:深度解析与安全研究指南 【免费下载链接】safe-exam-browser-bypass A VM and display detection bypass for SEB. 项目地址: https://gitcode.com/gh_mirrors/sa/safe-exam-browser-bypass 在数字化教育快速发展的今天&…...

LeetCode 80 · 删除有序数组中的重复项 II:通用模板的威力
LeetCode 26 要求每个元素最多出现一次,这道题放宽到最多出现两次。看起来只是把 1 改成了 2,但这个"小改动"背后藏着一个通用的快慢指针模板——把 2 换成任意整数 m,代码几乎不用动。这就是模板的威力:改一个数字&…...

PlayAI实时翻译如何重构跨国协作效率?揭秘2024企业级应用的3个关键转折点
更多请点击: https://codechina.net 第一章:PlayAI实时翻译如何重构跨国协作效率?揭秘2024企业级应用的3个关键转折点 在远程办公常态化与全球供应链深度耦合的背景下,PlayAI 实时翻译已从辅助工具跃升为协同基础设施。其核心突破…...