Qt QCustomPlot介绍
介绍
主要介绍qcustomplot及其用法
最新版本:QCustomPlot Patch Release 2.1.1//November 6, 2022
下载:https://www.qcustomplot.com/index.php/download
官网:https://www.qcustomplot.com/index.php
简单使用
mainwindow.h
/***************************************************************************
**                                                                        **
**  QCustomPlot, an easy to use, modern plotting widget for Qt            **
**  Copyright (C) 2011-2022 Emanuel Eichhammer                            **
**                                                                        **
**  This program is free software: you can redistribute it and/or modify  **
**  it under the terms of the GNU General Public License as published by  **
**  the Free Software Foundation, either version 3 of the License, or     **
**  (at your option) any later version.                                   **
**                                                                        **
**  This program is distributed in the hope that it will be useful,       **
**  but WITHOUT ANY WARRANTY; without even the implied warranty of        **
**  MERCHANTABILITY or FITNESS FOR A PARTICULAR PURPOSE.  See the         **
**  GNU General Public License for more details.                          **
**                                                                        **
**  You should have received a copy of the GNU General Public License     **
**  along with this program.  If not, see http://www.gnu.org/licenses/.   **
**                                                                        **
****************************************************************************
**           Author: Emanuel Eichhammer                                   **
**  Website/Contact: https://www.qcustomplot.com/                         **
**             Date: 06.11.22                                             **
**          Version: 2.1.1                                                **
****************************************************************************//************************************************************************************************************
**                                                                                                         **
**  This is the example code for QCustomPlot.                                                              **
**                                                                                                         **
**  It demonstrates basic and some advanced capabilities of the widget. The interesting code is inside     **
**  the "setup(...)Demo" functions of MainWindow.                                                          **
**                                                                                                         **
**  In order to see a demo in action, call the respective "setup(...)Demo" function inside the             **
**  MainWindow constructor. Alternatively you may call setupDemo(i) where i is the index of the demo       **
**  you want (for those, see MainWindow constructor comments). All other functions here are merely a       **
**  way to easily create screenshots of all demos for the website. I.e. a timer is set to successively     **
**  setup all the demos and make a screenshot of the window area and save it in the ./screenshots          **
**  directory.                                                                                             **
**                                                                                                         **
*************************************************************************************************************/#ifndef MAINWINDOW_H
#define MAINWINDOW_H#include <QMainWindow>
#include <QTimer>
#include "../../qcustomplot.h" // the header file of QCustomPlot. Don't forget to add it to your project, if you use an IDE, so it gets compiled.namespace Ui {
class MainWindow;
}class MainWindow : public QMainWindow
{Q_OBJECTpublic:explicit MainWindow(QWidget *parent = 0);~MainWindow();void setupDemo(int demoIndex);void setupQuadraticDemo(QCustomPlot *customPlot);void setupSimpleDemo(QCustomPlot *customPlot);void setupSincScatterDemo(QCustomPlot *customPlot);void setupScatterStyleDemo(QCustomPlot *customPlot);void setupLineStyleDemo(QCustomPlot *customPlot);void setupScatterPixmapDemo(QCustomPlot *customPlot);void setupDateDemo(QCustomPlot *customPlot);void setupTextureBrushDemo(QCustomPlot *customPlot);void setupMultiAxisDemo(QCustomPlot *customPlot);void setupLogarithmicDemo(QCustomPlot *customPlot);void setupRealtimeDataDemo(QCustomPlot *customPlot);void setupParametricCurveDemo(QCustomPlot *customPlot);void setupBarChartDemo(QCustomPlot *customPlot);void setupStatisticalDemo(QCustomPlot *customPlot);void setupSimpleItemDemo(QCustomPlot *customPlot);void setupItemDemo(QCustomPlot *customPlot);void setupStyledDemo(QCustomPlot *customPlot);void setupAdvancedAxesDemo(QCustomPlot *customPlot);void setupColorMapDemo(QCustomPlot *customPlot);void setupFinancialDemo(QCustomPlot *customPlot);void setupPolarPlotDemo(QCustomPlot *customPlot);void setupPlayground(QCustomPlot *customPlot);private slots:void realtimeDataSlot();void bracketDataSlot();void screenShot();void allScreenShots();private:Ui::MainWindow *ui;QString demoName;QTimer dataTimer;QCPItemTracer *itemDemoPhaseTracer;int currentDemoIndex;
};#endif // MAINWINDOW_H
mainwindow.cpp
/***************************************************************************
**                                                                        **
**  QCustomPlot, an easy to use, modern plotting widget for Qt            **
**  Copyright (C) 2011-2022 Emanuel Eichhammer                            **
**                                                                        **
**  This program is free software: you can redistribute it and/or modify  **
**  it under the terms of the GNU General Public License as published by  **
**  the Free Software Foundation, either version 3 of the License, or     **
**  (at your option) any later version.                                   **
**                                                                        **
**  This program is distributed in the hope that it will be useful,       **
**  but WITHOUT ANY WARRANTY; without even the implied warranty of        **
**  MERCHANTABILITY or FITNESS FOR A PARTICULAR PURPOSE.  See the         **
**  GNU General Public License for more details.                          **
**                                                                        **
**  You should have received a copy of the GNU General Public License     **
**  along with this program.  If not, see http://www.gnu.org/licenses/.   **
**                                                                        **
****************************************************************************
**           Author: Emanuel Eichhammer                                   **
**  Website/Contact: https://www.qcustomplot.com/                         **
**             Date: 06.11.22                                             **
**          Version: 2.1.1                                                **
****************************************************************************//************************************************************************************************************
**                                                                                                         **
**  This is the example code for QCustomPlot.                                                              **
**                                                                                                         **
**  It demonstrates basic and some advanced capabilities of the widget. The interesting code is inside     **
**  the "setup(...)Demo" functions of MainWindow.                                                          **
**                                                                                                         **
**  In order to see a demo in action, call the respective "setup(...)Demo" function inside the             **
**  MainWindow constructor. Alternatively you may call setupDemo(i) where i is the index of the demo       **
**  you want (for those, see MainWindow constructor comments). All other functions here are merely a       **
**  way to easily create screenshots of all demos for the website. I.e. a timer is set to successively     **
**  setup all the demos and make a screenshot of the window area and save it in the ./screenshots          **
**  directory.                                                                                             **
**                                                                                                         **
*************************************************************************************************************/#include "mainwindow.h"
#include "ui_mainwindow.h"
#include <QDebug>
#if QT_VERSION < QT_VERSION_CHECK(6, 0, 0)
#  include <QDesktopWidget>
#endif
#include <QScreen>
#include <QMessageBox>
#include <QMetaEnum>MainWindow::MainWindow(QWidget *parent) :QMainWindow(parent),ui(new Ui::MainWindow)
{ui->setupUi(this);setGeometry(400, 250, 542, 390);setupDemo(0);//setupPlayground(ui->customPlot);// 0:  setupQuadraticDemo(ui->customPlot);// 1:  setupSimpleDemo(ui->customPlot);// 2:  setupSincScatterDemo(ui->customPlot);// 3:  setupScatterStyleDemo(ui->customPlot);// 4:  setupScatterPixmapDemo(ui->customPlot);// 5:  setupLineStyleDemo(ui->customPlot);// 6:  setupDateDemo(ui->customPlot);// 7:  setupTextureBrushDemo(ui->customPlot);// 8:  setupMultiAxisDemo(ui->customPlot);// 9:  setupLogarithmicDemo(ui->customPlot);// 10: setupRealtimeDataDemo(ui->customPlot);// 11: setupParametricCurveDemo(ui->customPlot);// 12: setupBarChartDemo(ui->customPlot);// 13: setupStatisticalDemo(ui->customPlot);// 14: setupSimpleItemDemo(ui->customPlot);// 15: setupItemDemo(ui->customPlot);// 16: setupStyledDemo(ui->customPlot);// 17: setupAdvancedAxesDemo(ui->customPlot);// 18: setupColorMapDemo(ui->customPlot);// 19: setupFinancialDemo(ui->customPlot);// 20: setupPolarPlotDemo(ui->customPlot);// for making screenshots of the current demo or all demos (for website screenshots)://QTimer::singleShot(1500, this, SLOT(allScreenShots()));//QTimer::singleShot(4000, this, SLOT(screenShot()));
}void MainWindow::setupDemo(int demoIndex)
{switch (demoIndex){case 0:  setupQuadraticDemo(ui->customPlot); break;case 1:  setupSimpleDemo(ui->customPlot); break;case 2:  setupSincScatterDemo(ui->customPlot); break;case 3:  setupScatterStyleDemo(ui->customPlot); break;case 4:  setupScatterPixmapDemo(ui->customPlot); break;case 5:  setupLineStyleDemo(ui->customPlot); break;case 6:  setupDateDemo(ui->customPlot); break;case 7:  setupTextureBrushDemo(ui->customPlot); break;case 8:  setupMultiAxisDemo(ui->customPlot); break;case 9:  setupLogarithmicDemo(ui->customPlot); break;case 10: setupRealtimeDataDemo(ui->customPlot); break;case 11: setupParametricCurveDemo(ui->customPlot); break;case 12: setupBarChartDemo(ui->customPlot); break;case 13: setupStatisticalDemo(ui->customPlot); break;case 14: setupSimpleItemDemo(ui->customPlot); break;case 15: setupItemDemo(ui->customPlot); break;case 16: setupStyledDemo(ui->customPlot); break;case 17: setupAdvancedAxesDemo(ui->customPlot); break;case 18: setupColorMapDemo(ui->customPlot); break;case 19: setupFinancialDemo(ui->customPlot); break;case 20: setupPolarPlotDemo(ui->customPlot); break;}setWindowTitle("QCustomPlot: "+demoName);statusBar()->clearMessage();currentDemoIndex = demoIndex;ui->customPlot->replot();
}void MainWindow::setupQuadraticDemo(QCustomPlot *customPlot)
{demoName = "Quadratic Demo";// generate some data:QVector<double> x(101), y(101); // initialize with entries 0..100for (int i=0; i<101; ++i){x[i] = i/50.0 - 1; // x goes from -1 to 1y[i] = x[i]*x[i];  // let's plot a quadratic function}// create graph and assign data to it:customPlot->addGraph();customPlot->graph(0)->setData(x, y);// give the axes some labels:customPlot->xAxis->setLabel("x");customPlot->yAxis->setLabel("y");// set axes ranges, so we see all data:customPlot->xAxis->setRange(-1, 1);customPlot->yAxis->setRange(0, 1);
}void MainWindow::setupSimpleDemo(QCustomPlot *customPlot)
{demoName = "Simple Demo";// add two new graphs and set their look:customPlot->addGraph();customPlot->graph(0)->setPen(QPen(Qt::blue)); // line color blue for first graphcustomPlot->graph(0)->setBrush(QBrush(QColor(0, 0, 255, 20))); // first graph will be filled with translucent bluecustomPlot->addGraph();customPlot->graph(1)->setPen(QPen(Qt::red)); // line color red for second graph// generate some points of data (y0 for first, y1 for second graph):QVector<double> x(251), y0(251), y1(251);for (int i=0; i<251; ++i){x[i] = i;y0[i] = qExp(-i/150.0)*qCos(i/10.0); // exponentially decaying cosiney1[i] = qExp(-i/150.0);              // exponential envelope}// configure right and top axis to show ticks but no labels:// (see QCPAxisRect::setupFullAxesBox for a quicker method to do this)customPlot->xAxis2->setVisible(true);customPlot->xAxis2->setTickLabels(false);customPlot->yAxis2->setVisible(true);customPlot->yAxis2->setTickLabels(false);// make left and bottom axes always transfer their ranges to right and top axes:connect(customPlot->xAxis, SIGNAL(rangeChanged(QCPRange)), customPlot->xAxis2, SLOT(setRange(QCPRange)));connect(customPlot->yAxis, SIGNAL(rangeChanged(QCPRange)), customPlot->yAxis2, SLOT(setRange(QCPRange)));// pass data points to graphs:customPlot->graph(0)->setData(x, y0);customPlot->graph(1)->setData(x, y1);// let the ranges scale themselves so graph 0 fits perfectly in the visible area:customPlot->graph(0)->rescaleAxes();// same thing for graph 1, but only enlarge ranges (in case graph 1 is smaller than graph 0):customPlot->graph(1)->rescaleAxes(true);// Note: we could have also just called customPlot->rescaleAxes(); instead// Allow user to drag axis ranges with mouse, zoom with mouse wheel and select graphs by clicking:customPlot->setInteractions(QCP::iRangeDrag | QCP::iRangeZoom | QCP::iSelectPlottables);
}void MainWindow::setupSincScatterDemo(QCustomPlot *customPlot)
{demoName = "Sinc Scatter Demo";customPlot->legend->setVisible(true);customPlot->legend->setFont(QFont("Helvetica",9));// set locale to english, so we get english decimal separator:customPlot->setLocale(QLocale(QLocale::English, QLocale::UnitedKingdom));// add confidence band graphs:customPlot->addGraph();QPen pen;pen.setStyle(Qt::DotLine);pen.setWidth(1);pen.setColor(QColor(180,180,180));customPlot->graph(0)->setName("Confidence Band 68%");customPlot->graph(0)->setPen(pen);customPlot->graph(0)->setBrush(QBrush(QColor(255,50,30,20)));customPlot->addGraph();customPlot->legend->removeItem(customPlot->legend->itemCount()-1); // don't show two confidence band graphs in legendcustomPlot->graph(1)->setPen(pen);customPlot->graph(0)->setChannelFillGraph(customPlot->graph(1));// add theory curve graph:customPlot->addGraph();pen.setStyle(Qt::DashLine);pen.setWidth(2);pen.setColor(Qt::red);customPlot->graph(2)->setPen(pen);customPlot->graph(2)->setName("Theory Curve");// add data point graph:customPlot->addGraph();customPlot->graph(3)->setPen(QPen(Qt::blue));customPlot->graph(3)->setName("Measurement");customPlot->graph(3)->setLineStyle(QCPGraph::lsNone);customPlot->graph(3)->setScatterStyle(QCPScatterStyle(QCPScatterStyle::ssCross, 4));// add error bars:QCPErrorBars *errorBars = new QCPErrorBars(customPlot->xAxis, customPlot->yAxis);errorBars->removeFromLegend();errorBars->setAntialiased(false);errorBars->setDataPlottable(customPlot->graph(3));errorBars->setPen(QPen(QColor(180,180,180)));// generate ideal sinc curve data and some randomly perturbed data for scatter plot:QVector<double> x0(250), y0(250);QVector<double> yConfUpper(250), yConfLower(250);for (int i=0; i<250; ++i){x0[i] = (i/249.0-0.5)*30+0.01; // by adding a small offset we make sure not do divide by zero in next code liney0[i] = qSin(x0[i])/x0[i]; // sinc functionyConfUpper[i] = y0[i]+0.15;yConfLower[i] = y0[i]-0.15;x0[i] *= 1000;}QVector<double> x1(50), y1(50), y1err(50);for (int i=0; i<50; ++i){// generate a gaussian distributed random number:double tmp1 = rand()/(double)RAND_MAX;double tmp2 = rand()/(double)RAND_MAX;double r = qSqrt(-2*qLn(tmp1))*qCos(2*M_PI*tmp2); // box-muller transform for gaussian distribution// set y1 to value of y0 plus a random gaussian pertubation:x1[i] = (i/50.0-0.5)*30+0.25;y1[i] = qSin(x1[i])/x1[i]+r*0.15;x1[i] *= 1000;y1err[i] = 0.15;}// pass data to graphs and let QCustomPlot determine the axes ranges so the whole thing is visible:customPlot->graph(0)->setData(x0, yConfUpper);customPlot->graph(1)->setData(x0, yConfLower);customPlot->graph(2)->setData(x0, y0);customPlot->graph(3)->setData(x1, y1);errorBars->setData(y1err);customPlot->graph(2)->rescaleAxes();customPlot->graph(3)->rescaleAxes(true);// setup look of bottom tick labels:customPlot->xAxis->setTickLabelRotation(30);customPlot->xAxis->ticker()->setTickCount(9);customPlot->xAxis->setNumberFormat("ebc");customPlot->xAxis->setNumberPrecision(1);customPlot->xAxis->moveRange(-10);// make top right axes clones of bottom left axes. Looks prettier:customPlot->axisRect()->setupFullAxesBox();
}void MainWindow::setupScatterStyleDemo(QCustomPlot *customPlot)
{demoName = "Scatter Style Demo";customPlot->legend->setVisible(true);customPlot->legend->setFont(QFont("Helvetica", 9));customPlot->legend->setRowSpacing(-3);QVector<QCPScatterStyle::ScatterShape> shapes;shapes << QCPScatterStyle::ssCross;shapes << QCPScatterStyle::ssPlus;shapes << QCPScatterStyle::ssCircle;shapes << QCPScatterStyle::ssDisc;shapes << QCPScatterStyle::ssSquare;shapes << QCPScatterStyle::ssDiamond;shapes << QCPScatterStyle::ssStar;shapes << QCPScatterStyle::ssTriangle;shapes << QCPScatterStyle::ssTriangleInverted;shapes << QCPScatterStyle::ssCrossSquare;shapes << QCPScatterStyle::ssPlusSquare;shapes << QCPScatterStyle::ssCrossCircle;shapes << QCPScatterStyle::ssPlusCircle;shapes << QCPScatterStyle::ssPeace;shapes << QCPScatterStyle::ssCustom;QPen pen;// add graphs with different scatter styles:for (int i=0; i<shapes.size(); ++i){customPlot->addGraph();pen.setColor(QColor(qSin(i*0.3)*100+100, qSin(i*0.6+0.7)*100+100, qSin(i*0.4+0.6)*100+100));// generate data:QVector<double> x(10), y(10);for (int k=0; k<10; ++k){x[k] = k/10.0 * 4*3.14 + 0.01;y[k] = 7*qSin(x[k])/x[k] + (shapes.size()-i)*5;}customPlot->graph()->setData(x, y);customPlot->graph()->rescaleAxes(true);customPlot->graph()->setPen(pen);customPlot->graph()->setName(QCPScatterStyle::staticMetaObject.enumerator(QCPScatterStyle::staticMetaObject.indexOfEnumerator("ScatterShape")).valueToKey(shapes.at(i)));customPlot->graph()->setLineStyle(QCPGraph::lsLine);// set scatter style:if (shapes.at(i) != QCPScatterStyle::ssCustom){customPlot->graph()->setScatterStyle(QCPScatterStyle(shapes.at(i), 10));}else{QPainterPath customScatterPath;for (int i=0; i<3; ++i)customScatterPath.cubicTo(qCos(2*M_PI*i/3.0)*9, qSin(2*M_PI*i/3.0)*9, qCos(2*M_PI*(i+0.9)/3.0)*9, qSin(2*M_PI*(i+0.9)/3.0)*9, 0, 0);customPlot->graph()->setScatterStyle(QCPScatterStyle(customScatterPath, QPen(Qt::black, 0), QColor(40, 70, 255, 50), 10));}}// set blank axis lines:customPlot->rescaleAxes();customPlot->xAxis->setTicks(false);customPlot->yAxis->setTicks(false);customPlot->xAxis->setTickLabels(false);customPlot->yAxis->setTickLabels(false);// make top right axes clones of bottom left axes:customPlot->axisRect()->setupFullAxesBox();
}void MainWindow::setupLineStyleDemo(QCustomPlot *customPlot)
{demoName = "Line Style Demo";customPlot->legend->setVisible(true);customPlot->legend->setFont(QFont("Helvetica", 9));QPen pen;QStringList lineNames;lineNames << "lsNone" << "lsLine" << "lsStepLeft" << "lsStepRight" << "lsStepCenter" << "lsImpulse";// add graphs with different line styles:for (int i=QCPGraph::lsNone; i<=QCPGraph::lsImpulse; ++i){customPlot->addGraph();pen.setColor(QColor(qSin(i*1+1.2)*80+80, qSin(i*0.3+0)*80+80, qSin(i*0.3+1.5)*80+80));customPlot->graph()->setPen(pen);customPlot->graph()->setName(lineNames.at(i-QCPGraph::lsNone));customPlot->graph()->setLineStyle((QCPGraph::LineStyle)i);customPlot->graph()->setScatterStyle(QCPScatterStyle(QCPScatterStyle::ssCircle, 5));// generate data:QVector<double> x(15), y(15);for (int j=0; j<15; ++j){x[j] = j/15.0 * 5*3.14 + 0.01;y[j] = 7*qSin(x[j])/x[j] - (i-QCPGraph::lsNone)*5 + (QCPGraph::lsImpulse)*5 + 2;}customPlot->graph()->setData(x, y);customPlot->graph()->rescaleAxes(true);}// zoom out a bit:customPlot->yAxis->scaleRange(1.1, customPlot->yAxis->range().center());customPlot->xAxis->scaleRange(1.1, customPlot->xAxis->range().center());// set blank axis lines:customPlot->xAxis->setTicks(false);customPlot->yAxis->setTicks(true);customPlot->xAxis->setTickLabels(false);customPlot->yAxis->setTickLabels(true);// make top right axes clones of bottom left axes:customPlot->axisRect()->setupFullAxesBox();
}void MainWindow::setupScatterPixmapDemo(QCustomPlot *customPlot)
{demoName = "Scatter Pixmap Demo";customPlot->axisRect()->setBackground(QPixmap("./solarpanels.jpg"));customPlot->addGraph();customPlot->graph()->setLineStyle(QCPGraph::lsLine);QPen pen;pen.setColor(QColor(255, 200, 20, 200));pen.setStyle(Qt::DashLine);pen.setWidthF(2.5);customPlot->graph()->setPen(pen);customPlot->graph()->setBrush(QBrush(QColor(255,200,20,70)));customPlot->graph()->setScatterStyle(QCPScatterStyle(QPixmap("./sun.png")));// set graph name, will show up in legend next to icon:customPlot->graph()->setName("Data from Photovoltaic\nenergy barometer 2011");// set data:QVector<double> year, value;year  << 2005 << 2006 << 2007 << 2008  << 2009  << 2010 << 2011;value << 2.17 << 3.42 << 4.94 << 10.38 << 15.86 << 29.33 << 52.1;customPlot->graph()->setData(year, value);// set title of plot:customPlot->plotLayout()->insertRow(0);customPlot->plotLayout()->addElement(0, 0, new QCPTextElement(customPlot, "Regenerative Energies", QFont("sans", 12, QFont::Bold)));// axis configurations:customPlot->xAxis->setLabel("Year");customPlot->yAxis->setLabel("Installed Gigawatts of\nphotovoltaic in the European Union");customPlot->xAxis2->setVisible(true);customPlot->yAxis2->setVisible(true);customPlot->xAxis2->setTickLabels(false);customPlot->yAxis2->setTickLabels(false);customPlot->xAxis2->setTicks(false);customPlot->yAxis2->setTicks(false);customPlot->xAxis2-></
相关文章:
Qt QCustomPlot介绍
介绍 主要介绍qcustomplot及其用法 最新版本:QCustomPlot Patch Release 2.1.1//November 6, 2022 下载:https://www.qcustomplot.com/index.php/download 官网:https://www.qcustomplot.com/index.php 简单使用 mainwindow.h /**************************************…...

什么是CORS(跨源资源共享)?如何解决前端中的CORS问题?
聚沙成塔每天进步一点点 ⭐ 专栏简介⭐ CORS(跨源资源共享)⭐ 解决前端中的CORS问题的方法⭐ 写在最后 ⭐ 专栏简介 前端入门之旅:探索Web开发的奇妙世界 欢迎来到前端入门之旅!感兴趣的可以订阅本专栏哦!这个专栏是为…...
C 初级学习笔记(基础)
目录 1.预处理器指令 预定义宏 预处理器运算符 (\) 参数化的宏 头文件 .h 引用头文件操作 2.函数(标识符&关键字&运算符)存储类 函数参数 a. 标识符&关键字 b. 运算符(算术、关系、逻辑、位、赋…...
Nodejs 相关知识
Nodejs是一个js运行环境,可以让js开发后端程序,实现几乎其他后端语言实现的所有功能,能够让js与其他后端语言平起平坐。 nodejs是基于v8引擎,v8是Google发布的开源js引擎,本身就是用于chrome浏览器的js解释部分&#…...
【vue+elementUI】输入框样式、选择器样式、树形选择器和下拉框样式修改
输入框样式、选择器样式和下拉框样式修改 1、输入框和选择器的样式修改:2、下拉弹框样式A. 选择器的下拉弹框样式修改B. 时间选择器的下拉弹框样式修改C. vue-treeselect树形下拉框样式 1、输入框和选择器的样式修改: 写在style中不能加scoped࿰…...
JavaScript - canvas - 放大镜
效果 示例 项目结构: 源码: <!DOCTYPE html> <html><head><meta charset"utf-8" /><title>放大镜</title><style type"text/css">div {width: 200px;height: 200px;display: inline-bl…...
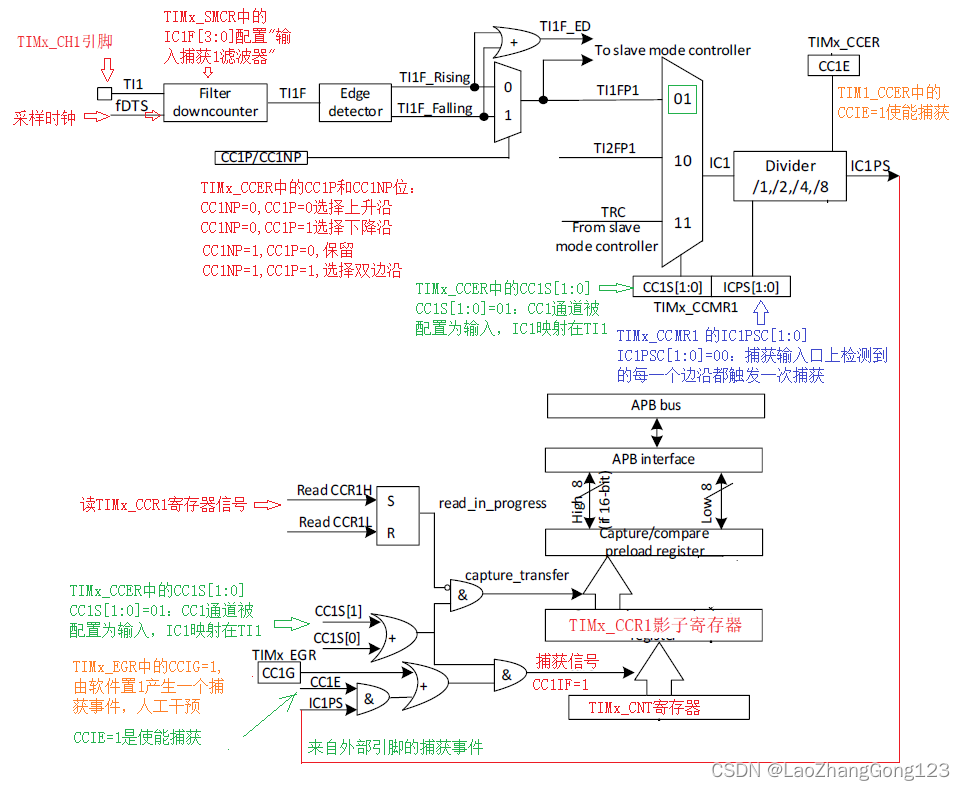
PY32F003F18之输入捕获
输入捕获是定时器的功能之一,配合外部引脚,捕获脉宽时间或采集周期。 CPU中的定时器最基本的功能就是计数功能,其次是输入捕获(IC),再次就是比较输出(OC),还有就是使用引脚对外部时钟进行计数,触发信号捕捉…...
科目三基础四项(一)
第一天,基础操作,仪表,方向,挡位 按照模块来 1、方向盘两手在两侧 编辑 转向时的角度,只用:向左540,向右180 向左打和向右打的角度要抵消,回正 掉头向左打满再回 注意…...
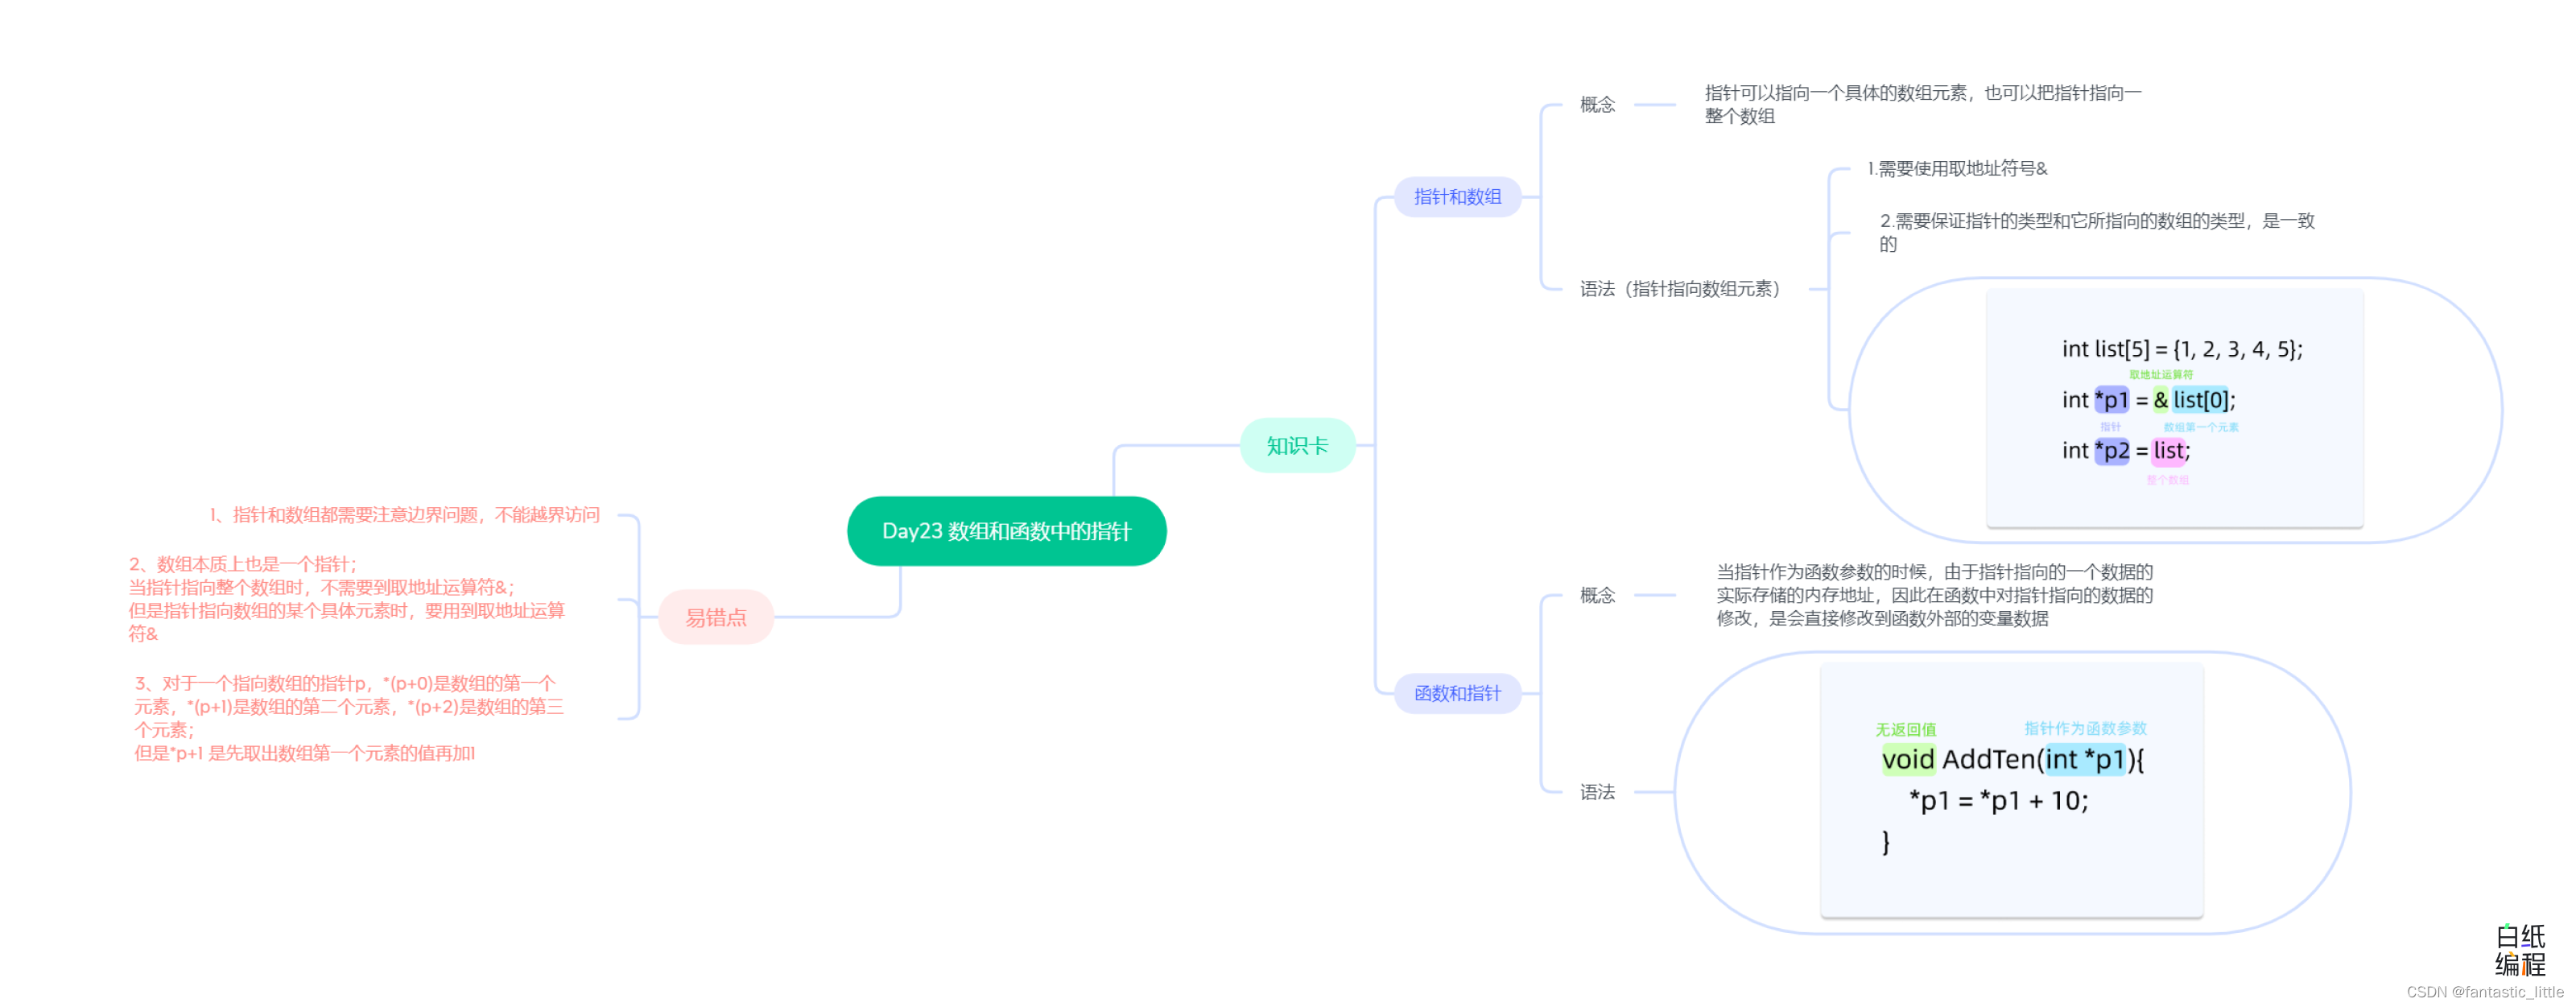
C语言入门Day_24 函数与指针
目录 前言: 1.指针和数组 2.函数和指针 3.易错点 4.思维导图 前言: 我们知道数组是用来存储多个数据的,以及我们可以用指针来指向一个变量。那么我们可以用指针来指向一个数组中的数据么? 指针除了可以像指向一个变量一样指…...

9月21日,每日信息差
今天是2023年9月21日,以下是为您准备的14条信息差 第一、谷歌高管已经广泛讨论了在2027年之前将博通作为人工智能芯片供应商的可能性 第二、清华系团队宣布研发出千亿参数“制药版ChatGPT”,覆盖药物立项、临床前研究、临床试验的各阶段,作…...
【FAQ】安防监控系统/视频云存储/监控平台EasyCVR服务器解释器出现变更该如何修改?
安防视频监控/视频集中存储/云存储/磁盘阵列EasyCVR平台可拓展性强、视频能力灵活、部署轻快,可支持的主流标准协议有国标GB28181、RTSP/Onvif、RTMP等,以及支持厂家私有协议与SDK接入,包括海康Ehome、海大宇等设备的SDK等。平台既具备传统安…...

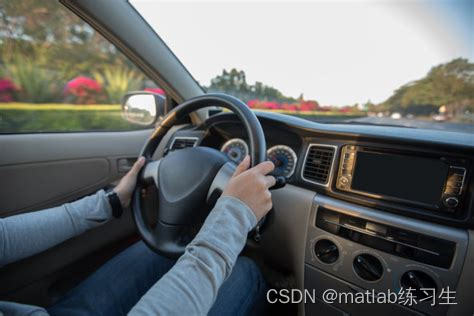
Python手写人脸识别
Python手写人脸识别 引言 人脸识别是一种通过计算机视觉和模式识别技术来识别和验证人脸的技术。Python是一种广泛使用的编程语言,它提供了许多强大的库和工具来实现人脸识别。 在Python中,可以使用多种方法来实现人脸识别,包括基于特征提取的方法、基于深度学习的方法等…...
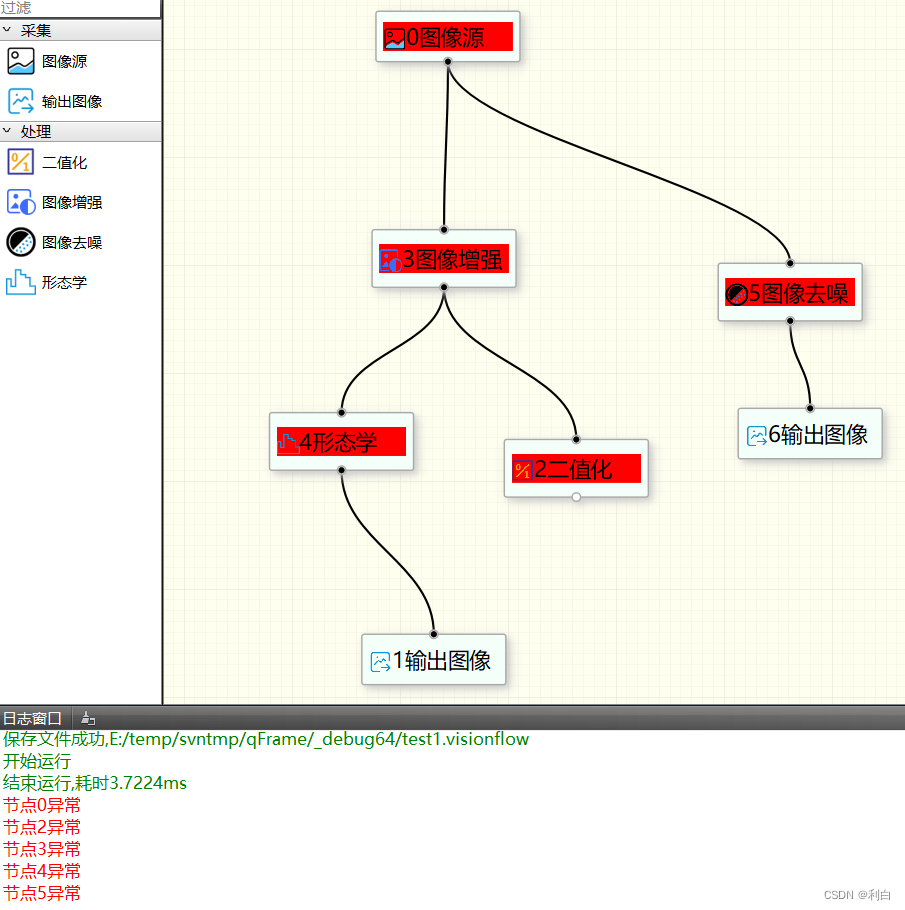
我的Qt作品(19)使用Qt写一个轻量级的视觉框架---第2章,仿海康VM实现思维导图拖拽方式的算法流程图
上次写的第1章介绍了主界面的设计。 https://blog.csdn.net/libaineu2004/article/details/130277151 本次是第2章,主要介绍流程图的运行。 目前市面上视觉框架很多,主要有列表图方式和流程图方式。海康VM的流程图方式比较受用户的喜爱和欢迎…...

仿写Timi记账
项目仿照Timi记账,本 APP 仅用作学习,如有侵权联系删除,项目地址:Timi记账 TIMI记账项目 简单功能对于tableview向上延伸部分采用了insertSubview形式:添加特殊字体添加.ttf文件获取plist文件数据 计算器功能说明简单逻…...

Java语言实现 比较两个Date日期的先后
在 Java 中,可以使用 Date 类的 compareTo() 方法或 before()、after() 方法来比较两个 Date 类型的日期的先后顺序。 使用 compareTo() 方法: Date date1 ...; // 第一个日期 Date date2 ...; // 第二个日期int result date1.compareTo(date2); if (…...
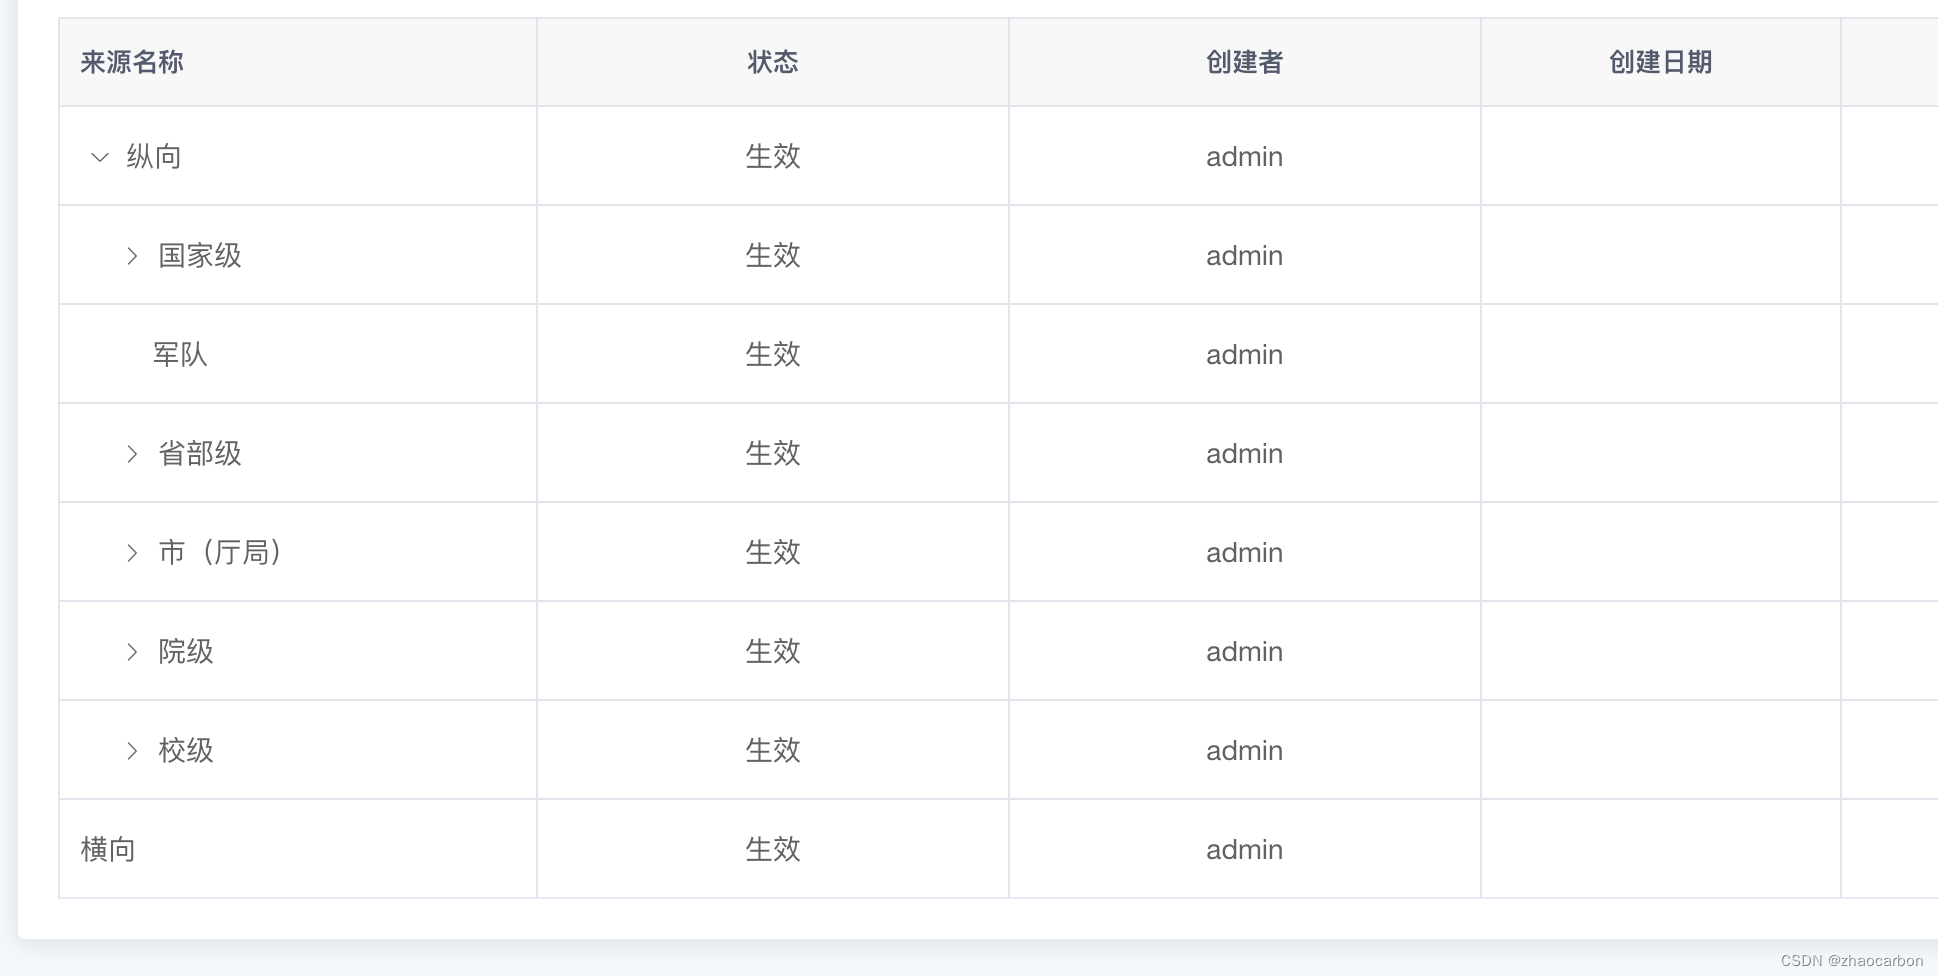
el-table 指定层级展开
先来看看页面默认全部展开时页面的显示效果:所有节点被展开,一眼望去杂乱无章! 那么如何实现只展开指定的节点呢?最终效果如下:一眼看去很舒爽。 干货上代码: <el-table border v-if"refreshTabl…...
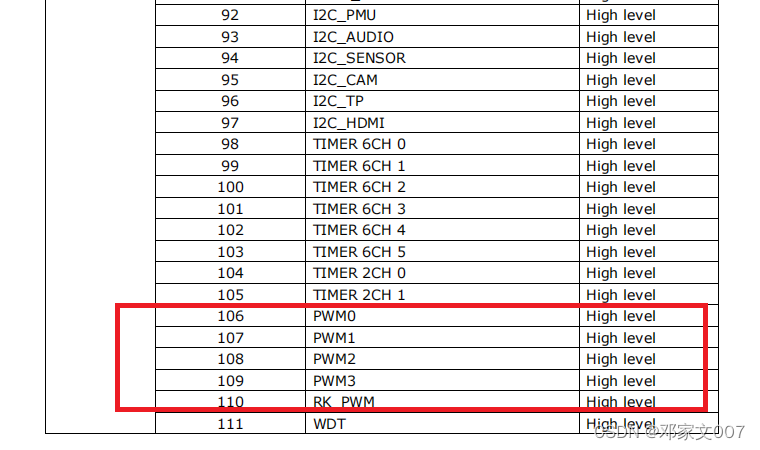
3288S Android11 适配红外遥控功能(超详细)
目录 一、rk3288平台红外遥控介绍二、原理图分析三、配置设备树并使能红外遥控功能四、打开红外打印功能,查看红外遥控的用户码和键值五、将查看到的红外遥控用户码和键值添加到设备树和.kl文件六、Android红外遥控.kl文件映射知识和使用添加新的.kl文件七、补充&am…...

Linux高性能服务器编程 学习笔记 第三章 TCP协议详解
与IP协议相比,TCP协议更靠近应用层,因此在应用程序中有更强的可操作性。一些重要的socket选项都和TCP协议相关。 本章从以下方面讨论TCP协议: 1.TCP头部信息。TCP头部信息出现在每个TCP报文段中,用于指定通信的源端端口号、目的端…...
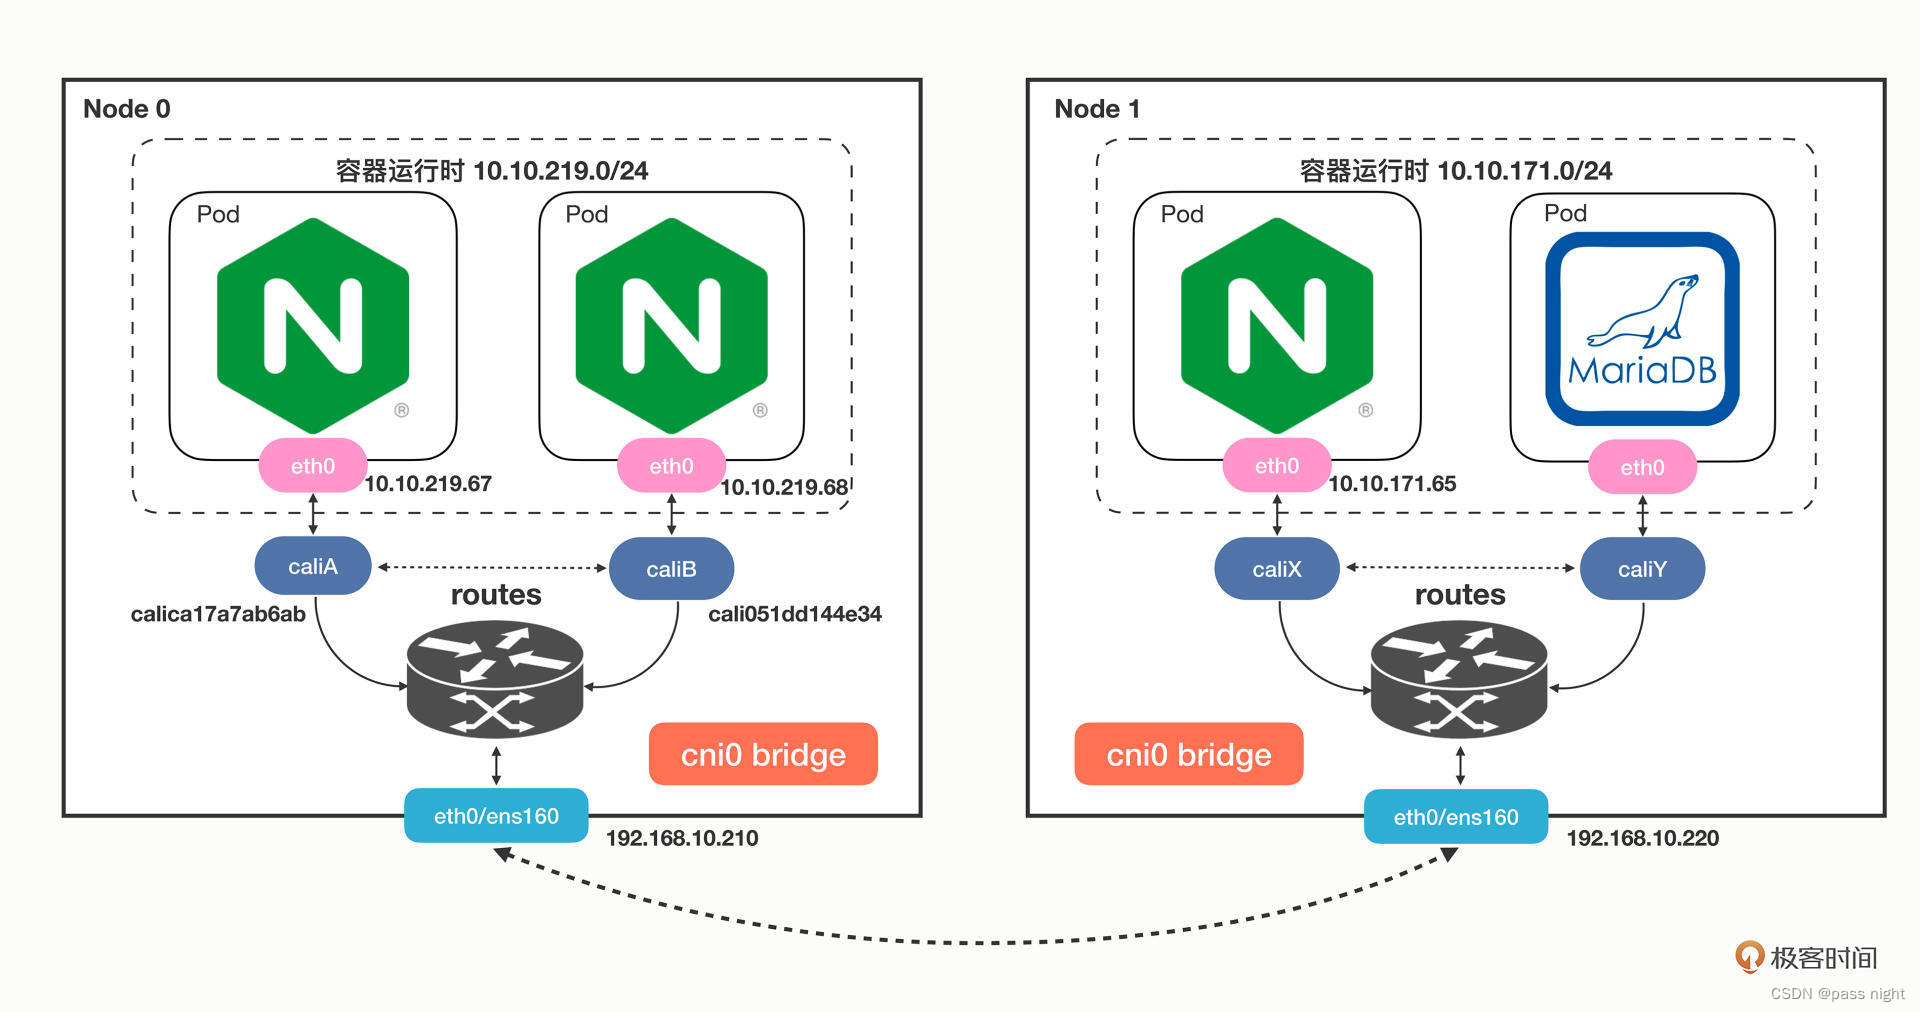
【云原生】Kubernetes学习笔记
部署 在部署前强调几点 不要使用IPv6, 很多组件都不支持IPv6不要使用最新版本, 最新版本非常不稳定, 甚至可能存在无法运行的bug不要版本更新, 安装后就将版本固定下来, 新的版本可能会引入新功能, 或移除旧功能, 导致Kubernetes无法运行 Kubeadm介绍 K8s是由多个模块构成的…...
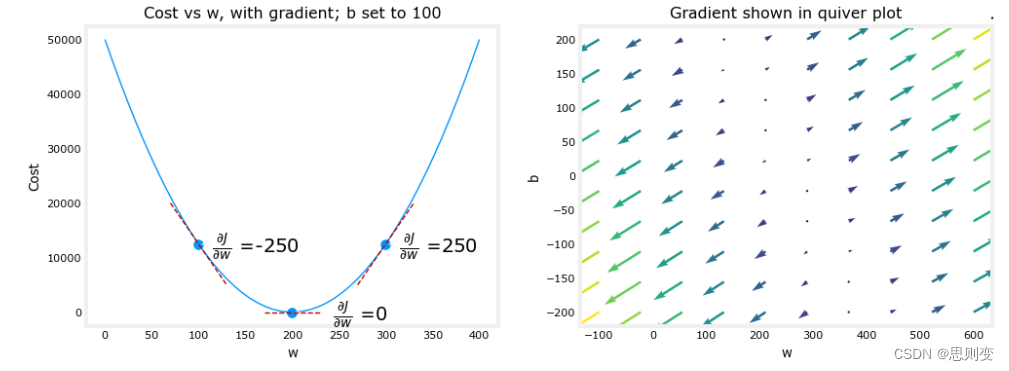
[Machine Learning][Part 2]监督学习的实现
目录 线性模型实现: cost function :代价函数或者损失函数——衡量模型优劣的一个指标 理论: 代码实现: 梯度下降——自动寻找最小的cost function 代价函数 梯度的概念: 梯度下降公式: 实现一个简单的监督学习…...
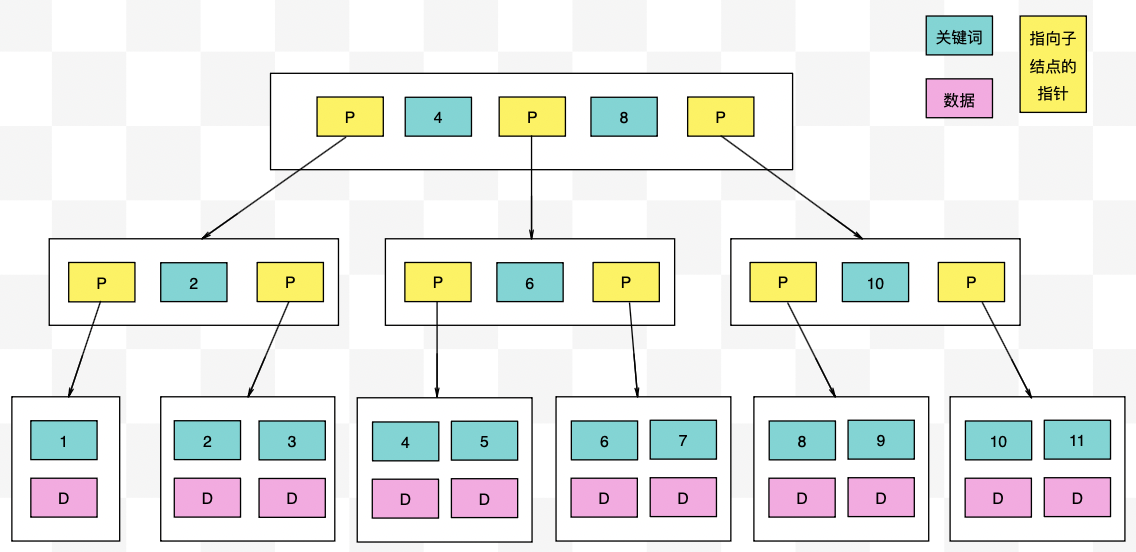
【力扣数据库知识手册笔记】索引
索引 索引的优缺点 优点1. 通过创建唯一性索引,可以保证数据库表中每一行数据的唯一性。2. 可以加快数据的检索速度(创建索引的主要原因)。3. 可以加速表和表之间的连接,实现数据的参考完整性。4. 可以在查询过程中,…...
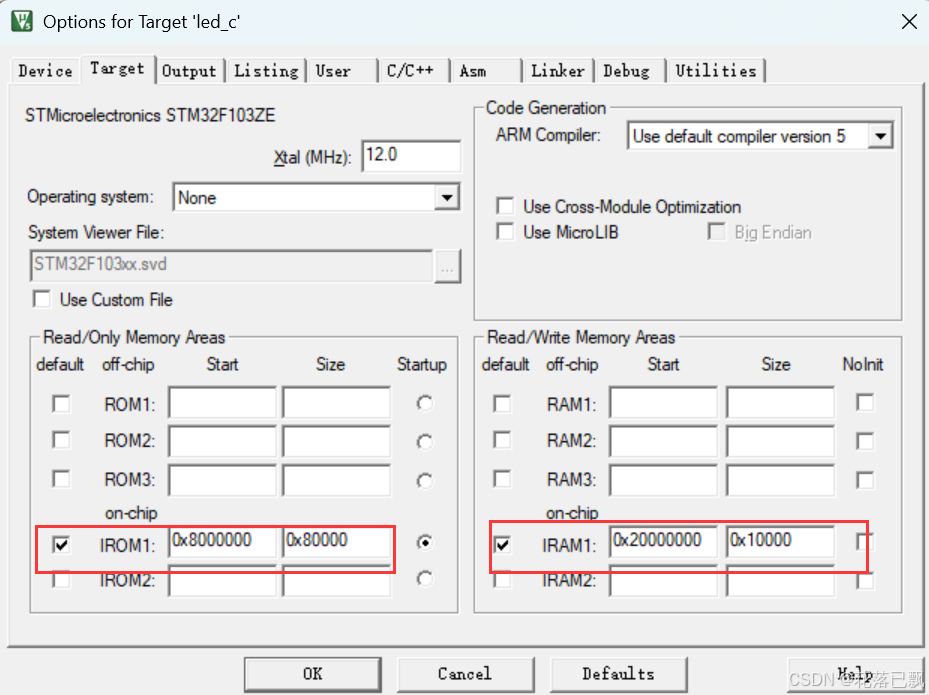
Keil 中设置 STM32 Flash 和 RAM 地址详解
文章目录 Keil 中设置 STM32 Flash 和 RAM 地址详解一、Flash 和 RAM 配置界面(Target 选项卡)1. IROM1(用于配置 Flash)2. IRAM1(用于配置 RAM)二、链接器设置界面(Linker 选项卡)1. 勾选“Use Memory Layout from Target Dialog”2. 查看链接器参数(如果没有勾选上面…...

【AI学习】三、AI算法中的向量
在人工智能(AI)算法中,向量(Vector)是一种将现实世界中的数据(如图像、文本、音频等)转化为计算机可处理的数值型特征表示的工具。它是连接人类认知(如语义、视觉特征)与…...
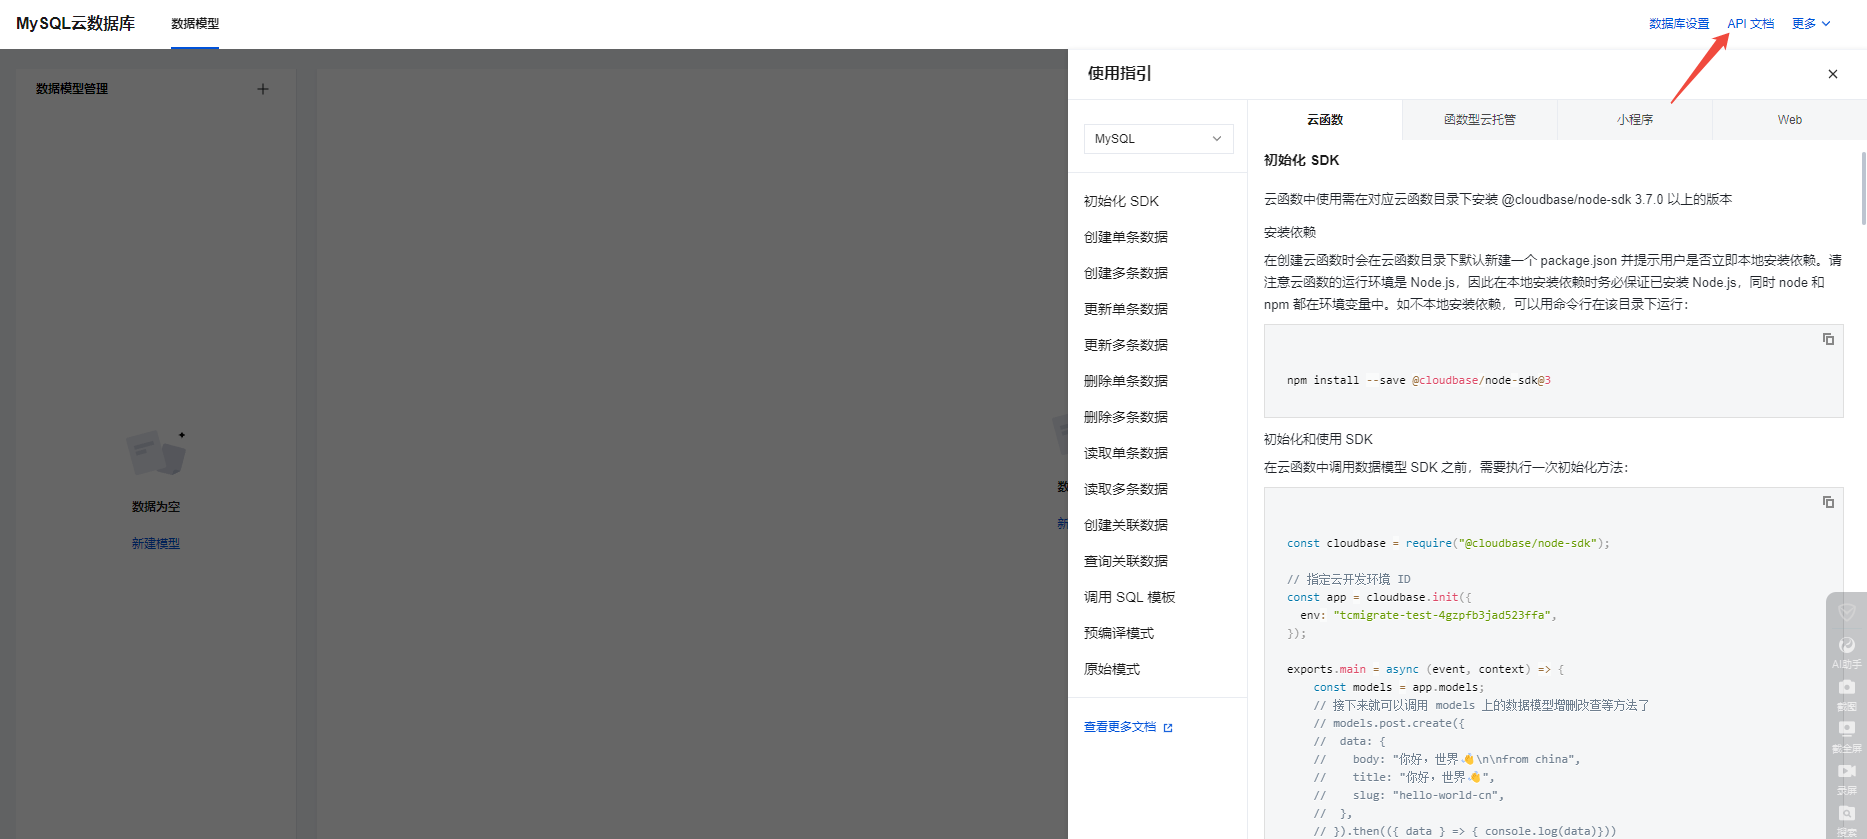
微信小程序云开发平台MySQL的连接方式
注:微信小程序云开发平台指的是腾讯云开发 先给结论:微信小程序云开发平台的MySQL,无法通过获取数据库连接信息的方式进行连接,连接只能通过云开发的SDK连接,具体要参考官方文档: 为什么? 因为…...

docker 部署发现spring.profiles.active 问题
报错: org.springframework.boot.context.config.InvalidConfigDataPropertyException: Property spring.profiles.active imported from location class path resource [application-test.yml] is invalid in a profile specific resource [origin: class path re…...

Linux 中如何提取压缩文件 ?
Linux 是一种流行的开源操作系统,它提供了许多工具来管理、压缩和解压缩文件。压缩文件有助于节省存储空间,使数据传输更快。本指南将向您展示如何在 Linux 中提取不同类型的压缩文件。 1. Unpacking ZIP Files ZIP 文件是非常常见的,要在 …...

C语言中提供的第三方库之哈希表实现
一. 简介 前面一篇文章简单学习了C语言中第三方库(uthash库)提供对哈希表的操作,文章如下: C语言中提供的第三方库uthash常用接口-CSDN博客 本文简单学习一下第三方库 uthash库对哈希表的操作。 二. uthash库哈希表操作示例 u…...

前端中slice和splic的区别
1. slice slice 用于从数组中提取一部分元素,返回一个新的数组。 特点: 不修改原数组:slice 不会改变原数组,而是返回一个新的数组。提取数组的部分:slice 会根据指定的开始索引和结束索引提取数组的一部分。不包含…...
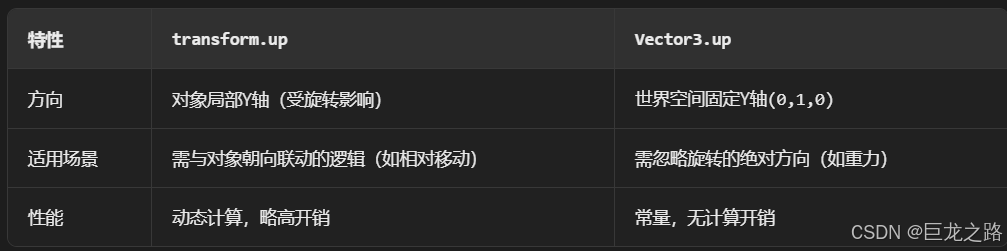
Unity中的transform.up
2025年6月8日,周日下午 在Unity中,transform.up是Transform组件的一个属性,表示游戏对象在世界空间中的“上”方向(Y轴正方向),且会随对象旋转动态变化。以下是关键点解析: 基本定义 transfor…...
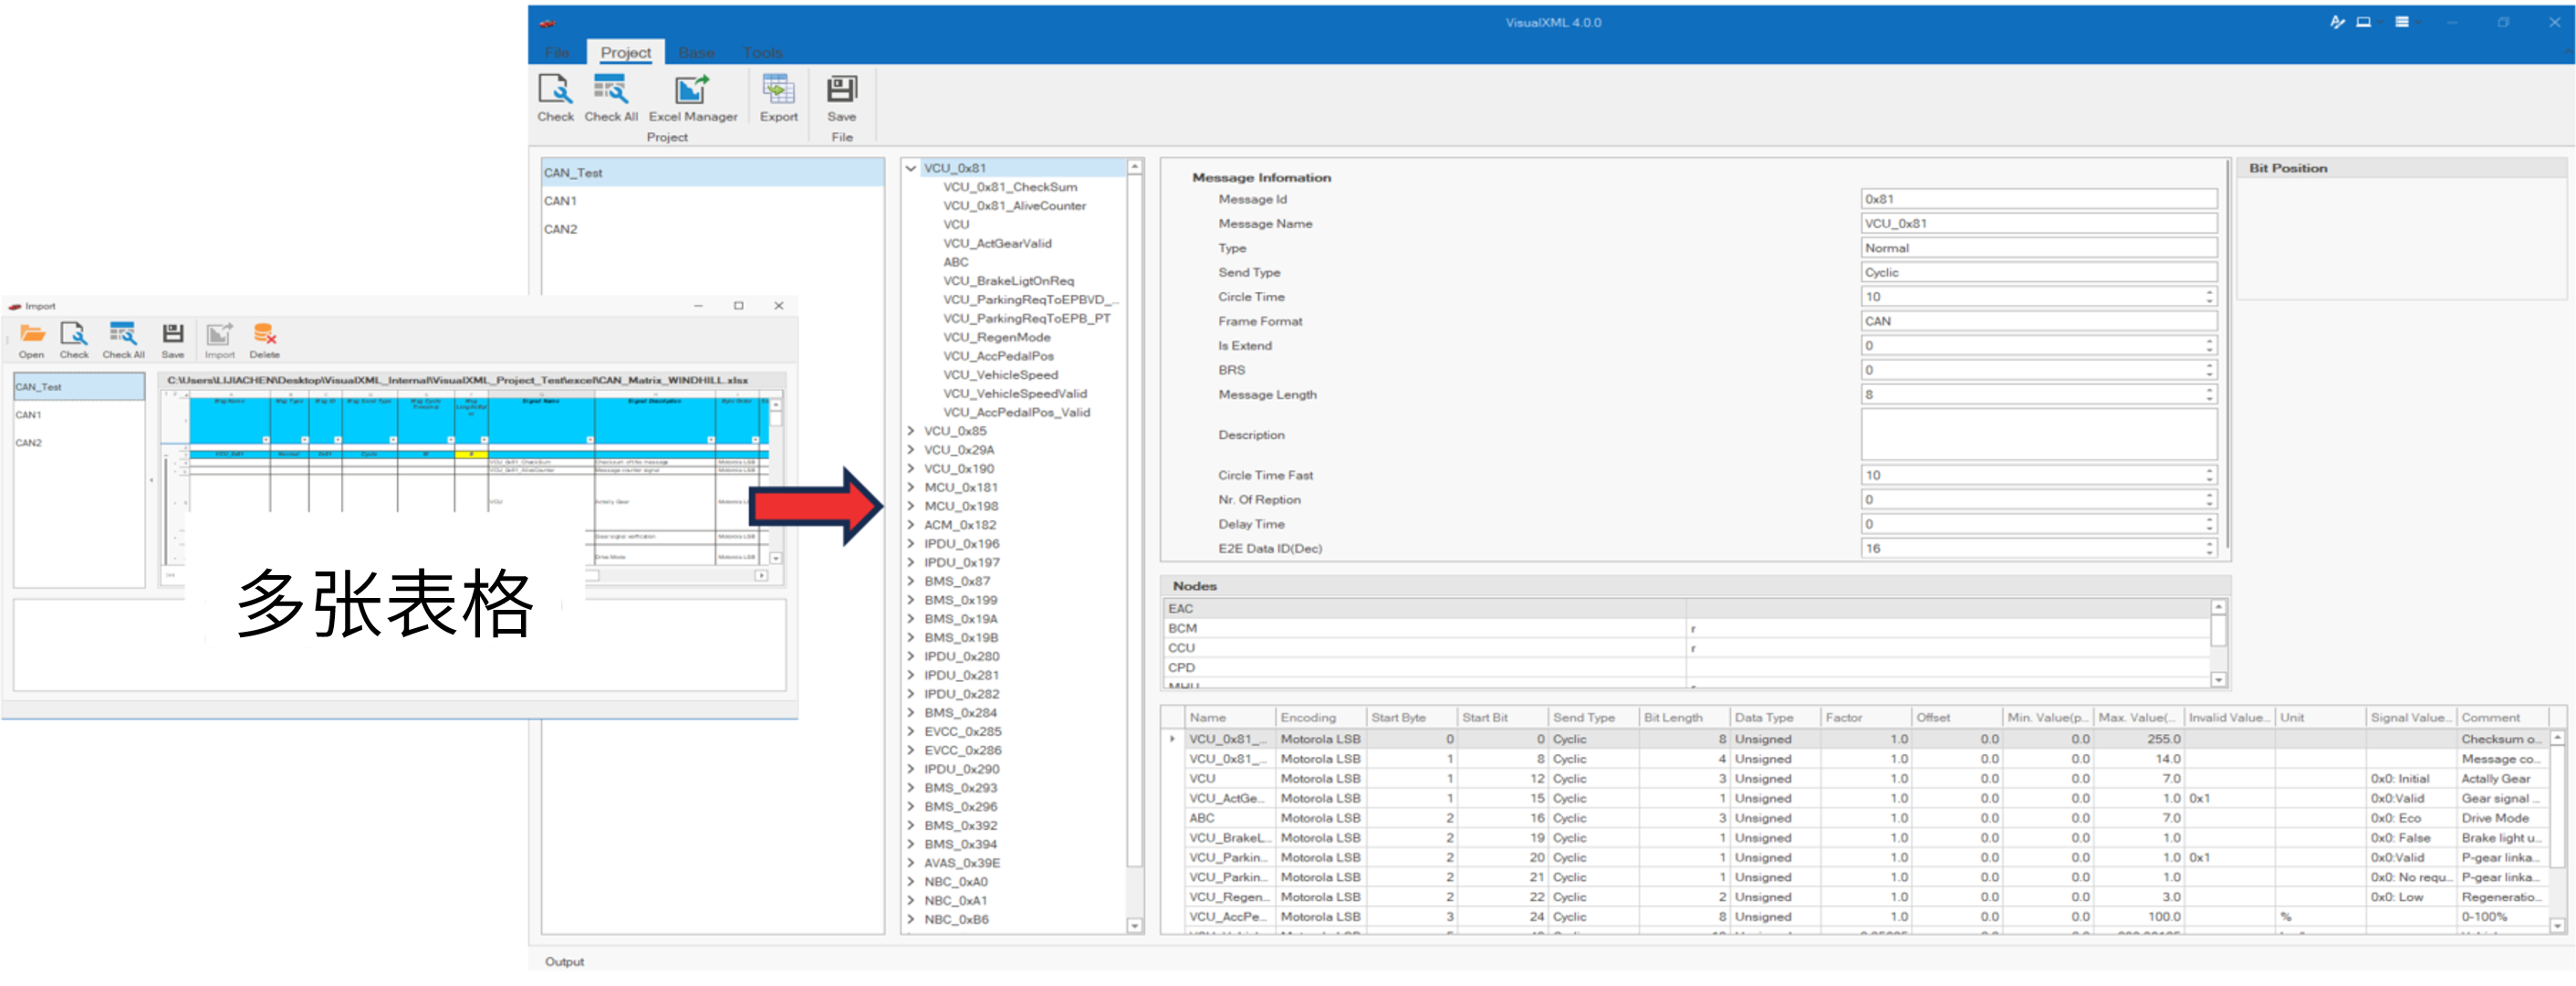
VisualXML全新升级 | 新增数据库编辑功能
VisualXML是一个功能强大的网络总线设计工具,专注于简化汽车电子系统中复杂的网络数据设计操作。它支持多种主流总线网络格式的数据编辑(如DBC、LDF、ARXML、HEX等),并能够基于Excel表格的方式生成和转换多种数据库文件。由此&…...