JFreeChart 生成图表,并为图表标注特殊点、添加文本标识框
一、项目场景:
Java使用JFreeChart库生成图片,主要场景为将具体的数据 可视化 生成曲线图等的图表。
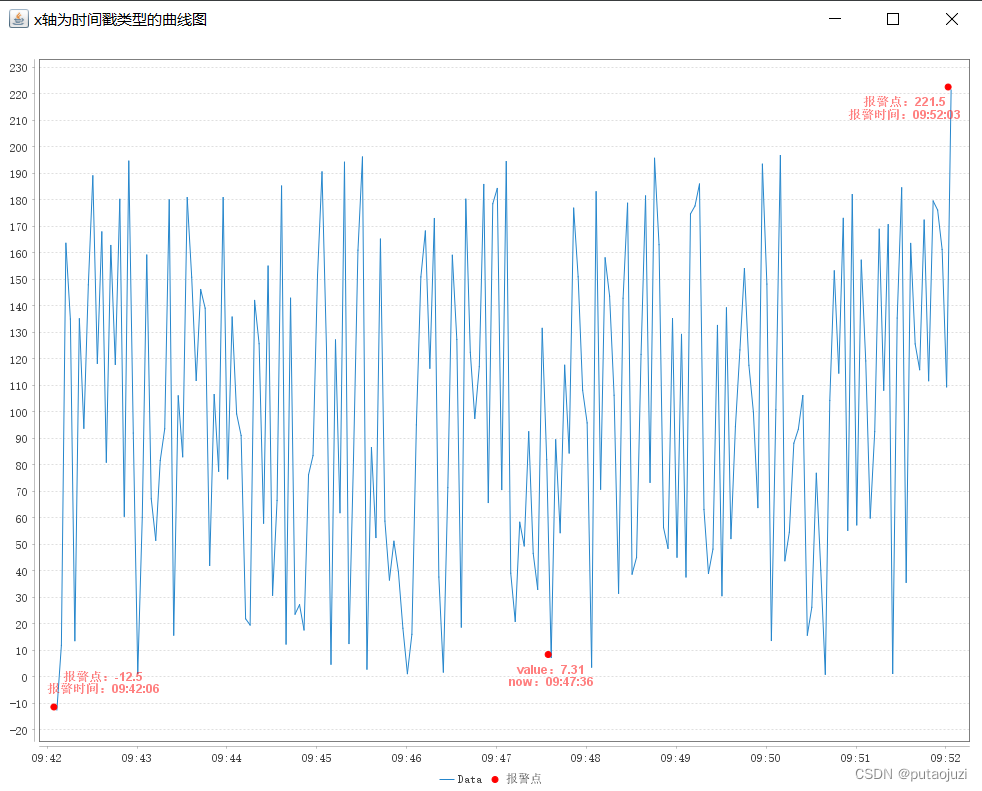
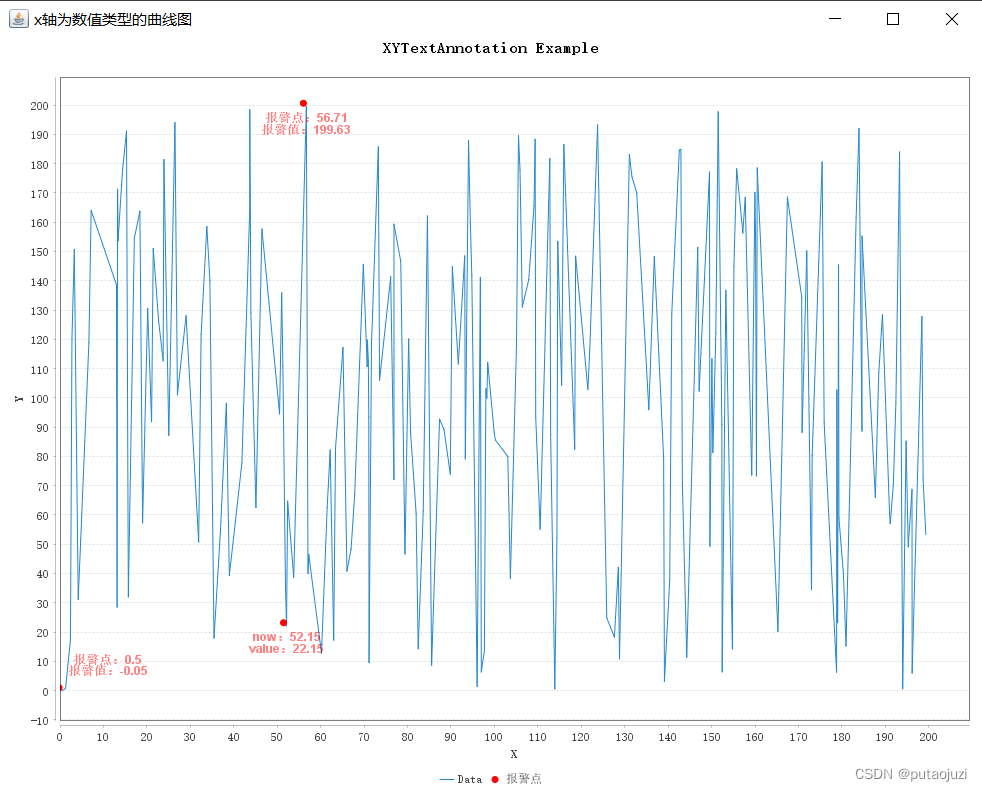
本篇文章主要针对为数据集生成的图表添加特殊点及其标识框。具体包括两种场景:x轴为 时间戳 类型和普通 数值 类型。(y轴都为数值类型)
具体的效果图如下所示:
❀ x轴为 时间戳 形式
❀ x轴为 数值 形式
二、注意事项
❀ 前提介绍
这里 标注特殊点 以及 添加文本标识框 都不算是正规的方法,但是只要注意使 用,也是十分好用的。(正规的方法也能做,估计效果不一定ok)
实现方法: 利用JFreeChart一次可以将多个数据集渲染,也就是说可以一次画多条曲线(好像这种特性是普遍都有的QAQ),将所有的特殊点作为一个统一的数据集,放在整个(数据集)集合 的末尾。让集合的其它数据集正常渲染,然后取出最后一个特殊点数据集进行特殊样式化处理。比如:只显示点、点特殊显示、在点的附近添加文本注释框。这样做的好处就是:可以非常方便的添加多个特殊点。
(前提是特殊点一定是某个数据集的点位)
❀ 注意事项
🐟 多个数据集的命名不能重复,否则会出现某个数据集的数据不能正常显示;


🐟 如果添加的文本注释框需要换行功能,可惜JFreeChart中的XYTextAnnotation并不包括这个功能,即使在文本中手动添加 '\n' 也无法实现换行。这里采用添加多个注释框,再适当的调整位置,手动实现换行(也存在弊端,当图片缩放时,多行的文本注释框的内容可能会重叠或相隔太远的问题,笔者已经试着在解决这个问题了,但是效果仍未达到完美)
🐟 为特殊点添加文本注释框时,避免不了一个问题:当特殊点出现在图表边缘位置的时候,文本显示不完全。 这里呢,已经简单的根据x轴和y轴的数据范围进行了调整,也就是下面代码中annotationXPosFormat 和 annotationYPosFormat 方法所完成的功能。
But,解决了但没完全解决!窗口的大小也与文本框的位置调整相关,这方面我还没完善,但是如果仅需要生成一张数据可视化图片(例如:报警图),意思是不涉及图片(窗口)大小的随意变化的画,下面的代码完全是够用的了。
三、代码记录
这里直接给出所有的代码:
❀ 依赖库
<!--        JFreeChart-->
<dependency><groupId>org.jfree</groupId><artifactId>jfreechart</artifactId><version>1.5.3</version>
</dependency><!--        hutool-->
<dependency><groupId>cn.hutool</groupId><artifactId>hutool-all</artifactId><version>5.8.16</version>
</dependency>
❀ 完整代码:
public class SpecialPointAnnotationFormat {public static void main(String[] args) {//创建主题样式 解决乱码(CN代表中文,这一步一定要添加)StandardChartTheme standardChartTheme = new StandardChartTheme("CN");//设置标题字体standardChartTheme.setExtraLargeFont(new Font("宋体", Font.BOLD, 15));//设置图例的字体standardChartTheme.setRegularFont(new Font("宋体", Font.PLAIN, 12));//设置轴向的字体standardChartTheme.setLargeFont(new Font("宋体", Font.BOLD, 12));//设置主题样式ChartFactory.setChartTheme(standardChartTheme);// 展示x轴为时间戳的图表
//        showXTimeSeriesChart(1600,1000);
//        showXTimeSeriesChart(1200,750);
//        showXTimeSeriesChart(800,500);
//        showXTimeSeriesChart(400,250);// 建议的图片大小showXTimeSeriesChart(1000,800);// 展示x轴为普通数值的图表
//        showXNumberSeriesChart(1000,800);}// 展示x轴为普通数值的图表private static void showXNumberSeriesChart(int width,int height){// 准备数据XYSeries xySeries = new XYSeries("Data");// 报警点double xValue = 52.15d;double yValue = 22.15d;// 手动初始化数据集int dataSize = 200;xySeries.add(0.5,-0.05);for(int i=1;i<dataSize;i++){
//        for(int i=0;i<dataSize;i++){if(i == 100){xySeries.add(xValue,yValue);continue;}xySeries.add(getRandomDouble(dataSize),getRandomDouble(dataSize));}// 整个数据集的集合seriesCollection XYSeriesCollection seriesCollection = new XYSeriesCollection();seriesCollection.addSeries(xySeries);// 创建示例数据集XYDataset dataset = seriesCollection;// 创建图表JFreeChart chart = ChartFactory.createXYLineChart("XYTextAnnotation Example","X","Y",dataset);// 获取图表的绘图区域XYPlot plot = chart.getXYPlot();// 设置曲线颜色plot.getRenderer().setSeriesPaint(0, Color.decode("#2586CC"));// 设置图表背景颜色plot.setBackgroundPaint(Color.WHITE);plot.setDomainGridlinePaint(Color.WHITE);plot.setRangeGridlinePaint(Color.WHITE);plot.setAxisOffset(new RectangleInsets(15.0, 5.0, 5.0, 5.0));plot.setRangeGridlinePaint(Color.LIGHT_GRAY);// 找到报警点对应的值Optional alarmOption = xySeries.getItems().stream().filter(obj -> {XYDataItem dataItem = (XYDataItem) obj;return NumberUtil.equals(dataItem.getXValue(), xValue) && NumberUtil.equals(dataItem.getYValue(), yValue);}).findFirst();if(alarmOption.isPresent()){XYDataItem alarmItem = (XYDataItem) alarmOption.get();addNumberSpecialPoint(plot,xySeries,alarmItem,"报警点","now","value");}else {System.out.println("未在数据集中找到报警点....");}// 找到值最大的点Optional<XYDataItem> maxOption = xySeries.getItems().stream().max(Comparator.comparingDouble(XYDataItem::getYValue));if (maxOption.isPresent()) {XYDataItem maxDataItem = maxOption.get();addNumberSpecialPoint(plot,xySeries,maxDataItem,"报警点","报警点","报警值");}// 找到值最小的点Optional<XYDataItem> minOption = xySeries.getItems().stream().min(Comparator.comparingDouble(XYDataItem::getYValue));if (minOption.isPresent()) {XYDataItem minDataItem = minOption.get();addNumberSpecialPoint(plot,xySeries,minDataItem,"报警点","报警点","报警值");}// 创建图表窗口并显示图表ChartFrame frame = new ChartFrame("x轴为数值类型的曲线图", chart);frame.setPreferredSize(new Dimension(width, height));frame.pack();frame.setVisible(true);}// 展示x轴为时间戳的图表private static void showXTimeSeriesChart(int width,int height){LocalDateTime alarmTime = LocalDateTime.now();LocalDateTime dateTime = alarmTime.minusMinutes(5l).minusSeconds(30l);TimeSeries series = new TimeSeries("Data");// 手动初始化数据集int num = 200;series.add(new Millisecond(Date.from(dateTime.atZone(ZoneId.systemDefault()).toInstant())),-12.5d);
//        for(int i=1;i<num;i++){
//        for(int i=0;i<num;i++){for(int i=1;i<num-1;i++){series.add(new Millisecond(Date.from(dateTime.plusSeconds((long)3*i).atZone(ZoneId.systemDefault()).toInstant())),getRandomDouble(num));}series.add(new Millisecond(Date.from(dateTime.plusSeconds((long)3*(num-1)).atZone(ZoneId.systemDefault()).toInstant())),num + 21.5);// 整个数据集的集合seriesCollection TimeSeriesCollection seriesCollection = new TimeSeriesCollection();seriesCollection.addSeries(series);// 创建示例数据集XYDataset dataset = seriesCollection;// 创建曲线图JFreeChart chart = ChartFactory.createTimeSeriesChart("", // 图表标题"", // X轴标签"", // Y轴标签dataset // 数据集);// 获取图表的绘图区域XYPlot plot = chart.getXYPlot();// 设置曲线颜色plot.getRenderer().setSeriesPaint(0, Color.decode("#2586CC"));// 设置图表背景颜色plot.setBackgroundPaint(Color.WHITE);plot.setDomainGridlinePaint(Color.WHITE);plot.setRangeGridlinePaint(Color.WHITE);plot.setAxisOffset(new RectangleInsets(15.0, 5.0, 5.0, 5.0));plot.setRangeGridlinePaint(Color.LIGHT_GRAY);// 找到报警点对应的值// 将报警时间转换为毫秒表示long alarmTimeMillis = alarmTime.atZone(ZoneId.systemDefault()).toInstant().toEpochMilli();Optional alarmOptional = series.getItems().stream().filter(obj -> {long firstMillisecond = ((TimeSeriesDataItem) obj).getPeriod().getFirstMillisecond();return firstMillisecond == alarmTimeMillis;}).findFirst();if(alarmOptional.isPresent()){TimeSeriesDataItem alarmItem = (TimeSeriesDataItem) alarmOptional.get();addTimeSpecialPoint(plot,series,alarmItem,"报警点", "now","value");}else {System.out.println("未在数据集中找到报警点....");}// 找到值最大的点(一般值最大的点为报警点)Optional<TimeSeriesDataItem> maxOption = series.getItems().stream().max(Comparator.comparingDouble(item -> ((TimeSeriesDataItem) item).getValue().doubleValue()));if (maxOption.isPresent()) {TimeSeriesDataItem maxDataItem = maxOption.get();addTimeSpecialPoint(plot,series,maxDataItem,"报警点","报警时间","报警点");}// 找到值最小的点(一般值最大的点为报警点)Optional<TimeSeriesDataItem> minOption = series.getItems().stream().min(Comparator.comparingDouble(item -> ((TimeSeriesDataItem) item).getValue().doubleValue()));if (minOption.isPresent()) {TimeSeriesDataItem minDataItem = minOption.get();addTimeSpecialPoint(plot,series,minDataItem,"报警点","报警时间","报警点");}double xRange = plot.getDomainAxis().getRange().getLength();double yRange = plot.getRangeAxis().getRange().getLength();// 创建图表窗口并显示图表ChartFrame frame = new ChartFrame("x轴为时间戳类型的曲线图", chart);frame.setPreferredSize(new Dimension(width,height));frame.pack();// pack会默认渲染为frame的最佳尺寸frame.setVisible(true);// 这里也可以直接生成一张图片存放到指定位置(path)// 生成一张图片
//        try {
//            ByteArrayOutputStream out = new ByteArrayOutputStream();
//            ChartUtils.writeChartAsJPEG(out, chart, 1000, 800);
//            String path = System.getProperty("user.dir") + "\\images\\image.jpg";
//
//            downloadByteArrayOutputStream(out.toByteArray(), path);
//        } catch (IOException e) {
//            throw new RuntimeException(e);
//        }}public static void downloadByteArrayOutputStream(byte[] data, String outputPath) {try {ByteArrayInputStream inputStream = new ByteArrayInputStream(data);FileOutputStream outputStream = new FileOutputStream(outputPath);// 将字节数组写入到文件byte[] buffer = new byte[1024];int bytesRead;while ((bytesRead = inputStream.read(buffer)) != -1) {outputStream.write(buffer, 0, bytesRead);}// 关闭流inputStream.close();outputStream.close();System.out.println("文件下载完成:" + outputPath);} catch (IOException e) {e.printStackTrace();}}/*** 图表添加特殊点(x轴为数值类型:double)* @param plot 图层* @param xySeries 一个chart可以有多个数据集(多条折线),需要标识为哪个数据集添加特殊点* @param dataItem 需要标识的点* @param specialTextTitle 特殊点集合名称标识(可置为“”,注意不同数据集的名称不可重复)* @param xSpecialText 特殊点对应的x轴的提示内容* @param ySpecialText 特殊点对应的y轴的提示内容*/private static void addNumberSpecialPoint(XYPlot plot,XYSeries xySeries ,XYDataItem dataItem,String specialTextTitle,String xSpecialText,String ySpecialText){XYSeriesCollection seriesCollection = (XYSeriesCollection) plot.getDataset();XYItemRenderer r = plot.getRenderer();XYLineAndShapeRenderer renderer = (XYLineAndShapeRenderer) r;double xValue = dataItem.getXValue();double yValue = dataItem.getYValue();// 设置特殊点的集合// 判断特殊点集合之前是否已创建XYSeries specialSeries = null;int seriesSize = seriesCollection.getSeries().size();if(seriesSize > 1){specialSeries = (XYSeries)seriesCollection.getSeries().get(seriesSize-1);// 再判断特殊点是否已添加Optional optional = specialSeries.getItems().stream().filter(item -> {XYDataItem xyDataItem = (XYDataItem) item;return NumberUtil.equals(xValue, xyDataItem.getXValue()) && NumberUtil.equals(yValue, xyDataItem.getYValue());}).findFirst();if(optional.isPresent()){// 特殊点已经添加return;}}else {specialSeries = new XYSeries(specialTextTitle);seriesCollection.addSeries(specialSeries);}// 添加特殊值specialSeries.add(xValue,yValue);// 格式// 设置文本颜色和透明度Color textColor = new Color(255, 0, 0, 128); // 设置为半透明的红色(透明度为 128)Font font = new Font("SansSerif", Font.BOLD, 12);// 创建一个带文字的注释框String alarmText1 = xSpecialText + ":" + xValue;XYTextAnnotation line1 = new XYTextAnnotation(alarmText1,xValue,yValue);line1.setFont(font);line1.setPaint(textColor);line1.setX((double) annotationXPosFormat(plot,xySeries,xValue, TextAnnotationTypeEnum.DOUBLE.getType()));line1.setY(annotationYPosFormat(plot,xySeries,yValue,TextAnnotationTypeEnum.DOUBLE.getType()));plot.addAnnotation(line1);double lineSpace = 3.0; // 3Optional<XYDataItem> maxOption = xySeries.getItems().stream().max(Comparator.comparingDouble(XYDataItem::getYValue));Optional<XYDataItem> minOption = xySeries.getItems().stream().min(Comparator.comparingDouble(XYDataItem::getYValue));if(maxOption.isPresent() && minOption.isPresent()) {double sub = maxOption.get().getYValue() - minOption.get().getYValue();lineSpace = sub/50;}String alarmText2 = ySpecialText + ":" + yValue;XYTextAnnotation line2 = new XYTextAnnotation(alarmText2,xValue,yValue);line2.setFont(font);line2.setPaint(textColor);line2.setX((double)annotationXPosFormat(plot,xySeries,xValue,TextAnnotationTypeEnum.DOUBLE.getType()));line2.setY(annotationYPosFormat(plot,xySeries,yValue,TextAnnotationTypeEnum.DOUBLE.getType())-lineSpace);plot.addAnnotation(line2);int pointSize = 3;Shape specifiedShape = new Ellipse2D.Double(-(pointSize*2), -(pointSize*2), pointSize*2, pointSize*2); // 指定点显示的形状Paint specifiedPaint = Color.RED; // 指定点显示的颜色// 对某个指定序列集合的点进行操作renderer.setSeriesShapesVisible(seriesCollection.getSeriesCount() - 1, true); // 显示指定点的形状renderer.setSeriesShape(seriesCollection.getSeriesCount() - 1, specifiedShape); // 设置指定点的形状renderer.setSeriesPaint(seriesCollection.getSeriesCount() - 1, specifiedPaint); // 设置指定点的颜色// 特殊点只显示点,而不显示曲线renderer.setSeriesLinesVisible(seriesCollection.getSeriesCount() - 1, false); // 不显示曲线renderer.setSeriesShapesVisible(seriesCollection.getSeriesCount() - 1, true); // 显示点}/*** 图表添加特殊点(x轴为时间戳类型)* @param plot 图层* @param timeSeries 一个chart可以有多个数据集(多条折线),需要标识为哪个数据集添加特殊点* @param dataItem 需要标识的点* @param specialTextTitle 特殊点集合名称标识(可置为“”,注意不同数据集的名称不可重复)* @param xSpecialText 特殊点对应的x轴的提示内容* @param ySpecialText 特殊点对应的y轴的提示内容*/private static void addTimeSpecialPoint(XYPlot plot,TimeSeries timeSeries ,TimeSeriesDataItem dataItem,String specialTextTitle,String xSpecialText,String ySpecialText){TimeSeriesCollection seriesCollection = (TimeSeriesCollection) plot.getDataset();XYItemRenderer r = plot.getRenderer();XYLineAndShapeRenderer renderer = (XYLineAndShapeRenderer) r;long xValue = dataItem.getPeriod().getFirstMillisecond();double yValue = dataItem.getValue().doubleValue();// 设置特殊点的集合// 判断特殊点集合之前是否已创建TimeSeries specialSeries = null;int seriesSize = seriesCollection.getSeries().size();if(seriesSize > 1){specialSeries = (TimeSeries)seriesCollection.getSeries().get(seriesSize-1);// 再判断特殊点是否已添加Optional optional = specialSeries.getItems().stream().filter(item -> {TimeSeriesDataItem timeDataItem = (TimeSeriesDataItem) item;return NumberUtil.equals(xValue, timeDataItem.getPeriod().getFirstMillisecond()) && NumberUtil.equals(yValue, timeDataItem.getValue().doubleValue());}).findFirst();if(optional.isPresent()){// 特殊点已经添加return;}}else {specialSeries = new TimeSeries(specialTextTitle);seriesCollection.addSeries(specialSeries);}// 添加特殊值specialSeries.add(dataItem.getPeriod(),dataItem.getValue().doubleValue());// 格式// 设置文本颜色和透明度Color textColor = new Color(255, 0, 0, 128); // 设置为半透明的红色(透明度为 128)Font font = new Font("SansSerif", Font.BOLD, 12);// 创建一个带文字的注释框String alarmText1 = ySpecialText + ":" + yValue;XYTextAnnotation line1 = new XYTextAnnotation(alarmText1,xValue,yValue);line1.setFont(font);line1.setPaint(textColor);line1.setX((long)annotationXPosFormat(plot,timeSeries,xValue, TextAnnotationTypeEnum.TIME.getType()));line1.setY(annotationYPosFormat(plot,timeSeries,yValue,TextAnnotationTypeEnum.TIME.getType()));plot.addAnnotation(line1);/*** 通过获取font获取一行字的行高*/
//        // 设置XYTextAnnotation之间的行间距
//        // 获取font的行高
//        FontMetrics fontMetrics = Toolkit.getDefaultToolkit().getFontMetrics(font);
//        int lineHeight = fontMetrics.getHeight();
//        // 250->1.2 | 500->0.6 | 750->0.3 | 1000->0.2
//        double lineSpace = lineHeight + xx;
//        System.out.println("lineSpace=" + lineSpace);
//        System.out.println("xx=" + xx);// 设置换行的间隔double lineSpace = 3.0; // 3Optional<TimeSeriesDataItem> maxOption = timeSeries.getItems().stream().max(Comparator.comparingDouble(item -> ((TimeSeriesDataItem) item).getValue().doubleValue()));Optional<TimeSeriesDataItem> minOption = timeSeries.getItems().stream().min(Comparator.comparingDouble(item -> ((TimeSeriesDataItem) item).getValue().doubleValue()));if(maxOption.isPresent() && minOption.isPresent()) {double sub = maxOption.get().getValue().doubleValue() - minOption.get().getValue().doubleValue();lineSpace = sub/50;}String alarmText2 = xSpecialText + ":" + LocalDateTime.ofInstant(Instant.ofEpochMilli(xValue), ZoneId.systemDefault()).format(DatePattern.NORM_TIME_FORMATTER);XYTextAnnotation line2 = new XYTextAnnotation(alarmText2,xValue,yValue);line2.setFont(font);line2.setPaint(textColor);line2.setX((long)annotationXPosFormat(plot,timeSeries,xValue,TextAnnotationTypeEnum.TIME.getType()));line2.setY(annotationYPosFormat(plot,timeSeries,yValue,TextAnnotationTypeEnum.TIME.getType())-lineSpace);plot.addAnnotation(line2);int dotSize = 3;Shape specifiedShape = new Ellipse2D.Double(-(dotSize*2), -(dotSize*2), dotSize*2, dotSize*2); // 指定点显示的形状Paint specifiedPaint = Color.RED; // 指定点显示的颜色// 对特殊点集合的点进行操作()renderer.setSeriesShapesVisible(seriesCollection.getSeriesCount() - 1, true); // 显示指定点的形状renderer.setSeriesShape(seriesCollection.getSeriesCount() - 1, specifiedShape); // 设置指定点的形状renderer.setSeriesPaint(seriesCollection.getSeriesCount() - 1, specifiedPaint); // 设置指定点的颜色// 特殊点只显示点,而不显示曲线renderer.setSeriesLinesVisible(seriesCollection.getSeriesCount() - 1, false); // 不显示曲线renderer.setSeriesShapesVisible(seriesCollection.getSeriesCount() - 1, true); // 显示点}/*** XYTextAnnotation 文本框位置(x)调整(防止文本框处于边缘位置导致的文本显示不全)* @param series 数据集合* @param value x轴的值* @param type x轴值的类型(有时间戳类型[long]和数值类型[double])* @return 返回值与type的入参类型相同(方法调用处需要类型转换)*/private static Object annotationXPosFormat(XYPlot plot,Series series, Object value, String type){// x轴的范围double xRange = plot.getDomainAxis().getRange().getLength();double offset = xRange * 0.05;if(TextAnnotationTypeEnum.TIME.getType().equals(type)){// x轴为时间戳形式long xValue = (long) value;TimeSeries timeSeries = (TimeSeries) series;int size = timeSeries.getItems().size();long maxValue = timeSeries.getDataItem(size - 1).getPeriod().getFirstMillisecond();long minValue = timeSeries.getDataItem(0).getPeriod().getFirstMillisecond();if(xValue - minValue <= offset){return xValue + (long)offset;}if(maxValue - xValue <= offset){return xValue - (long)offset;}return xValue;}else if(TextAnnotationTypeEnum.DOUBLE.getType().equals(type)){// x轴为double形式double xValue = (double) value;XYSeries xySeries = (XYSeries) series;Optional<XYDataItem> maxOption = xySeries.getItems().stream().max(Comparator.comparingDouble(XYDataItem::getXValue));Optional<XYDataItem> minOption = xySeries.getItems().stream().min(Comparator.comparingDouble(XYDataItem::getXValue));if(minOption.isPresent() && xValue - minOption.get().getXValue() <= offset){return xValue + offset;}if(maxOption.isPresent() && maxOption.get().getXValue() - xValue <= offset){return xValue - offset;}return xValue;}else {return value;}}/***  XYTextAnnotation 文本框位置(y)调整(防止文本框处于边缘位置导致的文本显示不全)* @param series 数据集合* @param yValue y轴的值* @param type x轴值的类型(有时间戳类型[long]和数值类型[double])* @return 统一为double*/private static double annotationYPosFormat(XYPlot plot ,Series series,double yValue,String type){// y轴值的范围double yRange = plot.getRangeAxis().getRange().getLength();double offset = yRange * 0.05;// y轴一般都为double类型if(TextAnnotationTypeEnum.TIME.getType().equals(type)){TimeSeries timeSeries = (TimeSeries) series;Optional<TimeSeriesDataItem> maxOption = timeSeries.getItems().stream().max(Comparator.comparingDouble(item -> ((TimeSeriesDataItem) item).getValue().doubleValue()));Optional<TimeSeriesDataItem> minOption = timeSeries.getItems().stream().min(Comparator.comparingDouble(item -> ((TimeSeriesDataItem) item).getValue().doubleValue()));if(maxOption.isPresent() && minOption.isPresent()){double minValue = minOption.get().getValue().doubleValue();double maxValue = maxOption.get().getValue().doubleValue();if(minOption.isPresent() && yValue - minValue <= offset){return yValue + offset;}if(maxOption.isPresent() && maxValue - yValue <= offset){return yValue - offset/3;}return yValue - offset/3;}return yValue;}else if(TextAnnotationTypeEnum.DOUBLE.getType().equals(type)){XYSeries xySeries = (XYSeries) series;Optional<XYDataItem> maxOption = xySeries.getItems().stream().max(Comparator.comparingDouble(XYDataItem::getYValue));Optional<XYDataItem> minOption = xySeries.getItems().stream().min(Comparator.comparingDouble(XYDataItem::getYValue));if(maxOption.isPresent() && minOption.isPresent()){if(minOption.isPresent() && yValue - minOption.get().getYValue() <= offset){return yValue + offset;}if(maxOption.isPresent() && maxOption.get().getYValue() - yValue <= offset){return yValue - offset/3;}return yValue - offset/3;}return yValue;}else {return yValue;}}/*** 获取指定范围的double类型的随机数* @param scale 范围*/private static Double getRandomDouble(Integer scale){Random random = new Random();double randomNumber = random.nextDouble() * scale; // 生成0到100之间的随机小数BigDecimal bigDecimal = BigDecimal.valueOf(randomNumber).setScale(2, RoundingMode.HALF_DOWN);return bigDecimal.doubleValue();}
}
❀
☀
🐟
bye!
相关文章:

JFreeChart 生成图表,并为图表标注特殊点、添加文本标识框
一、项目场景: Java使用JFreeChart库生成图片,主要场景为将具体的数据 可视化 生成曲线图等的图表。 本篇文章主要针对为数据集生成的图表添加特殊点及其标识框。具体包括两种场景:x轴为 时间戳 类型和普通 数值 类型。(y轴都为…...

vue整合axios 未完
一、简介 1、介绍 axios前端异步请求库类似jouery ajax技术,axios用来在前端页面发起一个异步请求,请求之后页面不动,响应回来刷新页面局部;Axios 是一个基于 promise 的 HTTP 库,可以用在浏览器和 node.js 中 2、特…...

java代码编写twitter授权登录
在上一篇内容已经介绍了怎么申请twitter开放的API接口。 下面介绍怎么通过twitter提供的API,进行授权登录功能。 开发者页面设置 首先在开发者页面开启“用户认证设置”,点击edit进行信息编辑。 我的授权登录是个网页,并且只需要进行简单的…...
SK Ecoplant借助亚马逊云科技,海外服务器为环保事业注入新活力
在当今全球面临着资源紧缺和环境挑战的大背景下,数字技术所依赖的海外服务器正成为加速循环经济转型的关键利器。然而,很多企业在整合数字技术到运营中仍然面临着一系列挑战,依然存在低效流程导致的不必要浪费。针对这一问题,SK E…...
RPC(5):AJAX跨域请求处理
接上一篇RPC(4):HttpClient实现RPC之POST请求进行修改。 1 修改客户端项目 1.1 修改maven文件 修改后配置文件如下: <dependencyManagement><dependencies><dependency><groupId>org.springframework.b…...

用大白话举例子讲明白区块链
什么是区块链?网上这么说: 区块链是一种分布式数据库技术,它以块的形式记录和存储交易数据,并使用密码学算法保证数据的安全性和不可篡改性。每个块都包含了前一个块的哈希值和自身的交易数据,形成了一个不断增长的链条…...

Java URL
URL:统一资源定位符,说白了,就是一个网络 通过URLConnection类可以连接到URL,然后通过URLConnection可以获取读数据的通道。非文本数据用字节流来读取。 读完之后写入本地即可。 public class test {public static void main(S…...
:ETL涉及到的名词解释)
ETL-从1学到100(1/100):ETL涉及到的名词解释
本文章主要介绍ETL和大数据中涉及到名词,同时解释这些名词的含义。由于不是一次性收集这些名词,所以这篇文章将会持续更新,更新日志会存放在本段话下面: 12-19更新:OLTP、OLAP、BI、ETL。 12-20更新:ELT、…...

Jenkins + gitlab 持续集成和持续部署的学习笔记
1. Jenkins 介绍 软件开发生命周期(SLDC, Software Development Life Cycle):它集合了计划、开发、测试、部署的集合。 软件开发瀑布模型 软件的敏捷开发 1.1 持续集成 持续集成 (Continuous integration 简称 CI): 指的是频繁的将代码集成到主干。 持续集成的流…...

R语言【cli】——通过cli_abort用 cli 格式的内容显示错误、警告或信息,内部调用cli_bullets和inline-makeup
cli_abort(message,...,call .envir,.envir parent.frame(),.frame .envir ) 先从那些不需要下大力气理解的参数入手: 参数【.envir】:进行万能表达式编译的环境。 参数【.frame】:抛出上下文。默认用于参数【.trace_bottom】ÿ…...

cka从入门到放弃
无数次想放弃,最后选择了坚持 监控pod日志 监控名为 foobar 的 Pod 的日志,并过滤出具有 unable-access-website 信息的行,然后将 写入到 /opt/KUTR00101/foobar # 解析 监控pod的日志,使用kubectl logs pod-name kubectl logs…...

通过 jekyll 构建 github pages 博客实战笔记
jekyll 搭建教程 jekyll 搭建教程 Gem 安装 Ruby,请访问 下载地址。 Jekyll Jekyll 是一个简单且具备博客特性的静态网站生成器。 Jekyll 中文文档 极客学院中文文档 使用以下命令安装 Jekyll。 $ gem install jekyll在中国可能需要使用代理软件。然后ÿ…...

【AI美图】第09期效果图,AI人工智能汽车+摩托车系列图集
期待中的未来AI汽车 欢迎来到未来的世界,一个充满创新和无限可能的世界,这里有你从未见过的科技奇迹——AI汽车。 想象一下,你站在十字路口,繁忙的交通信号灯在你的视线中闪烁,汽车如潮水般涌来,但是&…...

网线的制作集线器交换机路由器的配置--含思维导图
🎬 艳艳耶✌️:个人主页 🔥 个人专栏 :《产品经理如何画泳道图&流程图》 ⛺️ 越努力 ,越幸运 一、网线的制作 1、网线的材料有哪些? 网线 网线是一种用于传输数据信号的电缆,广泛应…...

LLM微调(四)| 微调Llama 2实现Text-to-SQL,并使用LlamaIndex在数据库上进行推理
Llama 2是开源LLM发展的一个巨大里程碑。最大模型及其经过微调的变体位居Hugging Face Open LLM排行榜(https://huggingface.co/spaces/HuggingFaceH4/open_llm_leaderboard)前列。多个基准测试表明,就性能而言,它正在接近GPT-3.5…...
柔性数组(结构体成员)
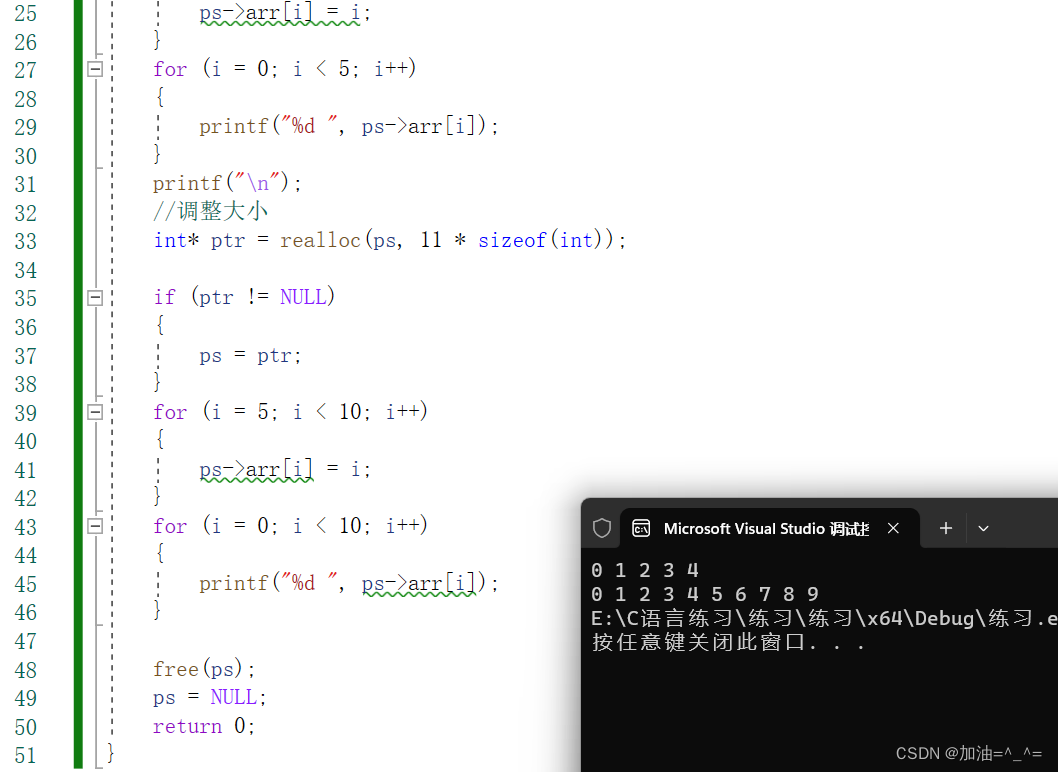
目录 前言: 柔性数组: 给柔性数组分配空间: 调整柔性数组大小: 柔性数组的好处: 前言: 柔性数组?可能你从未听说,但是确实有这个概念。听名字,好像就是柔软的数…...

C#合并多个Word文档(微软官方免费openxml接口)
g /// <summary>/// 合并多个word文档(合并到第一文件)/// </summary>/// <param name"as_word_paths">word文档完整路径</param>/// <param name"breakNewPage">true(默认值),合并下一个…...

MySQL 5.7依赖的软件包和下载地址
yum install ncurses-devel openssl openssl-devel gcc gcc-c ncurses ncurses-devel bison make -y mysql下载地址 下载地址...

图论 | 网络流的基本概念
文章目录 流网路残留网络增广路径割最大流最小割定理最大流Edmonds-Karp 算法算法步骤程序代码时间复杂度 流网路 流网络: G ( V , E ) G (V, E) G(V,E) 有向图,不考虑反向边s:源点t:汇点 c ( u , v ) c(u, v) c(u,v)ÿ…...

【音视频 | AAC】AAC音频编码详解
😁博客主页😁:🚀https://blog.csdn.net/wkd_007🚀 🤑博客内容🤑:🍭嵌入式开发、Linux、C语言、C、数据结构、音视频🍭 🤣本文内容🤣&a…...

PHP和Node.js哪个更爽?
先说结论,rust完胜。 php:laravel,swoole,webman,最开始在苏宁的时候写了几年php,当时觉得php真的是世界上最好的语言,因为当初活在舒适圈里,不愿意跳出来,就好比当初活在…...

学习STC51单片机31(芯片为STC89C52RCRC)OLED显示屏1
每日一言 生活的美好,总是藏在那些你咬牙坚持的日子里。 硬件:OLED 以后要用到OLED的时候找到这个文件 OLED的设备地址 SSD1306"SSD" 是品牌缩写,"1306" 是产品编号。 驱动 OLED 屏幕的 IIC 总线数据传输格式 示意图 …...
HBuilderX安装(uni-app和小程序开发)
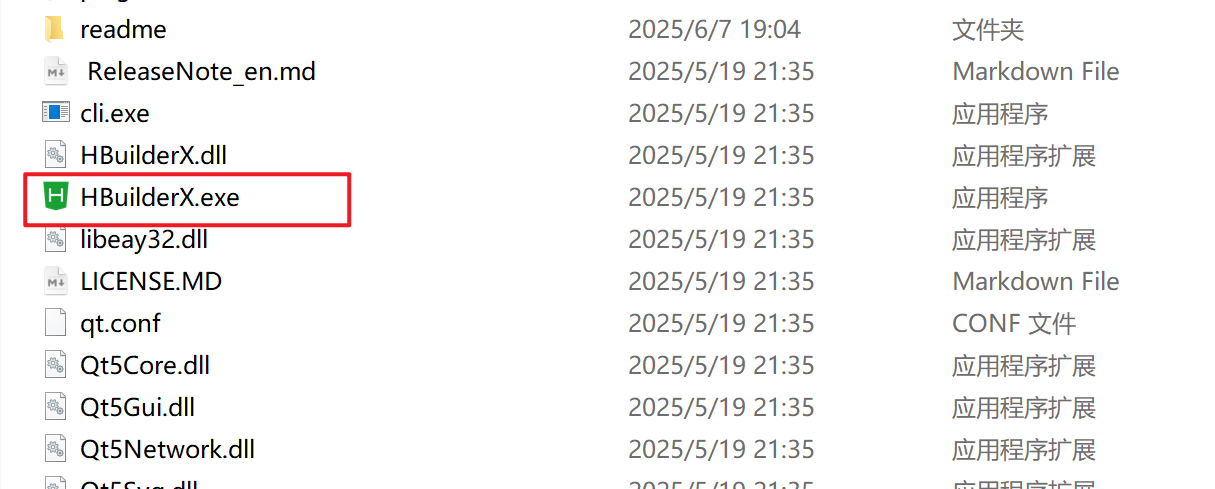
下载HBuilderX 访问官方网站:https://www.dcloud.io/hbuilderx.html 根据您的操作系统选择合适版本: Windows版(推荐下载标准版) Windows系统安装步骤 运行安装程序: 双击下载的.exe安装文件 如果出现安全提示&…...
基于Docker Compose部署Java微服务项目
一. 创建根项目 根项目(父项目)主要用于依赖管理 一些需要注意的点: 打包方式需要为 pom<modules>里需要注册子模块不要引入maven的打包插件,否则打包时会出问题 <?xml version"1.0" encoding"UTF-8…...
(转)什么是DockerCompose?它有什么作用?
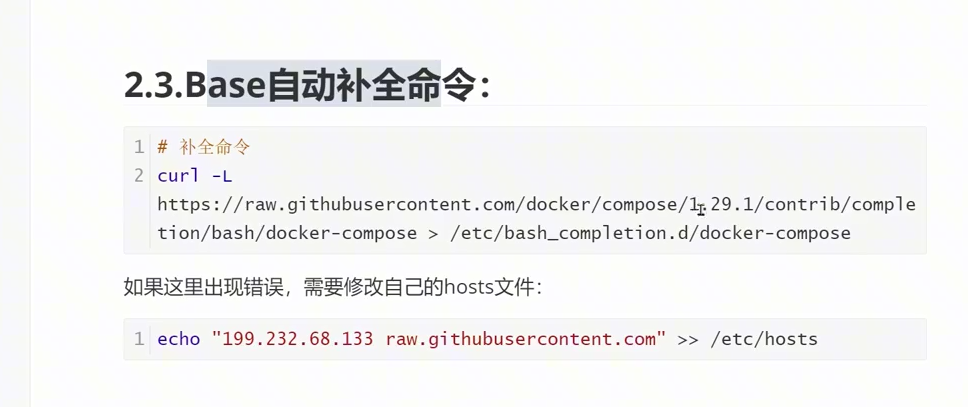
一、什么是DockerCompose? DockerCompose可以基于Compose文件帮我们快速的部署分布式应用,而无需手动一个个创建和运行容器。 Compose文件是一个文本文件,通过指令定义集群中的每个容器如何运行。 DockerCompose就是把DockerFile转换成指令去运行。 …...
android RelativeLayout布局
<?xml version"1.0" encoding"utf-8"?> <RelativeLayout xmlns:android"http://schemas.android.com/apk/res/android"android:layout_width"match_parent"android:layout_height"match_parent"android:gravity&…...

小木的算法日记-多叉树的递归/层序遍历
🌲 从二叉树到森林:一文彻底搞懂多叉树遍历的艺术 🚀 引言 你好,未来的算法大神! 在数据结构的世界里,“树”无疑是最核心、最迷人的概念之一。我们中的大多数人都是从 二叉树 开始入门的,它…...
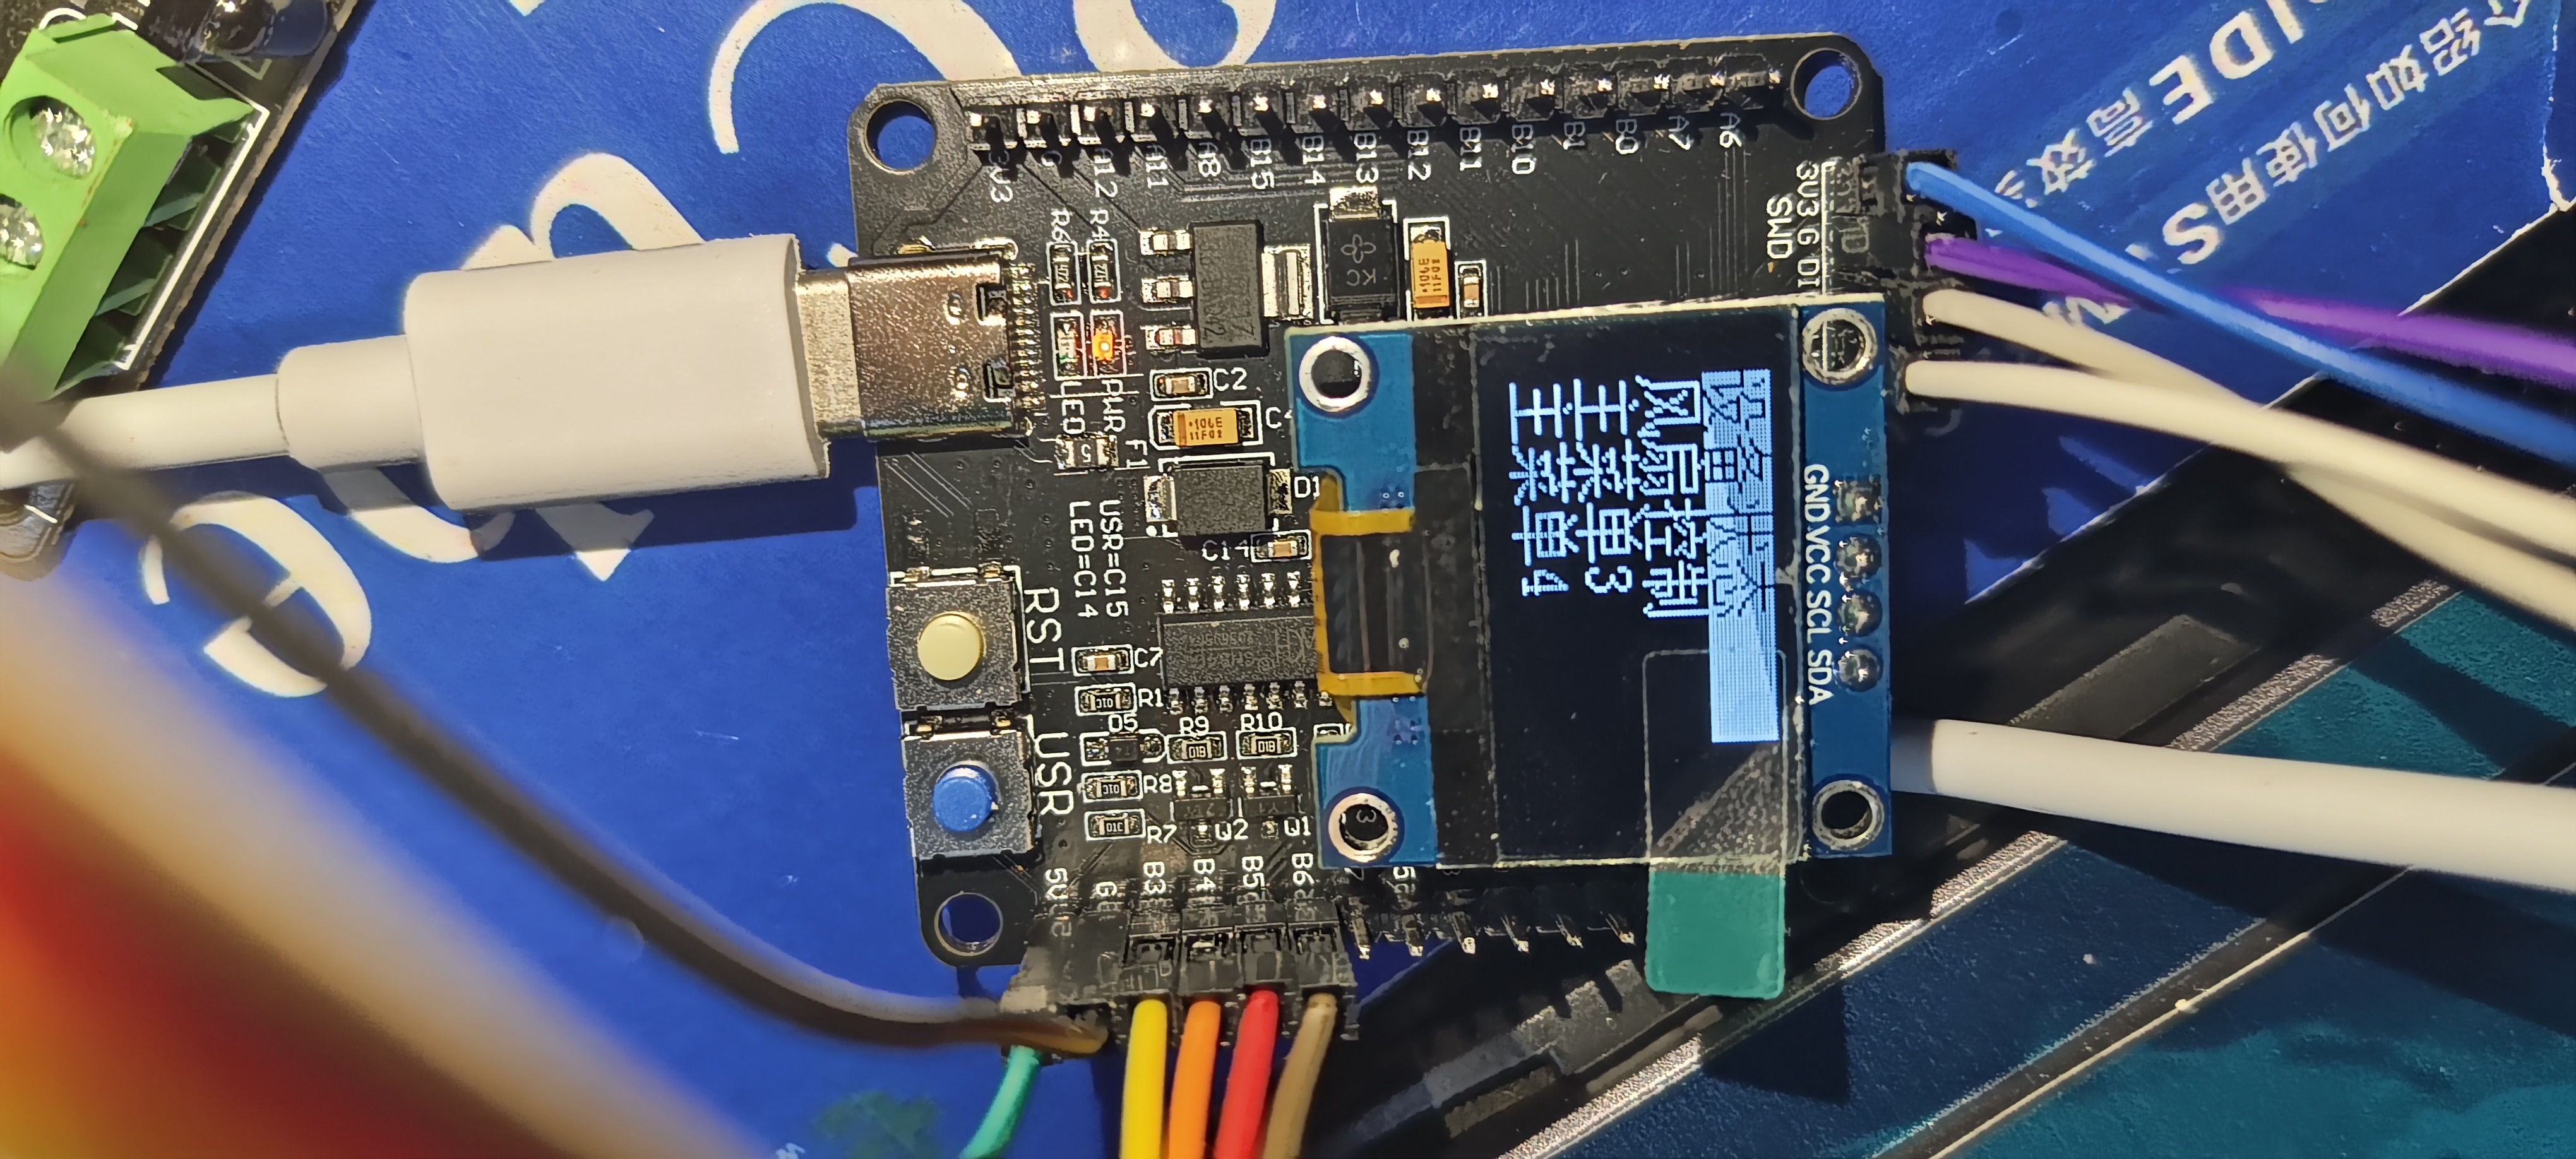
基于江科大stm32屏幕驱动,实现OLED多级菜单(动画效果),结构体链表实现(独创源码)
引言 在嵌入式系统中,用户界面的设计往往直接影响到用户体验。本文将以STM32微控制器和OLED显示屏为例,介绍如何实现一个多级菜单系统。该系统支持用户通过按键导航菜单,执行相应操作,并提供平滑的滚动动画效果。 本文设计了一个…...
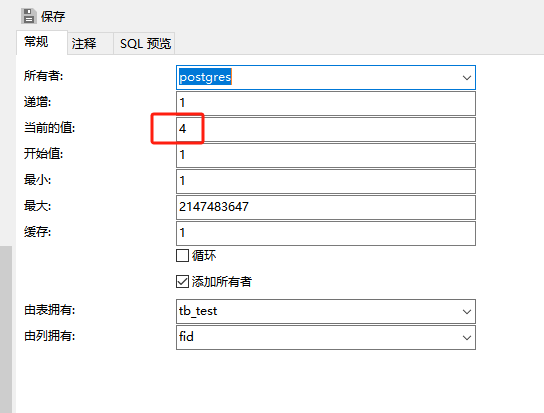
pgsql:还原数据库后出现重复序列导致“more than one owned sequence found“报错问题的解决
问题: pgsql数据库通过备份数据库文件进行还原时,如果表中有自增序列,还原后可能会出现重复的序列,此时若向表中插入新行时会出现“more than one owned sequence found”的报错提示。 点击菜单“其它”-》“序列”,…...

DeepSeek越强,Kimi越慌?
被DeepSeek吊打的Kimi,还有多少人在用? 去年,月之暗面创始人杨植麟别提有多风光了。90后清华学霸,国产大模型六小虎之一,手握十几亿美金的融资。旗下的AI助手Kimi烧钱如流水,单月光是投流就花费2个亿。 疯…...
