Kubelet监控指标说明
Probe路径
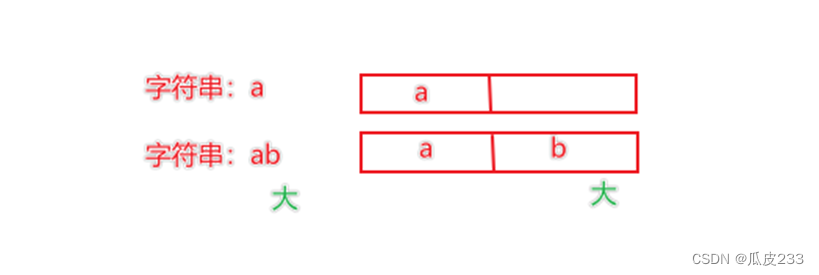
- 含义:kubelet以及kubelet监控的Pod的存活性
- 请求路径:“/metrics/probes”
- 指标
| 名称 | 类型 | 含义 |
|---|---|---|
| up | Gauge | 服务是否存活 |
| prober_probe_total | Counter | 按结果计算容器的活动探测、就绪探测或启动探测的累计数目以及存活性结果 |
Metrics路径
- 含义:kubelet自身指标统计
- 请求路径:“/metrics”
- 指标
| 名称 | 类型 | 含义 |
|---|---|---|
| kubelet_running_pods | Gauge | kubelet上运行pod的数目 |
| kubelet_started_containers_errors_total | Counter | 启动容器时累计错误数 |
cadvisor路径
- 含义:容器和硬件级别监控
- 请求路径:“/metrics/cadvisor”
容器指标
| 名称 | 类型 | 含义 | 单位 | 组件 | additional build flag |
|---|---|---|---|---|---|
| container_accelerator_duty_cycle | Gauge | Percent of time over the past sample period during which the accelerator was actively processing | percentage | accelerator | |
| container_accelerator_memory_total_bytes | Gauge | Total accelerator memory | bytes | accelerator | |
| container_accelerator_memory_used_bytes | Gauge | Total accelerator memory allocated | bytes | accelerator | |
| container_blkio_device_usage_total | Counter | Blkio device bytes usage | bytes | diskIO | |
| container_cpu_cfs_periods_total | Counter | Number of elapsed enforcement period intervals | cpu | ||
| container_cpu_cfs_throttled_periods_total | Counter | Number of throttled period intervals | cpu | ||
| container_cpu_cfs_throttled_seconds_total | Counter | Total time duration the container has been throttled | seconds | cpu | |
| container_cpu_load_average_10s | Gauge | Value of container cpu load average over the last 10 seconds | cpuLoad | ||
| container_cpu_schedstat_run_periods_total | Counter | Number of times processes of the cgroup have run on the cpu | sched | ||
| container_cpu_schedstat_runqueue_seconds_total | Counter | Time duration processes of the container have been waiting on a runqueue | seconds | sched | |
| container_cpu_schedstat_run_seconds_total | Counter | Time duration the processes of the container have run on the CPU | seconds | sched | |
| container_cpu_system_seconds_total | Counter | Cumulative system cpu time consumed | seconds | cpu | |
| container_cpu_usage_seconds_total | Counter | Cumulative cpu time consumed | seconds | cpu | |
| container_cpu_user_seconds_total | Counter | Cumulative user cpu time consumed | seconds | cpu | |
| container_file_descriptors | Gauge | Number of open file descriptors for the container | process | ||
| container_fs_inodes_free | Gauge | Number of available Inodes | disk | ||
| container_fs_inodes_total | Gauge | Total number of Inodes | disk | ||
| container_fs_io_current | Gauge | Number of I/Os currently in progress | diskIO | ||
| container_fs_io_time_seconds_total | Counter | Cumulative count of seconds spent doing I/Os | seconds | diskIO | |
| container_fs_io_time_weighted_seconds_total | Counter | Cumulative weighted I/O time | seconds | diskIO | |
| container_fs_limit_bytes | Gauge | Number of bytes that can be consumed by the container on this filesystem | bytes | disk | |
| container_fs_reads_bytes_total | Counter | Cumulative count of bytes read | bytes | diskIO | |
| container_fs_read_seconds_total | Counter | Cumulative count of seconds spent reading | diskIO | ||
| container_fs_reads_merged_total | Counter | Cumulative count of reads merged | diskIO | ||
| container_fs_reads_total | Counter | Cumulative count of reads completed | diskIO | ||
| container_fs_sector_reads_total | Counter | Cumulative count of sector reads completed | diskIO | ||
| container_fs_sector_writes_total | Counter | Cumulative count of sector writes completed | diskIO | ||
| container_fs_usage_bytes | Gauge | Number of bytes that are consumed by the container on this filesystem | bytes | disk | |
| container_fs_writes_bytes_total | Counter | Cumulative count of bytes written | bytes | diskIO | |
| container_fs_write_seconds_total | Counter | Cumulative count of seconds spent writing | seconds | diskIO | |
| container_fs_writes_merged_total | Counter | Cumulative count of writes merged | diskIO | ||
| container_fs_writes_total | Counter | Cumulative count of writes completed | diskIO | ||
| container_hugetlb_failcnt | Counter | Number of hugepage usage hits limits | hugetlb | ||
| container_hugetlb_max_usage_bytes | Gauge | Maximum hugepage usages recorded | bytes | hugetlb | |
| container_hugetlb_usage_bytes | Gauge | Current hugepage usage | bytes | hugetlb | |
| container_last_seen | Gauge | Last time a container was seen by the exporter | timestamp | - | |
| container_llc_occupancy_bytes | Gauge | Last level cache usage statistics for container counted with RDT Memory Bandwidth Monitoring (MBM). | bytes | resctrl | |
| container_memory_bandwidth_bytes | Gauge | Total memory bandwidth usage statistics for container counted with RDT Memory Bandwidth Monitoring (MBM). | bytes | resctrl | |
| container_memory_bandwidth_local_bytes | Gauge | Local memory bandwidth usage statistics for container counted with RDT Memory Bandwidth Monitoring (MBM). | bytes | resctrl | |
| container_memory_cache | Gauge | Total page cache memory | bytes | memory | |
| container_memory_failcnt | Counter | Number of memory usage hits limits | memory | ||
| container_memory_failures_total | Counter | Cumulative count of memory allocation failures | memory | ||
| container_memory_mapped_file | Gauge | Size of memory mapped files | bytes | memory | |
| container_memory_max_usage_bytes | Gauge | Maximum memory usage recorded | bytes | memory | |
| container_memory_migrate | Gauge | Memory migrate status | cpuset | ||
| container_memory_numa_pages | Gauge | Number of used pages per NUMA node | memory_numa | ||
| container_memory_rss | Gauge | Size of RSS | bytes | memory | |
| container_memory_swap | Gauge | Container swap usage | bytes | memory | |
| container_memory_usage_bytes | Gauge | Current memory usage, including all memory regardless of when it was accessed | bytes | memory | |
| container_memory_working_set_bytes | Gauge | Current working set | bytes | memory | |
| container_network_advance_tcp_stats_total | Gauge | advanced tcp connections statistic for container | advtcp | ||
| container_network_receive_bytes_total | Counter | Cumulative count of bytes received | bytes | network | |
| container_network_receive_errors_total | Counter | Cumulative count of errors encountered while receiving | network | ||
| container_network_receive_packets_dropped_total | Counter | Cumulative count of packets dropped while receiving | network | ||
| container_network_receive_packets_total | Counter | Cumulative count of packets received | network | ||
| container_network_tcp6_usage_total | Gauge | tcp6 connection usage statistic for container | tcp | ||
| container_network_tcp_usage_total | Gauge | tcp connection usage statistic for container | tcp | ||
| container_network_transmit_bytes_total | Counter | Cumulative count of bytes transmitted | bytes | network | |
| container_network_transmit_errors_total | Counter | Cumulative count of errors encountered while transmitting | network | ||
| container_network_transmit_packets_dropped_total | Counter | Cumulative count of packets dropped while transmitting | network | ||
| container_network_transmit_packets_total | Counter | Cumulative count of packets transmitted | network | ||
| container_network_udp6_usage_total | Gauge | udp6 connection usage statistic for container | udp | ||
| container_network_udp_usage_total | Gauge | udp connection usage statistic for container | udp | ||
| container_oom_events_total | Counter | Count of out of memory events observed for the container | oom_event | ||
| container_perf_events_scaling_ratio | Gauge | Scaling ratio for perf event counter (event can be identified by event label and cpu indicates the core for which event was measured). See perf event configuration. | perf_event | libpfm | |
| container_perf_events_total | Counter | Scaled counter of perf core event (event can be identified by event label and cpu indicates the core for which event was measured). See perf event configuration. | perf_event | libpfm | |
| container_perf_uncore_events_scaling_ratio | Gauge | Scaling ratio for perf uncore event counter (event can be identified by event label, pmu and socket lables indicate the PMU and the CPU socket for which event was measured). See perf event configuration. Metric exists only for main cgroup (id=“/”). | perf_event | libpfm | |
| container_perf_uncore_events_total | Counter | Scaled counter of perf uncore event (event can be identified by event label, pmu and socket lables indicate the PMU and the CPU socket for which event was measured). See perf event configuration). Metric exists only for main cgroup (id=“/”). | perf_event | libpfm | |
| container_processes | Gauge | Number of processes running inside the container | process | ||
| container_referenced_bytes | Gauge | Container referenced bytes during last measurements cycle based on Referenced field in /proc/smaps file, with /proc/PIDs/clear_refs set to 1 after defined number of cycles configured through referenced_reset_interval cAdvisor parameter.Warning: this is intrusive collection because can influence kernel page reclaim policy and add latency. Refer to https://github.com/brendangregg/wss#wsspl-referenced-page-flag for more details. | bytes | referenced_memory | |
| container_sockets | Gauge | Number of open sockets for the container | process | ||
| container_spec_cpu_period | Gauge | CPU period of the container | - | ||
| container_spec_cpu_quota | Gauge | CPU quota of the container | - | ||
| container_spec_cpu_shares | Gauge | CPU share of the container | - | ||
| container_spec_memory_limit_bytes | Gauge | Memory limit for the container | bytes | - | |
| container_spec_memory_reservation_limit_bytes | Gauge | Memory reservation limit for the container | bytes | ||
| container_spec_memory_swap_limit_bytes | Gauge | Memory swap limit for the container | bytes | ||
| container_start_time_seconds | Gauge | Start time of the container since unix epoch | seconds | ||
| container_tasks_state | Gauge | Number of tasks in given state (sleeping, running, stopped, uninterruptible, or ioawaiting) | cpuLoad | ||
| container_threads | Gauge | Number of threads running inside the container | process | ||
| container_threads_max | Gauge | Maximum number of threads allowed inside the container | process | ||
| container_ulimits_soft | Gauge | Soft ulimit values for the container root process. Unlimited if -1, except priority and nice | process |
硬件指标
| 名称 | 类型 | 含义 | 单位 | 组件 | additional build flag |
|---|---|---|---|---|---|
| machine_cpu_cache_capacity_bytes | Gauge | Cache size in bytes assigned to NUMA node and CPU core | bytes | cpu_topology | |
| machine_cpu_cores | Gauge | Number of logical CPU cores | |||
| machine_cpu_physical_cores | Gauge | Number of physical CPU cores | |||
| machine_cpu_sockets | Gauge | Number of CPU sockets | |||
| machine_dimm_capacity_bytes | Gauge | Total RAM DIMM capacity (all types memory modules) value labeled by dimm type, | |||
| information is retrieved from sysfs edac per-DIMM API (/sys/devices/system/edac/mc/) introduced in kernel 3.6 | bytes | ||||
| machine_dimm_count | Gauge | Number of RAM DIMM (all types memory modules) value labeled by dimm type, | |||
| information is retrieved from sysfs edac per-DIMM API (/sys/devices/system/edac/mc/) introduced in kernel 3.6 | |||||
| machine_memory_bytes | Gauge | Amount of memory installed on the machine | bytes | ||
| machine_node_hugepages_count | Gauge | Numer of hugepages assigned to NUMA node | cpu_topology | ||
| machine_node_memory_capacity_bytes | Gauge | Amount of memory assigned to NUMA node | bytes | cpu_topology | |
| machine_nvm_avg_power_budget_watts | Gauge | NVM power budget | watts | libipmctl | |
| machine_nvm_capacity | Gauge | NVM capacity value labeled by NVM mode (memory mode or app direct mode) | bytes | libipmctl | |
| machine_thread_siblings_count | Gauge | Number of CPU thread siblings | cpu_topology |
相关文章:

Kubelet监控指标说明
Probe路径 含义:kubelet以及kubelet监控的Pod的存活性请求路径:“/metrics/probes”指标 名称类型含义upGauge服务是否存活prober_probe_totalCounter按结果计算容器的活动探测、就绪探测或启动探测的累计数目以及存活性结果 Metrics路径 含义&#x…...
)
python中的数据类型(价值6980的全能工程师课程笔记)
概述 python数据类型主要分为以下七大类: Numbers(数字) Boolean(布尔) String(字符串) List(列表) Tuple(元组) Dictionary(字典) Set(集合) Python 的七个标准数据类型中: 不可变数据类型(4 个):Number(数字)、Boolean(布尔)、String(字符串)、T…...
Tomcat 配置IPV6
文章目录一、场景二、tomcat开启ipv6三、ipv6环境配置四、访问总结一、场景 我们在linux下安装一个tomcat,启用ipv6的方式,然后在windows下用浏览器访问这个tomcat 二、tomcat开启ipv6 在server.xml配置文件的里面加上 address”[::]” ,这…...
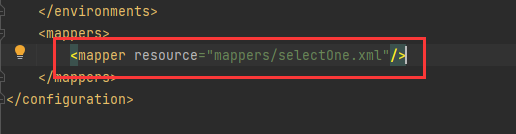
JavaEE——MyBatis的简单介绍和使用
MyBatis是什么 MyBatis是一个支持普通SQL查询,存储过程以及高级映射的持久层框架,他消除了几乎所有的JDBC代码和参数的手动设置以及对结果集的检索,使用简单的XML或注解进行配置和原始映射,将接口和Java的POJO映射成数据库中的记…...
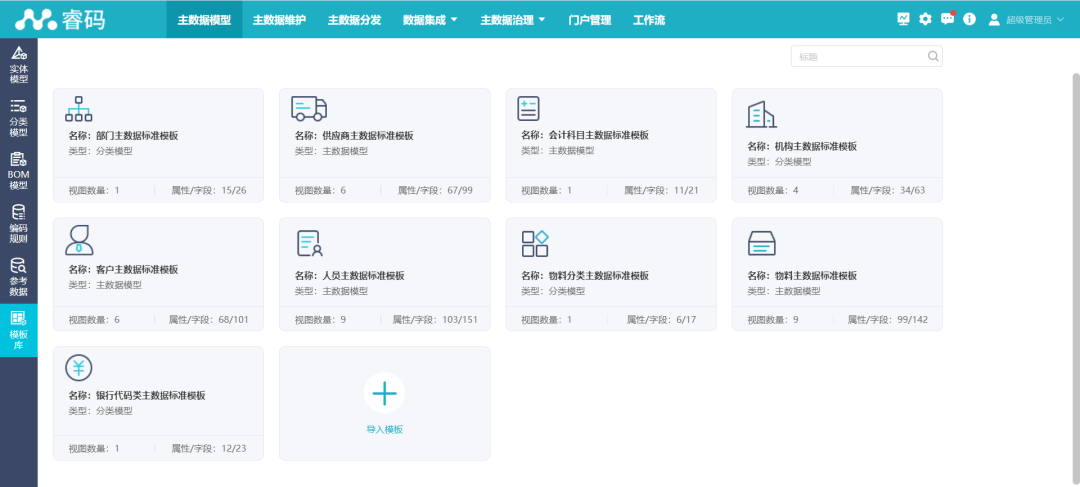
主数据管理平台如何进行模型管理
企业管理主数据,模型管理尤为重要。在对主数据进行建模操作时,既要保证数据通用性、安全性,又要符合企业的业务需求。今天小亿带你认识一下亿信华辰睿码主数据管理平台里的主数据模型管理。 主数据模型分类 一款专业的主数据管理平台&#…...

在 Kubernetes 上运行《我的世界》
最近给小朋友装上了叨叨许久的 Minecraft(我的世界),为了体验安装的是开源启动器 HMCL。其实这游戏我也关注比较久了,不过感觉太耗时间。但被小朋友拉上一起玩,便研究了下自建服务器。GitHub 发现已经有人做好了 Minec…...
万字长文掌握Python高并发
文章目录0 前言1 并发、并行、同步、异步、阻塞、非阻塞1.1 并发1.2 并行1.3 同步1.4 异步1.5 阻塞1.6 非阻塞2 多线程2.1 Python线程的创建方式2.1.1 方式一2.1.2 方式二 继承Thread2.1.3 通过线程池创建多线程2.2 聊聊GIL2.2.1 Python线程与操作系统线程的关系2.3 线程同步2.…...
高性能办公娱乐迷你主机——Maxtang大唐AMD5600U
今天给大家介绍一款AMD5600U迷你主机,说起这款处理器大家应该并不陌生,像联想小新、YOGA以及ThinkBook等很多款用的都是这个型号,不过笔记本的价格基本都在3999-4999这个价位区间,同样的处理器,笔记本卖那么贵…...

牛客教你用雇主品牌力抢人才!附6类校招玩法
最新校招数据显示,79%的应届生在Offer抉择时首要考量薪资福利。但谈钱多伤感情啊~牛客从100案例中挑出6种最潮的校招雇主品牌玩法,助力你抢人才。01、英特尔中国:“芯”动小镇雇主是否能让自己产生激情和热情,已经成为应届生选择O…...
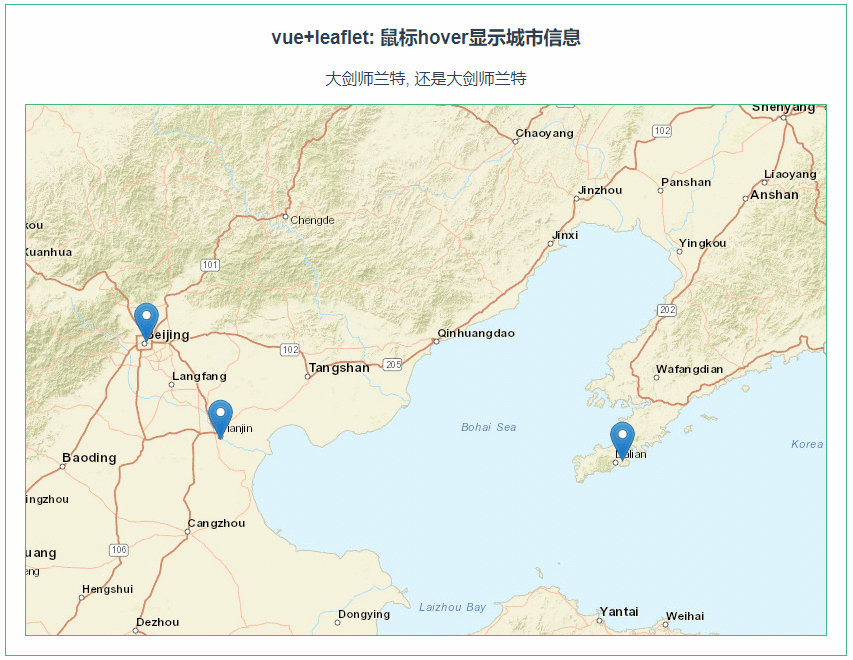
leaflet: 鼠标mouseover显示城市信息,mouseout隐藏信息(067)
第067个 点击查看专栏目录 本示例的目的是介绍演示如何在vue+leaflet中显示城市信息,这里给marker添加鼠标事件,用到了mouseover和mouseout,用于控制信息的显示和隐藏。 直接复制下面的 vue+leaflet源代码,操作2分钟即可运行实现效果 文章目录 示例效果配置方式示例源代码…...
docker部署springboot项目
1、创建放置项目jar包和Dockerfile的文件夹 cd usr/ mkdir reggie cd reggie/ 2、上传Dockerfile和项目jar包 Dockerfile内容如下: # 基础镜像使用java FROM java:8 # 作者 MAINTAINER chenxiansheng # VOLUME 指定了临时文件目录为/tmp。 # 其效果是在主机 /v…...
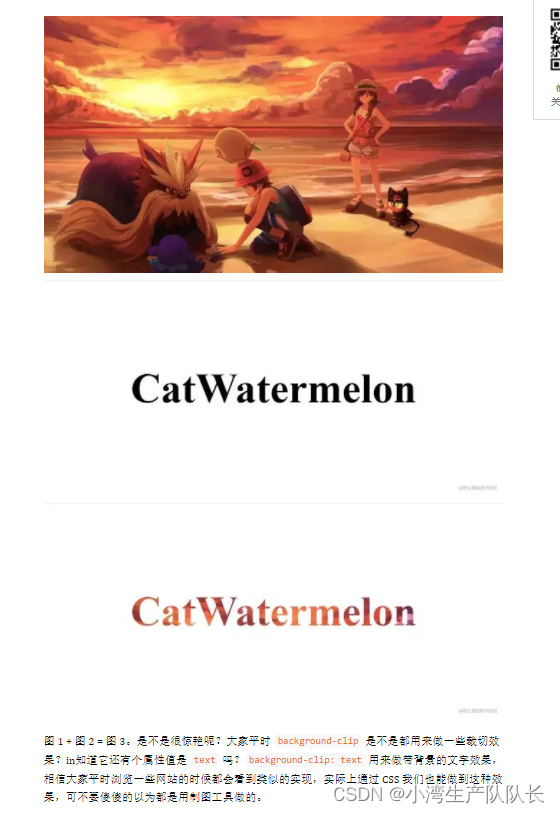
简单实用的CSS属性(滑轮滚动保持头部不动、暂无数据显示、元素隔开距离、带背景的文字效果、网页上禁止选中文字、校验值有效为绿色无效为红色、)
简单实用的CSS属性(滑轮滚动保持头部不动、暂无数据显示、元素隔开距离、带背景的文字效果、网页上禁止选中文字、校验值有效为绿色无效为红色、) 目录 一、滑轮滚动保持头部不动 二、暂无数据显示 三、元素隔开距离 四、带背景的文字效果 backgro…...

Unity 工具 之 SoftMask软遮罩 实现 UI 边缘渐变过渡的简单使用介绍
Unity 工具 之 SoftMask软遮罩 实现 UI 边缘渐变过渡的简单使用介绍 目录 Unity 工具 之 SoftMask软遮罩 实现 UI 边缘渐变过渡的简单使用介绍 一、简单介绍 二、Mask 实现的遮罩效果 三、Soft Mask 实现遮罩效果 四、 Soft Mask 的一些设置 五、插件下载 一、简单介绍 U…...
Python-第六天 Python数据容器
Python-第六天 Python数据容器一、数据容器入门1.数据容器二、数据容器:list(列表)1.列表的定义2.列表的下标(索引)3.列表的常用操作(方法)4.练习案例:常用功能练习5.list(列表)的遍历5.1 列表的…...

【C/C++基础练习题】复习题三,易错点知识点笔记
C复习题知识点记录: 在定义结构体类型时,不可以为成员设置默认值。 在公用一个共用体变量时。系统为其分配存储空间的原则是按成员中占内存空间最大者分配 a ,La, "a", L"a" 字符 长字符 字符串 长字符串 布尔类型只有两个值 fal…...

Mysql sql优化
插入优化 1️⃣ 用批量插入代替单条插入 insert into 表明 values(1, xxx) insert into 表明 values(2, xxx) ... 改为使用👇 insert into 表名 values(1, xxx), (2, xxx)...2️⃣ 手动提交事务 start tranaction; insert into 表名 values(1, xxx), (2, xxx)... in…...

vnode 在 Vue 中的作用
vnode就是 Vue 中的 虚拟 dom 。 vnode 是怎么来的? 就是把 template 中的结构内容,通过 vue template complier 中的 render 函数(使用了 JS 中的 with 语法),来生成 template 中对应的 js 数据结构,举个例…...
SQL语句实现找到一行中数据最大值(greatest)/最小值(least);mysql行转列
今日我在刷题时遇到这样一个题,它提到了以下需求: 有一场节目表演,五名裁判会对节目提供1-10分的打分,节目最终得分为去掉一个最高分和一个最低分后的平均分。 存在以下一张表performence_detail,包含字段有performa…...
记一次以小勃大,紧张刺激的渗透测试(2017年老文)
一、起因 emmm,炎炎夏日到来,这么个桑拿天干什么好呢? 没错,一定要坐在家里,吹着空调,吃着西瓜,然后静静地挖洞。挖洞完叫个外卖,喝着啤酒,撸着烧烤,岂不美…...

LeetCode 61. 旋转链表
原题链接 难度:middle\color{orange}{middle}middle 题目描述 给你一个链表的头节点 headheadhead ,旋转链表,将链表每个节点向右移动 kkk 个位置。 示例 1: 输入:head [1,2,3,4,5], k 2 输出:[4,5,1…...
【力扣数据库知识手册笔记】索引
索引 索引的优缺点 优点1. 通过创建唯一性索引,可以保证数据库表中每一行数据的唯一性。2. 可以加快数据的检索速度(创建索引的主要原因)。3. 可以加速表和表之间的连接,实现数据的参考完整性。4. 可以在查询过程中,…...

连锁超市冷库节能解决方案:如何实现超市降本增效
在连锁超市冷库运营中,高能耗、设备损耗快、人工管理低效等问题长期困扰企业。御控冷库节能解决方案通过智能控制化霜、按需化霜、实时监控、故障诊断、自动预警、远程控制开关六大核心技术,实现年省电费15%-60%,且不改动原有装备、安装快捷、…...
Psychopy音频的使用
Psychopy音频的使用 本文主要解决以下问题: 指定音频引擎与设备;播放音频文件 本文所使用的环境: Python3.10 numpy2.2.6 psychopy2025.1.1 psychtoolbox3.0.19.14 一、音频配置 Psychopy文档链接为Sound - for audio playback — Psy…...
用docker来安装部署freeswitch记录
今天刚才测试一个callcenter的项目,所以尝试安装freeswitch 1、使用轩辕镜像 - 中国开发者首选的专业 Docker 镜像加速服务平台 编辑下面/etc/docker/daemon.json文件为 {"registry-mirrors": ["https://docker.xuanyuan.me"] }同时可以进入轩…...

Swagger和OpenApi的前世今生
Swagger与OpenAPI的关系演进是API标准化进程中的重要篇章,二者共同塑造了现代RESTful API的开发范式。 本期就扒一扒其技术演进的关键节点与核心逻辑: 🔄 一、起源与初创期:Swagger的诞生(2010-2014) 核心…...

Java 二维码
Java 二维码 **技术:**谷歌 ZXing 实现 首先添加依赖 <!-- 二维码依赖 --><dependency><groupId>com.google.zxing</groupId><artifactId>core</artifactId><version>3.5.1</version></dependency><de…...
【7色560页】职场可视化逻辑图高级数据分析PPT模版
7种色调职场工作汇报PPT,橙蓝、黑红、红蓝、蓝橙灰、浅蓝、浅绿、深蓝七种色调模版 【7色560页】职场可视化逻辑图高级数据分析PPT模版:职场可视化逻辑图分析PPT模版https://pan.quark.cn/s/78aeabbd92d1...

AGain DB和倍数增益的关系
我在设置一款索尼CMOS芯片时,Again增益0db变化为6DB,画面的变化只有2倍DN的增益,比如10变为20。 这与dB和线性增益的关系以及传感器处理流程有关。以下是具体原因分析: 1. dB与线性增益的换算关系 6dB对应的理论线性增益应为&…...

面试高频问题
文章目录 🚀 消息队列核心技术揭秘:从入门到秒杀面试官1️⃣ Kafka为何能"吞云吐雾"?性能背后的秘密1.1 顺序写入与零拷贝:性能的双引擎1.2 分区并行:数据的"八车道高速公路"1.3 页缓存与批量处理…...

绕过 Xcode?使用 Appuploader和主流工具实现 iOS 上架自动化
iOS 应用的发布流程一直是开发链路中最“苹果味”的环节:强依赖 Xcode、必须使用 macOS、各种证书和描述文件配置……对很多跨平台开发者来说,这一套流程并不友好。 特别是当你的项目主要在 Windows 或 Linux 下开发(例如 Flutter、React Na…...