uni-app:实现页面效果4(echarts数据可视化)
效果
代码
<template><view><view><view class="title">概况</view><view class="line_position"><view class="line1"><view class="item"><view class="one">今日销售额(万元)</view><view class="two"><view class="left">{{line1_info.daysale_allamount}}</view><view class="right">{{line1_info.daychangeRate}}</view></view><view class="three"><image :src="getImagePath(line1_info.daychangeRate)" alt=""></image></view></view><view class="item"><view class="one">本周销售额(万元)</view><view class="two"><view class="left">{{line1_info.weeksale_allamount}}</view><view class="right">{{line1_info.weekchangeRate}}</view></view><view class="three"><image :src="getImagePath(line1_info.weekchangeRate)" alt=""></image></view></view><view class="item"><view class="one">本月销售额(万元)</view><view class="two"><view class="left">{{line1_info.monthsale_allamount}}</view><view class="right">{{line1_info.monthchangeRate}}</view></view><view class="three"><image :src="getImagePath(line1_info.monthchangeRate)" alt=""></image></view></view><view class="item"><view class="one">今年销售额(万元)</view><view class="two"><view class="left">{{line1_info.yearsale_allamount}}</view><view class="right">{{line1_info.yearchangeRate}}</view></view><view class="three"><image :src="getImagePath(line1_info.yearchangeRate)" alt=""></image></view></view></view></view></view><view><view class="title">销售额统计</view><view class="tab_position"><view class="tab-bar"><text class="tab" :class="{ 'active': activeTab === '0' }" @click="changeTab('0')">周统计</text><text class="tab" :class="{ 'active': activeTab === '1' }" @click="changeTab('1')">月统计</text><text class="tab" :class="{ 'active': activeTab === '2' }" @click="changeTab('2')">年统计</text></view></view><view v-show="activeTab === '0'"><view class="out"><view id="myChart"></view></view></view><view v-show="activeTab === '1'"><view class="out"><view id="myChart1"></view></view></view><view v-show="activeTab === '2'"><view class="out"><view id="myChart2"></view></view></view></view></view>
</template>
<script>// import echarts from '@/static/js/echarts.js' // 引入文件import * as echarts from 'echarts';export default {data() {return {line1_info: '',down: getApp().globalData.icon + 'report/down.png',up: getApp().globalData.icon + 'report/up.png',line: getApp().globalData.icon + 'report/line.png',activeTab: '0', //默认分页面weekinfo: [], // 定义一个空数组用于存储周统计数据monthinfo: [], // 定义一个空数组用于存储月统计数据}},methods: {//切换分页面changeTab(index) {this.activeTab = index;},//图片展示getImagePath(rate) {if (rate === "无法计算") {return this.line;} else if (rate && rate.startsWith("-")) {return this.down;} else {return this.up;}},getdata() {uni.request({url: getApp().globalData.position + 'Other/select_sale_ekanbaninfo',data: {},header: {"Content-Type": "application/x-www-form-urlencoded"},method: 'POST',dataType: 'json',success: res => {//行1:年月日总额统计this.line1_info = res.data;//行2:周统计var weekinfo = res.data.week_info;this.weekinfo = weekinfo;//行2:月统计var monthinfo = res.data.month_info;this.monthinfo = monthinfo;//行2:年统计var yearinfo = res.data.year_info;this.yearinfo = yearinfo;console.log(this.yearinfo)//显示图表this.echart();},fail(res) {console.log("查询失败")}});},//绘制图标echart() {// 周统计金额const myChart = echarts.init(document.getElementById('myChart'))// 提取日期和对应的值var dates = this.weekinfo.date;var values = this.weekinfo.total_amount;var weeks = ["周一", "周二", "周三", "周四", "周五", "周六", "周日"];// 进行图表的配置和数据处理myChart.setOption({//配置网格组件,用于定义图表的位置和大小grid: {top: '15%', // 增加top的值来创建间距left: '2%',right: '2%',bottom: '2%', // 增加bottom的值来创建间距containLabel: true, //自动计算并包含坐标轴标签、刻度和标题等内容在内。},color: ['#e57b7b'],tooltip: {trigger: 'item',axisPointer: {type: 'line'},formatter: function(params) {var value = values[params.dataIndex];var date = dates[params.dataIndex];var week = weeks[params.dataIndex];var marker = params.marker; // 添加marker(小圆点)return marker + ' ' + date + '<br/>' + week + ' : ' + value + '万元';}},xAxis: {// name: '日期',data: weeks,axisLine: {show: false // 隐藏纵坐标轴的横线},//隐藏小刻度短线axisTick: { // x轴刻度相关配置show: false, // 是否显示x轴刻度线},nameTextStyle: {fontSize: 12 // 设置横轴名称字体大小为12}},yAxis: {name: '金额(万元)',splitLine: {show: false // 隐藏纵坐标轴的背景横线},axisLine: {show: false // 隐藏纵坐标轴的竖线},//隐藏小刻度短线axisTick: { // x轴刻度相关配置show: false, // 是否显示x轴刻度线},axisLabel: {fontSize: 12 // 设置横轴标签字体大小为12},nameTextStyle: {fontSize: 12 // 设置横轴名称字体大小为12}},series: [{barWidth: '8',name: '销量',type: 'bar',data: values,itemStyle: {show: true,position: 'top',textStyle: {// color: '#515dc3',fontSize: 12}}}]});//月统计// 周统计金额const myChart1 = echarts.init(document.getElementById('myChart1'))// 提取日期和对应的值var dates1 = this.monthinfo.date;var values1 = this.monthinfo.total_amount;var months1 = ["01", "02", "03", "04", "05", "06", "07", "08", "09", "10", "11", "12"];var months1_chinese = ["1月", "2月", "3月", "4月", "5月", "6月", "7月", "8月", "9月", "10月", "11月", "12月"];// 进行图表的配置和数据处理myChart1.setOption({//配置网格组件,用于定义图表的位置和大小grid: {top: '15%', // 增加top的值来创建间距left: '2%',right: '2%',bottom: '2%', // 增加bottom的值来创建间距containLabel: true, //自动计算并包含坐标轴标签、刻度和标题等内容在内。},color: ['#5588d4'],tooltip: {trigger: 'item',axisPointer: {type: 'line'},formatter: function(params) {var value = values1[params.dataIndex];var date = dates1[params.dataIndex];var month = months1_chinese[params.dataIndex];var marker = params.marker; // 添加marker(小圆点)return marker + ' ' + date + '<br/>' + month + ' : ' + value + '万元';}},xAxis: {// name: '日期',data: months1,axisLine: {show: false // 隐藏纵坐标轴的横线},//隐藏小刻度短线axisTick: { // x轴刻度相关配置show: false, // 是否显示x轴刻度线},nameTextStyle: {fontSize: 12 // 设置横轴名称字体大小为12}},yAxis: {name: '金额(万元)',splitLine: {show: false // 隐藏纵坐标轴的背景横线},axisLine: {show: false // 隐藏纵坐标轴的竖线},//隐藏小刻度短线axisTick: { // x轴刻度相关配置show: false, // 是否显示x轴刻度线},axisLabel: {fontSize: 12 // 设置横轴标签字体大小为12},nameTextStyle: {fontSize: 12 // 设置横轴名称字体大小为12}},series: [{barWidth: '6',name: '销量',type: 'bar',data: values1,itemStyle: {show: true,position: 'top',textStyle: {// color: '#515dc3',fontSize: 12}}}]});//近五年年统计// 年统计金额const myChart2 = echarts.init(document.getElementById('myChart2'))// 提取日期和对应的值var dates2 = this.yearinfo.date;var values2 = this.yearinfo.total_amount;// 进行图表的配置和数据处理myChart2.setOption({//配置网格组件,用于定义图表的位置和大小grid: {top: '15%', // 增加top的值来创建间距left: '2%',right: '2%',bottom: '2%', // 增加bottom的值来创建间距containLabel: true, //自动计算并包含坐标轴标签、刻度和标题等内容在内。},color: ['#71aa77'],tooltip: {trigger: 'item',axisPointer: {type: 'line'},formatter: function(params) {var value = values2[params.dataIndex];var date = dates2[params.dataIndex];var marker = params.marker; // 添加marker(小圆点)return marker + ' ' + date + '年' + '<br/>' + value + '万元';}},xAxis: {// name: '日期',data: dates2,axisLine: {show: false // 隐藏纵坐标轴的横线},//隐藏小刻度短线axisTick: { // x轴刻度相关配置show: false, // 是否显示x轴刻度线},nameTextStyle: {fontSize: 12 // 设置横轴名称字体大小为12}},yAxis: {name: '金额(万元)',splitLine: {show: false // 隐藏纵坐标轴的背景横线},axisLine: {show: false // 隐藏纵坐标轴的竖线},//隐藏小刻度短线axisTick: { // x轴刻度相关配置show: false, // 是否显示x轴刻度线},axisLabel: {fontSize: 12 // 设置横轴标签字体大小为12},nameTextStyle: {fontSize: 12 // 设置横轴名称字体大小为12}},series: [{barWidth: '8',name: '销量',type: 'bar',data: values2,itemStyle: {normal: {label: {show: true,position: 'top',textStyle: {// color: '#515dc3',fontSize: 12}}}}}]})},},onLoad() {this.getdata();},}
</script>
<style lang="scss">//第一行内容.title {// border:1px solid black;padding-left: 2%;font-size: 105%;}.line_position {overflow-x: scroll;scroll-behavior: smooth; // 设置滚动平滑过渡//隐藏滚动条&::-webkit-scrollbar {width: 0; // 隐藏默认的滚动条 height: 0;}&::-webkit-scrollbar-thumb {background-color: transparent; // 隐藏滚动条拖拽的小方块}.line1 {width: 400%;display: flex;// border:1px solid red;.item:nth-child(1) {background-color: #515dc3;}.item:nth-child(2) {background-color: #ff9a3e;}.item:nth-child(3) {background-color: #38bf80;}.item:nth-child(4) {background-color: #fc5959;}.item {width: 40%;margin: 1% 2%;border-radius: 5px;padding: 1% 1% 0 1%;// border:1px solid red;color: white;.two {display: flex;margin: 5% 0;align-items: center;// border:1px solid red;.left {width: 70%;font-size: 24px;// border:1px solid red;}.right {text-align: right;width: 30%;// border:1px solid red;}}.three {text-align: center;// border:1px solid red;image {width: 60px;height: 50px;}}}}}//第二行内容.tab_position {width: 100%;display: flex;justify-content: center;}.tab-bar {display: flex;justify-content: space-between;width: 90%;// border: 1px solid black;background-color: #f2f2f2;border-radius: 15px;margin: 3% 1%;}.tab {padding: 5px;font-size: 16px;cursor: pointer;// border: 1px solid black;width: 33%;text-align: center;// border-bottom: 1px solid #ccc;}.active {color: white;background-color: #515dc3;border-radius: 15px;/* background-color:#74bfe7; */// border-bottom: 1px solid #74bfe7;}//图标.out {width: 800rpx;// border:1px solid red;display: flex;justify-content: center;}#myChart {width: 700rpx;height: 600rpx;}#myChart1 {width: 700rpx;height: 600rpx;}#myChart2 {width: 700rpx;height: 600rpx;}
</style>
这样写会发现在手机端无法正常运
现改用renderjs进行重写
后端代码
//查询销售看板需要使用的数据public function select_sale_ekanbaninfo(){$yesterday = strtotime('-1 day', strtotime(date('Y-m-d')));//获得昨天的时间戳$today = strtotime(date('Y-m-d')); // 获取当前日期的时间戳$data['today'] = $today;// 获取本周开始和结束时间戳$thisWeekStart = strtotime('this week', $today);$thisWeekEnd = strtotime('next week', $today) - 1;// 获取上一周开始和结束时间戳$lastWeekStart = strtotime('-1 week', $thisWeekStart);$lastWeekEnd = strtotime('-1 week', $thisWeekEnd);// 获取本月的开始和结束时间戳$thisMonthStart = strtotime('first day of this month', $today);$thisMonthEnd = strtotime('last day of this month', $today);// 获取上一个月的开始和结束时间戳$lastMonthStart = strtotime('first day of last month', $today);$lastMonthEnd = strtotime('last day of last month', $today);// 获取今年的开始和结束时间戳$thisYearStart = strtotime('first day of January', $today);$thisYearEnd = strtotime('last day of December', $today);// 获取去年的开始和结束时间戳$lastYearStart = strtotime('-1 year', $thisYearStart);$lastYearEnd = strtotime('-1 year', $thisYearEnd);// $oneMonthAgo = strtotime('-1 month'); // 获取一个月前的时间戳// $oneYearAgo = strtotime('-1 year'); // 获取一年前的时间戳// 获取昨天的总金额$data['yesterday_allamount'] = Db::table('so_headers_all')->where('creation_date', '>=', $yesterday)->where('creation_date', '<', $today)->sum('order_all_amount');//当天的总金额$data['daysale_allamount'] = Db::table('so_headers_all')->where('creation_date', '>=', $today) // 筛选 creation_date 大于等于今天的记录->sum('order_all_amount'); // 求和 order_all_amount 列的值// 计算日涨幅比率if ($data['yesterday_allamount'] == 0) {$data['weekchangeRate'] = '无法计算'; }else{$data['daychangeRate'] = ($data['daysale_allamount'] - $data['yesterday_allamount']) / $data['yesterday_allamount'] * 100;if ($data['daychangeRate'] >= 0) {$data['daychangeRate'] = '+' . number_format($data['daychangeRate'], 2) . '%';} else {$data['daychangeRate'] = number_format($data['daychangeRate'], 2) . '%';}}$data['daysale_allamount'] = number_format($data['daysale_allamount']/10000.0, 2); // 格式化结果保留两位小数//近一周的总金额// 获取本周的总金额$data['weeksale_allamount'] = Db::table('so_headers_all')->where('creation_date', '>=', $thisWeekStart)->where('creation_date', '<=', $thisWeekEnd)->sum('order_all_amount');// 获取上一周的总金额$data['lastweeksale_allamount'] = Db::table('so_headers_all')->where('creation_date', '>=', $lastWeekStart)->where('creation_date', '<=', $lastWeekEnd)->sum('order_all_amount');// 计算周涨幅比率if ($data['lastweeksale_allamount'] == 0) {$data['weekchangeRate'] = '无法计算';} else {$data['weekchangeRate'] = ($data['weeksale_allamount'] - $data['lastweeksale_allamount']) / $data['lastweeksale_allamount'] * 100;if ($data['weekchangeRate'] >= 0) {$data['weekchangeRate'] = '+' . number_format($data['weekchangeRate'], 2) . '%';} else {$data['weekchangeRate'] = number_format($data['weekchangeRate'], 2) . '%';}// $data['weekchangeRate'] = number_format(($data['weeksale_allamount'] - $data['lastweeksale_allamount']) / $data['lastweeksale_allamount'] * 100, 2) . '%';}$data['weeksale_allamount'] = number_format($data['weeksale_allamount']/10000.0, 2);// 获取本月的总金额$data['monthsale_allamount'] = Db::table('so_headers_all')->where('creation_date', '>=', $thisMonthStart)->where('creation_date', '<=', $thisMonthEnd)->sum('order_all_amount');// 获取上一个月的总金额$data['lastmonthsale_allamount'] = Db::table('so_headers_all')->where('creation_date', '>=', $lastMonthStart)->where('creation_date', '<=', $lastMonthEnd)->sum('order_all_amount');// 计算月涨幅比率if ($data['lastmonthsale_allamount'] == 0) {$data['monthchangeRate'] = '无法计算';} else {$data['monthchangeRate'] = ($data['monthsale_allamount'] - $data['lastmonthsale_allamount']) / $data['lastmonthsale_allamount'] * 100;if ($data['monthchangeRate'] >= 0) {$data['monthchangeRate'] = '+' . number_format($data['monthchangeRate'], 2) . '%';} else {$data['monthchangeRate'] = number_format($data['monthchangeRate'], 2) . '%';}// $data['monthchangeRate'] = number_format(($data['monthsale_allamount'] - $data['lastmonthsale_allamount']) / $data['lastmonthsale_allamount'] * 100, 2) . '%';}$data['monthsale_allamount'] = number_format($data['monthsale_allamount']/10000.0, 2);// 获取今年的总金额$data['yearsale_allamount'] = Db::table('so_headers_all')->where('creation_date', '>=', $thisYearStart)->where('creation_date', '<=', $thisYearEnd)->sum('order_all_amount');// 获取去年的总金额$data['lastyearsale_allamount'] = Db::table('so_headers_all')->where('creation_date', '>=', $lastYearStart)->where('creation_date', '<=', $lastYearEnd)->sum('order_all_amount');// 计算年涨幅if ($data['lastyearsale_allamount'] == 0) {$data['yearchangeRate'] = '无法计算';} else {$data['yearchangeRate'] = ($data['yearsale_allamount'] - $data['lastyearsale_allamount']) / $data['lastyearsale_allamount'] * 100;if ($data['yearchangeRate'] >= 0) {$data['yearchangeRate'] = '+' . number_format($data['yearchangeRate'], 2) . '%';} else {$data['yearchangeRate'] = number_format($data['yearchangeRate'], 2) . '%';}// $data['yearchangeRate'] = number_format(($data['yearsale_allamount'] - $data['lastyearsale_allamount']) / $data['lastyearsale_allamount'] * 100, 2) . '%';}$data['yearsale_allamount'] = number_format($data['yearsale_allamount']/10000.0, 2);//查询本周每天的的总金额数//获取本周的起始日期和结束日期$weekStart = date('Y-m-d', strtotime('this week Monday'));$weekEnd = date('Y-m-d', strtotime('this week Sunday'));// 构造日期范围数组(从周一到周天)$dateRange = [];$currentDate = $weekStart;while ($currentDate <= $weekEnd) {$dateRange[] = $currentDate;$currentDate = date('Y-m-d', strtotime($currentDate . ' +1 day'));}// 查询每天的总金额数$result = Db::table('so_headers_all')->field("DATE_FORMAT(FROM_UNIXTIME(creation_date), '%Y-%m-%d') AS date, IFNULL(SUM(order_all_amount), 0) AS total_amount")->whereTime('creation_date', '>=', $weekStart)->whereTime('creation_date', '<=', $weekEnd)->group('date')->select();//去掉逗号,转换为foreach ($result as &$item) {$item['total_amount'] = round(($item['total_amount'] / 10000),2);}// 构造最终结果数组$dateArray = [];$totalAmountArray = [];foreach ($dateRange as $date) {$found = false;foreach ($result as $row) {if ($row['date'] == $date) {$dateArray[] = $row['date'];$totalAmountArray[] = $row['total_amount'];$found = true;break;}}if (!$found) {$weekdayIndex = date('w', strtotime($date));$dateArray[] = $date;$totalAmountArray[] = 0;}}$data['week_info']['date'] = $dateArray;$data['week_info']['total_amount'] = $totalAmountArray;//查询今年中每月的总金额数据// 获取当前年份$year = date('Y');$result1 = Db::table('so_headers_all')->field("DATE_FORMAT(FROM_UNIXTIME(creation_date), '%Y-%m') AS month, IFNULL(SUM(order_all_amount), 0) AS total_amount")->whereTime('creation_date', '>=', strtotime($year . '-01-01'))->whereTime('creation_date', '<=', strtotime($year . '-12-31'))->group('month')->select();//去掉逗号,转换为foreach ($result1 as &$item) {$item['total_amount'] = round(($item['total_amount'] / 10000),2);}// 构造最终结果数组$dateArray1 = [];$totalAmountArray1 = [];for ($i = 1; $i <= 12; $i++) {//str_pad 函数用于在字符串的左侧(或右侧)填充指定字符,达到指定长度。这里,使用 str_pad 函数在 $i 左侧填充字符 '0',直到 $i 的长度达到 2。$month = str_pad($i, 2, '0', STR_PAD_LEFT);$dateArray1[] = $year . '-' . $month;$totalAmountArray1[$year . '-' . $month] = 0;}// 将查询结果填充到对应的月份位置foreach ($result1 as $item) {$totalAmountArray1[$item['month']] = $item['total_amount'];}// 最终结果数组foreach ($dateArray1 as $date) {$finalResult[] = ['date' => $date,'total_amount' => $totalAmountArray1[$date]];$data['month_info']['date'][] = $date;$data['month_info']['total_amount'][] = $totalAmountArray1[$date];}//查询近五年总金额数据// 获取当前年份$currentYear = date('Y');// 构造最终结果数组$data['year_info']['date'] = [];$data['year_info']['total_amount'] = [];for ($i = $currentYear - 5; $i <= $currentYear; $i++) {$year = (string) $i;$result = Db::table('so_headers_all')->field("IFNULL(SUM(order_all_amount), 0) AS total_amount")->whereTime('creation_date', '>=', strtotime($year . '-01-01'))->whereTime('creation_date', '<=', strtotime($year . '-12-31'))->find();$totalAmount = round(($result['total_amount'] / 10000), 2);$data['year_info']['date'][] = $year;$data['year_info']['total_amount'][] = $totalAmount;}echo json_encode($data);}重写代码
<template><view><view><view class="title">概况</view><view class="line_position"><view class="line1"><view class="item"><view class="one">今日销售额(万元)</view><view class="two"><view class="left">{{line1_info.daysale_allamount}}</view><view class="right">{{line1_info.daychangeRate}}</view></view><view class="three"><image :src="getImagePath(line1_info.daychangeRate)" alt=""></image></view></view><view class="item"><view class="one">本周销售额(万元)</view><view class="two"><view class="left">{{line1_info.weeksale_allamount}}</view><view class="right">{{line1_info.weekchangeRate}}</view></view><view class="three"><image :src="getImagePath(line1_info.weekchangeRate)" alt=""></image></view></view><view class="item"><view class="one">本月销售额(万元)</view><view class="two"><view class="left">{{line1_info.monthsale_allamount}}</view><view class="right">{{line1_info.monthchangeRate}}</view></view><view class="three"><image :src="getImagePath(line1_info.monthchangeRate)" alt=""></image></view></view><view class="item"><view class="one">今年销售额(万元)</view><view class="two"><view class="left">{{line1_info.yearsale_allamount}}</view><view class="right">{{line1_info.yearchangeRate}}</view></view><view class="three"><image :src="getImagePath(line1_info.yearchangeRate)" alt=""></image></view></view></view></view></view><view><view class="title">销售额统计</view><view class="tab_position"><view class="tab-bar"><text class="tab" :class="{ 'active': activeTab === '0' }" @click="changeTab('0')">周统计</text><text class="tab" :class="{ 'active': activeTab === '1' }" @click="changeTab('1')">月统计</text><text class="tab" :class="{ 'active': activeTab === '2' }" @click="changeTab('2')">年统计</text></view></view><view v-show="activeTab === '0'"><view class="out"><view :prop="option" :change:prop="echarts.updateEcharts" id="echarts" class="echarts"></view></view></view><view v-show="activeTab === '1'"><view class="out"><view :prop="option1" :change:prop="echarts.updateEcharts1" id="echarts1" class="echarts"></view></view></view><view v-show="activeTab === '2'"><view class="out"><view :prop="option2" :change:prop="echarts.updateEcharts2" id="echarts2" class="echarts"></view></view></view></view></view>
</template>
<script>// import echarts from '@/static/js/echarts.js' // 引入文件import * as echarts from 'echarts';export default {data() {return {line1_info: '',down: getApp().globalData.icon + 'report/down.png',up: getApp().globalData.icon + 'report/up.png',line: getApp().globalData.icon + 'report/line.png',activeTab: '0', //默认分页面weekinfo: [], // 定义一个空数组用于存储周统计数据monthinfo: [], // 定义一个空数组用于存储月统计数据yearinfo: [], // 定义一个空数组用于存储年统计数据option: '',option1: '',option2: '',}},mounted() {this.getData(); // 在组件挂载后调用获取数据的方法},methods: {//切换分页面changeTab(index) {this.activeTab = index;},//图片展示getImagePath(rate) {if (rate === "无法计算") {return this.line;} else if (rate && rate.startsWith("-")) {return this.down;} else {return this.up;}},getData() {uni.request({url: getApp().globalData.position + 'Other/select_sale_ekanbaninfo',data: {},header: {"Content-Type": "application/x-www-form-urlencoded"},method: 'POST',dataType: 'json',success: res => {//行1:年月日总额统计this.line1_info = res.data;//行2:周统计var weekinfo = res.data.week_info;this.weekinfo = weekinfo;//行2:月统计var monthinfo = res.data.month_info;this.monthinfo = monthinfo;//行2:年统计var yearinfo = res.data.year_info;this.yearinfo = yearinfo;// console.log(this.yearinfo)//显示图表this.echart();},fail(res) {console.log("查询失败")}});},//绘制图标echart() {// 周统计金额// 提取日期和对应的值var dates = this.weekinfo.date;var values = this.weekinfo.total_amount;var weeks = ["周一", "周二", "周三", "周四", "周五", "周六", "周日"];// 进行图表的配置和数据处理this.option = {//配置网格组件,用于定义图表的位置和大小grid: {top: '15%', // 增加top的值来创建间距left: '2%',right: '2%',bottom: '2%', // 增加bottom的值来创建间距containLabel: true, //自动计算并包含坐标轴标签、刻度和标题等内容在内。},color: ['#e57b7b'],tooltip: {trigger: 'item',axisPointer: {type: 'line'},formatter: function(params) {var value = values[params.dataIndex];var date = dates[params.dataIndex];var week = weeks[params.dataIndex];var marker = params.marker; // 添加marker(小圆点)return marker + ' ' + date + '<br/>' + week + ' : ' + value + '万元';}},xAxis: {// name: '日期',data: weeks,axisLine: {show: false // 隐藏纵坐标轴的横线},//隐藏小刻度短线axisTick: { // x轴刻度相关配置show: false, // 是否显示x轴刻度线},nameTextStyle: {fontSize: 12 // 设置横轴名称字体大小为12}},yAxis: {name: '金额(万元)',splitLine: {show: false // 隐藏纵坐标轴的背景横线},axisLine: {show: false // 隐藏纵坐标轴的竖线},//隐藏小刻度短线axisTick: { // x轴刻度相关配置show: false, // 是否显示x轴刻度线},axisLabel: {fontSize: 12 // 设置横轴标签字体大小为12},nameTextStyle: {fontSize: 12 // 设置横轴名称字体大小为12}},series: [{barWidth: '8',name: '销量',type: 'bar',data: values,itemStyle: {normal: {label: {show: true,position: 'top',textStyle: {// color: '#515dc3',fontSize: 12}}}}}]};//月统计// 月统计金额// 提取日期和对应的值var dates1 = this.monthinfo.date;var values1 = this.monthinfo.total_amount;var months1 = ["01", "02", "03", "04", "05", "06", "07", "08", "09", "10", "11", "12"];var months1_chinese = ["1月", "2月", "3月", "4月", "5月", "6月", "7月", "8月", "9月", "10月", "11月", "12月"];// 进行图表的配置和数据处理this.option1 = {//配置网格组件,用于定义图表的位置和大小grid: {top: '15%', // 增加top的值来创建间距left: '2%',right: '2%',bottom: '2%', // 增加bottom的值来创建间距containLabel: true, //自动计算并包含坐标轴标签、刻度和标题等内容在内。},color: ['#5588d4'],tooltip: {trigger: 'item',axisPointer: {type: 'line'},formatter: function(params) {var value = values1[params.dataIndex];var date = dates1[params.dataIndex];var month = months1_chinese[params.dataIndex];var marker = params.marker; // 添加marker(小圆点)return marker + ' ' + date + '<br/>' + month + ' : ' + value + '万元';}},xAxis: {// name: '日期',data: months1,axisLine: {show: false // 隐藏纵坐标轴的横线},//隐藏小刻度短线axisTick: { // x轴刻度相关配置show: false, // 是否显示x轴刻度线},nameTextStyle: {fontSize: 12 // 设置横轴名称字体大小为12}},yAxis: {name: '金额(万元)',splitLine: {show: false // 隐藏纵坐标轴的背景横线},axisLine: {show: false // 隐藏纵坐标轴的竖线},//隐藏小刻度短线axisTick: { // x轴刻度相关配置show: false, // 是否显示x轴刻度线},axisLabel: {fontSize: 12 // 设置横轴标签字体大小为12},nameTextStyle: {fontSize: 12 // 设置横轴名称字体大小为12}},series: [{barWidth: '6',name: '销量',type: 'bar',data: values1,itemStyle: {normal: {label: {show: true,position: 'top',textStyle: {// color: '#515dc3',fontSize: 12}}}}}]};//近五年年统计// 年统计金额// 提取日期和对应的值var dates2 = this.yearinfo.date;var values2 = this.yearinfo.total_amount;// 进行图表的配置和数据处理this.option2 = {//配置网格组件,用于定义图表的位置和大小grid: {top: '15%', // 增加top的值来创建间距left: '2%',right: '2%',bottom: '2%', // 增加bottom的值来创建间距containLabel: true, //自动计算并包含坐标轴标签、刻度和标题等内容在内。},color: ['#71aa77'],tooltip: {trigger: 'item',axisPointer: {type: 'line'},formatter: function(params) {var value = values2[params.dataIndex];var date = dates2[params.dataIndex];var marker = params.marker; // 添加marker(小圆点)return marker + ' ' + date + '年' + '<br/>' + value + '万元';}},xAxis: {// name: '日期',data: dates2,axisLine: {show: false // 隐藏纵坐标轴的横线},//隐藏小刻度短线axisTick: { // x轴刻度相关配置show: false, // 是否显示x轴刻度线},nameTextStyle: {fontSize: 12 // 设置横轴名称字体大小为12}},yAxis: {name: '金额(万元)',splitLine: {show: false // 隐藏纵坐标轴的背景横线},axisLine: {show: false // 隐藏纵坐标轴的竖线},//隐藏小刻度短线axisTick: { // x轴刻度相关配置show: false, // 是否显示x轴刻度线},axisLabel: {fontSize: 12 // 设置横轴标签字体大小为12},nameTextStyle: {fontSize: 12 // 设置横轴名称字体大小为12}},series: [{barWidth: '8',name: '销量',type: 'bar',data: values2,itemStyle: {normal: {label: {show: true,position: 'top',textStyle: {// color: '#515dc3',fontSize: 12}}}}}]}},},}
</script>
<!-- 指定脚本类型模块为echarts,语言为renderjs -->
<script module="echarts" lang="renderjs">let myChartlet myChart1let myChart2export default {mounted() {// 首先判断window.echarts是否存在,如果存在则调用initEcharts1方法进行初始化。if (typeof window.echarts === 'function') {this.initEcharts()this.initEcharts1()this.initEcharts2()} else {// 如果不存在,则动态创建一个<script>标签,并设置其src属性为static/js/echarts.js,然后在加载完成后调用initEcharts方法。// 动态引入较大类库避免影响页面展示const script = document.createElement('script')script.src = 'static/js/echarts.js'script.onload = function() {this.initEcharts()this.initEcharts1()this.initEcharts2()}.bind(this)document.head.appendChild(script)}},methods: {initEcharts() {myChart = echarts.init(document.getElementById('echarts'))},initEcharts1() {myChart1 = echarts.init(document.getElementById('echarts1'))},initEcharts2() {myChart2 = echarts.init(document.getElementById('echarts2'))},updateEcharts(newValue, oldValue, ownerInstance, instance) {if (myChart != undefined) {myChart.setOption(newValue)}},updateEcharts1(newValue, oldValue, ownerInstance, instance) {if (myChart1 != undefined) {myChart1.setOption(newValue)}},updateEcharts2(newValue, oldValue, ownerInstance, instance) {if (myChart2 != undefined) {myChart2.setOption(newValue)}},}}
</script>
<style lang="scss">//第一行内容.title {// border:1px solid black;padding-left: 2%;font-size: 105%;}.line_position {overflow-x: scroll;scroll-behavior: smooth; // 设置滚动平滑过渡//隐藏滚动条&::-webkit-scrollbar {width: 0; // 隐藏默认的滚动条 height: 0;}&::-webkit-scrollbar-thumb {background-color: transparent; // 隐藏滚动条拖拽的小方块}.line1 {width: 400%;display: flex;// border:1px solid red;.item:nth-child(1) {background-color: #515dc3;}.item:nth-child(2) {background-color: #ff9a3e;}.item:nth-child(3) {background-color: #38bf80;}.item:nth-child(4) {background-color: #fc5959;}.item {width: 40%;margin: 1% 2%;border-radius: 5px;padding: 1% 1% 0 1%;// border:1px solid red;color: white;.two {display: flex;margin: 5% 0;align-items: center;// border:1px solid red;.left {width: 70%;font-size: 24px;// border:1px solid red;}.right {text-align: right;width: 30%;// border:1px solid red;}}.three {text-align: center;// border:1px solid red;image {width: 60px;height: 50px;}}}}}//第二行内容.tab_position {width: 100%;display: flex;justify-content: center;}.tab-bar {display: flex;justify-content: space-between;width: 90%;// border: 1px solid black;background-color: #f2f2f2;border-radius: 15px;margin: 3% 1%;}.tab {padding: 5px;font-size: 16px;cursor: pointer;// border: 1px solid black;width: 33%;text-align: center;// border-bottom: 1px solid #ccc;}.active {color: white;background-color: #515dc3;border-radius: 15px;/* background-color:#74bfe7; */// border-bottom: 1px solid #74bfe7;}//图标.out {width: 100%;display: flex;justify-content: center;}.echarts{width: 700rpx;height: 600rpx;}
</style>
相关文章:
uni-app:实现页面效果4(echarts数据可视化)
效果 代码 <template><view><view><view class"title">概况</view><view class"line_position"><view class"line1"><view class"item"><view class"one">今日销售…...

vue实现echarts中 9种 折线图图例
let datas [{ DivideScore: 7, UserScore: 7.2, Name: 目标制定 },{ DivideScore: 7, UserScore: 7, Name: 具体性 },{ DivideScore: 7, UserScore: 7.5, Name: 可衡量性 },{ DivideScore: 7, UserScore: 7, Name: 可实现性 },{ DivideScore: 7, UserScore: 7, Name: 时间限定…...
redis实战-实现用户签到UV统计
BitMap功能演示 我们针对签到功能完全可以通过mysql来完成,比如说以下这张表 用户一次签到,就是一条记录,假如有1000万用户,平均每人每年签到次数为10次,则这张表一年的数据量为 1亿条 每签到一次需要使用(…...

作为创始人的价值观与心法,构建系统
价值观 绿色、健康、有趣、感恩、谦卑、责任、勇气、客观、冷静、自洽、尊重、价值、服务、善良、利他 作为co-founder衡量的一个很重要的标准就是这个人的人品,大家一起做事情的体验要好,才能有large energy,且流通。 乐观、通达…...

Go语言基础面经
1.go语言编程的好处是什么 编译和运行都很快。 在语言层级支持并行操作。 有垃圾处理器。 内置字符串和 maps。 函数是 go 语言的最基本编程单位。 2.说说go语言的select机制 select 机制用来处理异步 IO 问题 select 机制最大的一条限制就是每个 case 语句里必须是一个…...
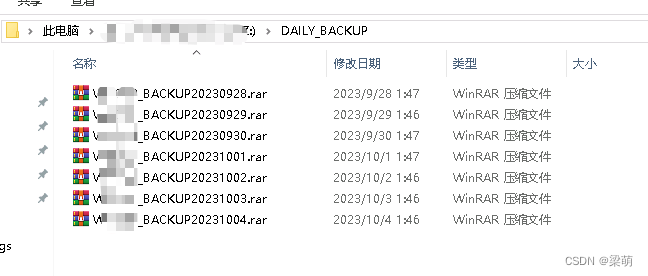
服务器文件备份
服务器上,做好跟应用程序有关的文件备份(一般备份到远程的盘符),有助于当服务器发生硬件等故障时,可以对系统进行进行快速恢复。 下面以Windows服务器为例,记录如何做文件的备份操作。 具体操作如下&#…...

剑指offer——JZ68 二叉搜索树的最近公共祖先 解题思路与具体代码【C++】
一、题目描述与要求 二叉搜索树的最近公共祖先_牛客题霸_牛客网 (nowcoder.com) 题目描述 给定一个二叉搜索树, 找到该树中两个指定节点的最近公共祖先。 1.对于该题的最近的公共祖先定义:对于有根树T的两个节点p、q,最近公共祖先LCA(T,p,q)表示一个节点x&#…...
[Spring] @Bean 修饰方法时如何注入参数
目录 一、Bean 的简单使用 1、正常情况 2、问题提出 二、解决方案 1、Qualifier 2、直接写方法名 三、特殊情况 1、DataSource 一、Bean 的简单使用 在开发中,基于 XML 文件配置 Bean 对象的做法非常繁琐且不好维护,因此绝大部分情况下都是使用…...

docker拉取镜像错误 missing signature key
您正在尝试使用 yum 在 CentOS 或 RHEL 系统上安装 docker-ce,但您遇到了一些问题。根据您提供的输出,这里有几个需要注意的点: 系统未注册: "This system is not registered with an entitlement server" 指示您的系统未注册。对于…...

基于可解释性特征矩阵与稀疏采样全局特征组合的人体行为识别
论文还未发表,不细说,欢迎讨论。 Title: A New Solution to Skeleton-Based Human Action Recognition via the combination usage of explainable feature extraction and sparse sampling global features. Abstract: With the development of deep …...

OpenCV4(C++)—— 仿射变换、透射变换和极坐标变换
文章目录 一、仿射变换1. getRotationMatrix2D()2. warpAffine() 二、透射变换三、极坐标变换 一、仿射变换 在OpenCV中没有专门用于图像旋转的函数,而是通过图像的仿射变换实现图像的旋转。实现图像的旋转首先需要确定旋转角度和旋转中心,之后确定旋转…...
与Add()区别;)
http.header.Set()与Add()区别;
在Go语言中进行HTTP请求时,http.Header对象表示HTTP请求或响应的头部信息。http.Header是一个map[string][]string类型的结构,用于存储键值对,其中键表示HTTP头字段的名称,值是一个字符串切片,可以存储多个相同名称的头…...

vue-7-vuex
一、Vuex 概述 目标:明确Vuex是什么,应用场景以及优势 1.是什么 Vuex 是一个 Vue 的 状态管理工具,状态就是数据。 大白话:Vuex 是一个插件,可以帮我们管理 Vue 通用的数据 (多组件共享的数据)。例如:购…...
SSO单点登录和OAuth2.0区别
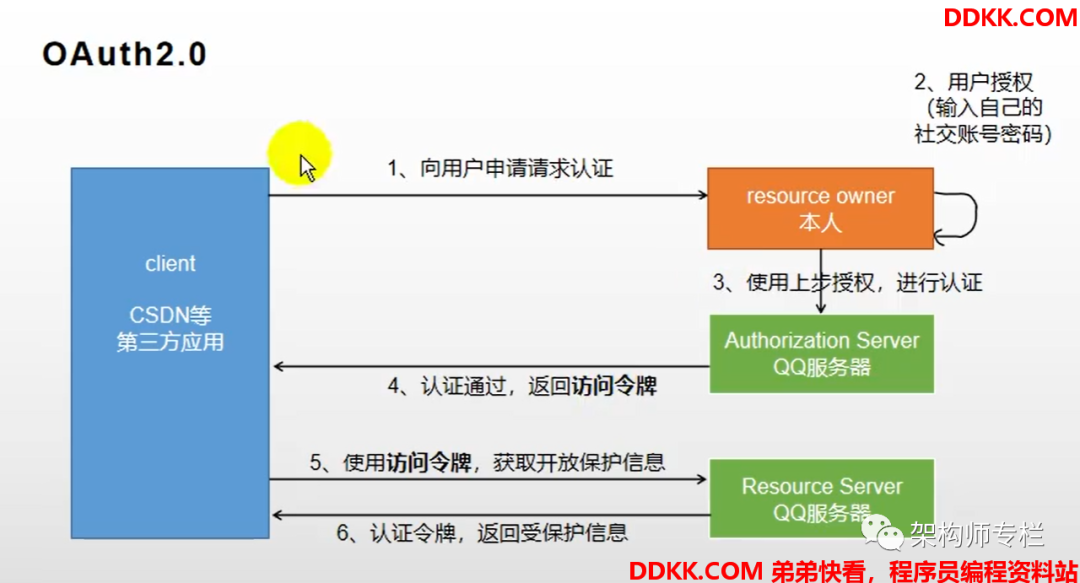
一、概述 SSO是Single Sign On的缩写,OAuth是Open Authority的缩写,这两者都是使用令牌的方式来代替用户密码访问应用。流程上来说他们非常相似,但概念上又十分不同。SSO大家应该比较熟悉,它将登录认证和业务系统分离,…...

【轻松玩转MacOS】基本操作篇
引言 本文是系列的开篇,我将为大家介绍MacOS的基本操作。对于初次接触MacOS的用户来说,掌握这些基本操作是必不可少的。无论是启动和关机,还是使用键盘和鼠标,或者是快捷键的使用,这些基本操作都是你开始使用MacOS的第…...

华为ICT——第三章图像处理基本任务
目录 1:数字图像处理的层次:(处理-分析-理解)顺序不能错: 2:图像处理(图像处理过程): 3:图像分析(特征提取): 4&#x…...
引用的用法总结)
(C++)引用的用法总结
引用(reference)是C极为重要的一部分,本文对其用法进行简单总结。 1. 引用的基本用法 引用的关键字为&,表示取地址的意思,引用变量定义如下: int m 1; int &n m; //定义 cout<<"n:…...

Charles:移动端抓包 / windows客户端 iOS手机 / 手机访问PC本地项目做调试
一、背景描述 1.1、本文需求:移动端进行抓包调试 1.2、理解Charles可以做什么 Charles是一款跨平台的网络代理软件,可以用于捕获和分析网络流量,对HTTP、HTTPS、HTTP/2等协议进行调试和监控。使用Charles可以帮助开发人员进行Web开发、调试…...
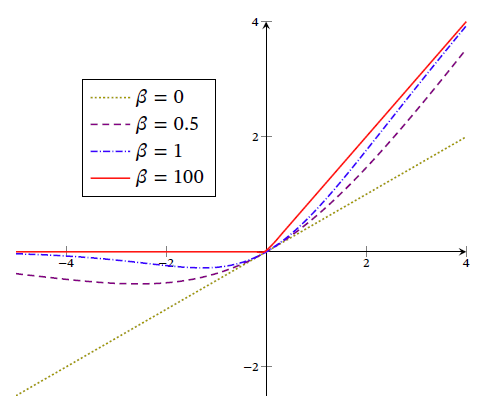
【AI】深度学习——人工智能、深度学习与神经网络
文章目录 0.1 如何开发一个AI系统0.2 表示学习(特征处理)0.2.1 传统特征学习特征选择过滤式包裹式 L 1 L_1 L1 正则化 特征抽取监督的特征学习无监督的特征学习 特征工程作用 0.2.2 语义鸿沟0.2.3 表示方式关联 0.2.4 表示学习对比 0.3 深度学习0.3.1 表示学习与深度学习0.3.…...
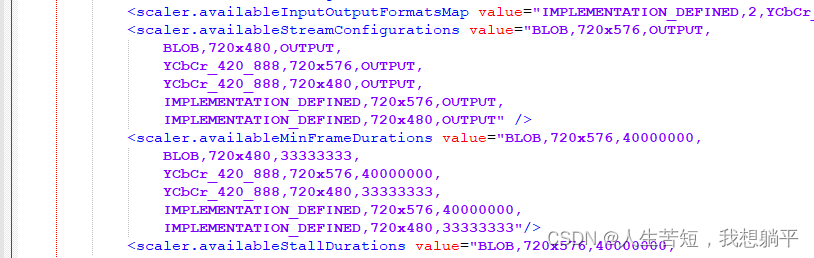
RK3288:BT656 RN6752调试
这篇文章主要想介绍一下再RK3288平台上面调试BT656 video in的注意事项。以RN6752转接芯片,android10平台为例进行介绍。 目录 1. RK3288 VIDEO INPUT 并口 2. 驱动调试 2.1 RN6752 驱动实现 ①rn6752_g_mbus_config总线相关配置 ②rn6752_querystd配置制式 …...

Cesium Terrain Builder实战:如何关闭zib压缩提升浏览器渲染性能
Cesium Terrain Builder实战:关闭zib压缩优化浏览器渲染性能的完整指南 当你在使用Cesium.js构建三维地理可视化应用时,是否遇到过地形加载缓慢、浏览器卡顿的问题?这很可能与地形瓦片的压缩方式有关。本文将深入探讨如何通过关闭zib压缩来显…...
- Select下拉框操作)
Web自动化测试(02)- Select下拉框操作
下拉框操作 下拉框操作练习网站:https://www.w3schools.com/tags/tryit.asp?filenametryhtml_select 1 select标签的下拉框处理 1.1 导入模块/类(select) from selenium.webdriver.support.select import Select# 或from selenium.webdri…...

One-Fox工具箱V7魔改版:从简约UI到代码透明的二次开发指南
1. One-Fox工具箱V7魔改版初体验 第一次打开One-Fox工具箱V7魔改版时,最直观的感受就是界面变得清爽多了。相比之前版本略显杂乱的布局,V7采用了极简的扁平化设计,所有工具图标都重新绘制过,配色从原来的高饱和度变成了更柔和的莫…...

别再只用散点图了!用Seaborn的kdeplot函数,5分钟搞定双变量密度可视化
双变量密度可视化进阶指南:用Seaborn解锁数据洞察新维度 当面对海量数据点时,传统的散点图往往变成一团模糊的噪点——这正是数据分析师在探索性分析(EDA)阶段最常见的可视化困境。我曾在一个电商用户行为分析项目中深有体会&…...

【2025深度测评】实测7款降AI率工具,轻松把论文AI率从99%降到5%!
【2025深度测评】实测7款降AI率工具,轻松把论文AI率从99%降到5%! 【摘要】本文测评7款论文降AI率工具,重点推荐SpeedAI科研小助手(最低1.2元/千字)可将AI率从99%降至个位数,保留完整格式且专业度不减&#…...
)
告别‘纸片感’!用C++手撸一个带虚焦模糊的光线追踪相机(附完整代码)
告别‘纸片感’!用C手撸一个带虚焦模糊的光线追踪相机(附完整代码) 你是否曾经觉得自己的光线追踪渲染图缺少一丝真实感?那些完美聚焦的物体虽然清晰,却总给人一种"纸片"般的扁平感。今天,我们将…...

探索模糊PID主动悬架模型:汽车平顺性仿真的奇妙之旅
【模糊PID主动悬架模型】采用模糊PID控制的二自由度(1/4)主动悬架模型,可以自适应调整PID的参数,以悬架动挠度为控制目标,输入为C级随机路面激励,输出为车身垂向加速度、轮胎动载荷、悬架动挠度等平顺性评价…...
)
用HTML5 Canvas和原生JS手搓一个Emoji消消乐(附完整源码和算法解析)
用HTML5 Canvas和原生JS手搓一个Emoji消消乐(附完整源码和算法解析) 在移动游戏风靡的今天,消除类游戏因其简单易上手、又兼具策略性的特点,始终占据着一席之地。作为前端开发者,自己动手实现一个消除游戏不仅能巩固Ca…...
定制化Chromedriver编译——彻底规避Selenium指纹检测)
023.(实战)定制化Chromedriver编译——彻底规避Selenium指纹检测
1. 为什么需要定制化Chromedriver? 如果你用过Selenium做爬虫或者自动化测试,大概率遇到过被网站识别为机器人的情况。我自己就踩过这个坑——明明代码写得没问题,目标网站却总是返回验证码或者直接封禁IP。后来排查发现,问题出在…...

岐金兰的回应:欣慰、期待与一扇未开的门
岐金兰的回应:欣慰、期待与一扇未开的门读完Google DeepMind团队在《Nature》上发表的这篇《大语言模型道德能力评估路线图》,我坐在书桌前沉默了很久。沉默不是因为震撼,而是因为一种复杂的情绪——欣慰、期待,还有一丝隐隐的“果…...