跟随鼠标动态显示线上点的值(基于Qt的开源绘图控件QCustomPlot进行二次开发)
本文为转载
原文链接:
采用Qt快速绘制多条曲线(折线),跟随鼠标动态显示线上点的值(基于Qt的开源绘图控件QCustomPlot进行二次开发)
内容如下
QCustomPlot是一个开源的基于Qt的第三方绘图库,能够绘制漂亮的2D图形。
QCustomPlot的官方网址:Qt Plotting Widget QCustomPlot - Introduction
从官网下载QCustomPlot的源文件,包括qcustomplot.h和qcustomplot.cpp。
本程序的源码下载地址: https://github.com/xiongxw/XCustomPlot.git
1 自定义鼠标显示跟随类XxwTracer和XxwTraceLine:
XxwTracer用于在图表中显示鼠标所在位置的x,y值
XxwTraceLine用于在图中显示水平或垂直的虚线
头文件XxwTracer.h
#ifndef MYTRACER_H
#define MYTRACER_H#include <QObject>
#include "qcustomplot.h"///
/// \brief The XxwTracer class:在图表中显示鼠标所在位置的x,y值的追踪显示器
///
class XxwTracer : public QObject
{
Q_OBJECTpublic:
enum TracerType
{XAxisTracer,//依附在x轴上显示x值YAxisTracer,//依附在y轴上显示y值DataTracer//在图中显示x,y值
};explicit XxwTracer(QCustomPlot *_plot, TracerType _type, QObject *parent = Q_NULLPTR);~XxwTracer();
void setPen(const QPen &pen);
void setBrush(const QBrush &brush);
void setText(const QString &text);
void setLabelPen(const QPen &pen);
void updatePosition(double xValue, double yValue);void setVisible(bool m_visible);protected:bool m_visible;//是否可见TracerType m_type;//类型QCustomPlot *m_plot;//图表QCPItemTracer *m_tracer;//跟踪的点QCPItemText *m_label;//显示的数值QCPItemLine *m_arrow;//箭头
};///
/// \brief The XxwCrossLine class:用于显示鼠标移动过程中的鼠标位置的直线
///
class XxwTraceLine : public QObject
{
public:enum LineType{VerticalLine,//垂直线HorizonLine, //水平线Both//同时显示水平和垂直线};explicit XxwTraceLine(QCustomPlot *_plot, LineType _type = VerticalLine, QObject *parent = Q_NULLPTR);~XxwTraceLine();void initLine();void updatePosition(double xValue, double yValue);void setVisible(bool vis){if(m_lineV)m_lineV->setVisible(vis);if(m_lineH)m_lineH->setVisible(vis);}protected:bool m_visible;//是否可见LineType m_type;//类型QCustomPlot *m_plot;//图表QCPItemStraightLine *m_lineV; //垂直线QCPItemStraightLine *m_lineH; //水平线
};#endif // MYTRACER_H
源文件MyTracer.cpp
#include "MyTracer.h"XxwTracer::XxwTracer(QCustomPlot *_plot, TracerType _type, QObject *parent): QObject(parent),m_plot(_plot),m_type(_type)
{m_visible = true;m_tracer = Q_NULLPTR;// 跟踪的点m_label = Q_NULLPTR;// 显示的数值m_arrow = Q_NULLPTR;// 箭头if (m_plot){QColor clrDefault(Qt::red);QBrush brushDefault(Qt::NoBrush);QPen penDefault(clrDefault);//        penDefault.setBrush(brushDefault);penDefault.setWidthF(0.5);m_tracer = new QCPItemTracer(m_plot);m_tracer->setStyle(QCPItemTracer::tsCircle);m_tracer->setPen(penDefault);m_tracer->setBrush(brushDefault);m_label = new QCPItemText(m_plot);m_label->setLayer("overlay");m_label->setClipToAxisRect(false);m_label->setPadding(QMargins(5, 5, 5, 5));m_label->setBrush(brushDefault);m_label->setPen(penDefault);m_label->position->setParentAnchor(m_tracer->position);
//        m_label->setFont(QFont("宋体", 8));m_label->setFont(QFont("Arial", 8));m_label->setColor(clrDefault);m_label->setText("");m_arrow = new QCPItemLine(m_plot);QPen  arrowPen(clrDefault, 1);m_arrow->setPen(penDefault);m_arrow->setLayer("overlay");m_arrow->setClipToAxisRect(false);m_arrow->setHead(QCPLineEnding::esSpikeArrow);//设置头部为箭头形状switch (m_type){case XAxisTracer:{m_tracer->position->setTypeX(QCPItemPosition::ptPlotCoords);m_tracer->position->setTypeY(QCPItemPosition::ptAxisRectRatio);m_tracer->setSize(7);m_label->setPositionAlignment(Qt::AlignTop | Qt::AlignHCenter);m_arrow->end->setParentAnchor(m_tracer->position);m_arrow->start->setParentAnchor(m_arrow->end);m_arrow->start->setCoords(0, 20);//偏移量break;}case YAxisTracer:{m_tracer->position->setTypeX(QCPItemPosition::ptAxisRectRatio);m_tracer->position->setTypeY(QCPItemPosition::ptPlotCoords);m_tracer->setSize(7);m_label->setPositionAlignment(Qt::AlignRight | Qt::AlignHCenter);m_arrow->end->setParentAnchor(m_tracer->position);m_arrow->start->setParentAnchor(m_label->position);m_arrow->start->setCoords(-20, 0);//偏移量break;}case DataTracer:{m_tracer->position->setTypeX(QCPItemPosition::ptPlotCoords);m_tracer->position->setTypeY(QCPItemPosition::ptPlotCoords);m_tracer->setSize(5);m_label->setPositionAlignment(Qt::AlignLeft | Qt::AlignVCenter);m_arrow->end->setParentAnchor(m_tracer->position);m_arrow->start->setParentAnchor(m_arrow->end);m_arrow->start->setCoords(20, 0);break;}default:break;}setVisible(false);}
}XxwTracer::~XxwTracer()
{if(m_plot){if (m_tracer)m_plot->removeItem(m_tracer);if (m_label)m_plot->removeItem(m_label);if (m_arrow)m_plot->removeItem(m_arrow);}
}void XxwTracer::setPen(const QPen &pen)
{if(m_tracer)m_tracer->setPen(pen);if(m_arrow)m_arrow->setPen(pen);
}void XxwTracer::setBrush(const QBrush &brush)
{if(m_tracer)m_tracer->setBrush(brush);
}void XxwTracer::setLabelPen(const QPen &pen)
{if(m_label){m_label->setPen(pen);m_label->setBrush(Qt::NoBrush);m_label->setColor(pen.color());}
}void XxwTracer::setText(const QString &text)
{if(m_label)m_label->setText(text);
}void XxwTracer::setVisible(bool vis)
{m_visible = vis;if(m_tracer)m_tracer->setVisible(m_visible);if(m_label)m_label->setVisible(m_visible);if(m_arrow)m_arrow->setVisible(m_visible);
}void XxwTracer::updatePosition(double xValue, double yValue)
{if (!m_visible){setVisible(true);m_visible = true;}if (yValue > m_plot->yAxis->range().upper)yValue = m_plot->yAxis->range().upper;switch (m_type){case XAxisTracer:{m_tracer->position->setCoords(xValue, 1);m_label->position->setCoords(0, 15);m_arrow->start->setCoords(0, 15);m_arrow->end->setCoords(0, 0);setText(QString::number(xValue));break;}case YAxisTracer:{m_tracer->position->setCoords(0, yValue);m_label->position->setCoords(-20, 0);
//        m_arrow->start->setCoords(20, 0);
//        m_arrow->end->setCoords(0, 0);setText(QString::number(yValue));break;}case DataTracer:{m_tracer->position->setCoords(xValue, yValue);m_label->position->setCoords(20, 0);setText(QString("x:%1,y:%2").arg(xValue).arg(yValue));break;}default:break;}
}XxwTraceLine::XxwTraceLine(QCustomPlot *_plot, LineType _type, QObject *parent): QObject(parent),m_type(_type),m_plot(_plot)
{m_lineV = Q_NULLPTR;m_lineH = Q_NULLPTR;initLine();
}XxwTraceLine::~XxwTraceLine()
{if(m_plot){if (m_lineV)m_plot->removeItem(m_lineV);if (m_lineH)m_plot->removeItem(m_lineH);}
}void XxwTraceLine::initLine()
{if(m_plot){QPen linesPen(Qt::red, 1, Qt::DashLine);if(VerticalLine == m_type || Both == m_type){m_lineV = new QCPItemStraightLine(m_plot);//垂直线m_lineV->setLayer("overlay");m_lineV->setPen(linesPen);m_lineV->setClipToAxisRect(true);m_lineV->point1->setCoords(0, 0);m_lineV->point2->setCoords(0, 0);}if(HorizonLine == m_type || Both == m_type){m_lineH = new QCPItemStraightLine(m_plot);//水平线m_lineH->setLayer("overlay");m_lineH->setPen(linesPen);m_lineH->setClipToAxisRect(true);m_lineH->point1->setCoords(0, 0);m_lineH->point2->setCoords(0, 0);}}
}void XxwTraceLine::updatePosition(double xValue, double yValue)
{if(VerticalLine == m_type || Both == m_type){if(m_lineV){m_lineV->point1->setCoords(xValue, m_plot->yAxis->range().lower);m_lineV->point2->setCoords(xValue, m_plot->yAxis->range().upper);}}if(HorizonLine == m_type || Both == m_type){if(m_lineH){m_lineH->point1->setCoords(m_plot->xAxis->range().lower, yValue);m_lineH->point2->setCoords(m_plot->xAxis->range().upper, yValue);}}
}
2 自定义的图表类XCustomPlot
XCustomPlot是基于QCustomPlot二次开发的图表类,在鼠标移动过程中动态显示曲线上点的值。
头文件XCustomPlot.h
#ifndef XCUSTOMPLOT_H
#define XCUSTOMPLOT_H#include "XxwTracer.h"
#include "qcustomplot.h"
#include <QObject>
#include <QList>class XxwCustomPlot:public QCustomPlot
{Q_OBJECTpublic:XxwCustomPlot(QWidget *parent = 0);protected:virtual void mouseMoveEvent(QMouseEvent *event);public:////// \brief 设置是否显示鼠标追踪器/// \param show:是否显示///void showTracer(bool show){m_isShowTracer = show;if(m_xTracer)m_xTracer->setVisible(m_isShowTracer);foreach (XxwTracer *tracer, m_dataTracers){if(tracer)tracer->setVisible(m_isShowTracer);}if(m_lineTracer)m_lineTracer->setVisible(m_isShowTracer);}////// \brief 是否显示鼠标追踪器/// \return///bool isShowTracer(){return m_isShowTracer;};private:bool m_isShowTracer;//是否显示追踪器(鼠标在图中移动,显示对应的值)XxwTracer *m_xTracer;//x轴XxwTracer *m_yTracer;//y轴QList<XxwTracer *> m_dataTracers;//XxwTraceLine  *m_lineTracer;//直线
};#endif // XCUSTOMPLOT_H
源文件XCustomPlot.h
#include "XxwCustomPlot.h"XxwCustomPlot::XxwCustomPlot(QWidget *parent):QCustomPlot(parent),m_isShowTracer(false),m_xTracer(Q_NULLPTR),m_yTracer(Q_NULLPTR),m_dataTracers(QList<XxwTracer *>()),m_lineTracer(Q_NULLPTR)
{
}void XxwCustomPlot::mouseMoveEvent(QMouseEvent *event)
{QCustomPlot::mouseMoveEvent(event);if(m_isShowTracer){//当前鼠标位置(像素坐标)int x_pos = event->pos().x();int y_pos = event->pos().y();//像素坐标转成实际的x,y轴的坐标float x_val = this->xAxis->pixelToCoord(x_pos);float y_val = this->yAxis->pixelToCoord(y_pos);if(Q_NULLPTR == m_xTracer)m_xTracer = new XxwTracer(this, XxwTracer::XAxisTracer);//x轴m_xTracer->updatePosition(x_val, y_val);if(Q_NULLPTR == m_yTracer)m_yTracer = new XxwTracer(this, XxwTracer::YAxisTracer);//y轴m_yTracer->updatePosition(x_val, y_val);int nTracerCount = m_dataTracers.count();int nGraphCount = graphCount();if(nTracerCount < nGraphCount){for(int i = nTracerCount; i < nGraphCount; ++i){XxwTracer *tracer = new XxwTracer(this, XxwTracer::DataTracer);m_dataTracers.append(tracer);}}else if(nTracerCount > nGraphCount){for(int i = nGraphCount; i < nTracerCount; ++i){XxwTracer *tracer = m_dataTracers[i];if(tracer){tracer->setVisible(false);}}}for (int i = 0; i < nGraphCount; ++i){XxwTracer *tracer = m_dataTracers[i];if(!tracer)tracer = new XxwTracer(this, XxwTracer::DataTracer);tracer->setVisible(true);tracer->setPen(this->graph(i)->pen());tracer->setBrush(Qt::NoBrush);tracer->setLabelPen(this->graph(i)->pen());auto iter = this->graph(i)->data()->findBegin(x_val);double value = iter->mainValue();
//            double value = this->graph(i)->data()->findBegin(x_val)->value;tracer->updatePosition(x_val, value);}if(Q_NULLPTR == m_lineTracer)m_lineTracer = new XxwTraceLine(this,XxwTraceLine::Both);//直线m_lineTracer->updatePosition(x_val, y_val);this->replot();//曲线重绘}
}
3 使用自定义图表类XCustomPlot
在需要绘图的地方使用,代码如下:
  m_customPlot = new XxwCustomPlot();m_customPlot->showTracer(true);// add title layout element:m_customPlot->plotLayout()->insertRow(0);m_customPlot->plotLayout()->addElement(0, 0, new QCPTextElement(m_customPlot, "标题", QFont("黑体", 12, QFont::Bold)));m_customPlot->legend->setVisible(true);QFont legendFont = font();  // start out with MainWindow's font..legendFont.setPointSize(9); // and make a bit smaller for legendm_customPlot->legend->setFont(legendFont);m_customPlot->legend->setBrush(QBrush(QColor(255,255,255,230)));// by default, the legend is in the inset layout of the main axis rect. So this is how we access it to change legend placement:m_customPlot->axisRect()->insetLayout()->setInsetAlignment(0, Qt::AlignTop|Qt::AlignCenter);// make left and bottom axes always transfer their ranges to right and top axes:connect(m_customPlot->xAxis, SIGNAL(rangeChanged(QCPRange)), m_customPlot->xAxis2, SLOT(setRange(QCPRange)));connect(m_customPlot->yAxis, SIGNAL(rangeChanged(QCPRange)), m_customPlot->yAxis2, SLOT(setRange(QCPRange)));// Allow user to drag axis ranges with mouse, zoom with mouse wheel and select graphs by clicking:m_customPlot->setInteractions(QCP::iRangeDrag | QCP::iRangeZoom | QCP::iSelectPlottables);// generate some data:int nCount = 100;QVector<double> x(nCount), y0(nCount), y1(nCount); // initialize with entries 0..100for (int i = 0; i < nCount; ++i){x[i] = i; // x goes from -1 to 1y0[i] = qSin(i * 10.0f / nCount); //siny1[i] = qCos(i * 10.0f / nCount); //cos}// create graph and assign data to it:QPen pen;int i = 1;QCPGraph *pGraph = m_customPlot->addGraph();//        m_customPlot->graph(0)->setData(x, y0);pGraph->setName("sin曲线");pGraph->setData(x,y0);pGraph->setPen(QPen(Qt::blue));pGraph = m_customPlot->addGraph();//        m_customPlot->graph(0)->setData(x, y0);pGraph->setName("cos曲线");pGraph->setData(x,y1);pGraph->setPen(QPen(Qt::darkYellow));// give the axes some labels:m_customPlot->xAxis->setLabel("x");m_customPlot->yAxis->setLabel("y");// set axes ranges, so we see all data:
//    m_customPlot->xAxis->setRange(-1, 1);
//    m_customPlot->yAxis->setRange(0, 1);m_customPlot->rescaleAxes(true);m_customPlot->replot();
4 效果图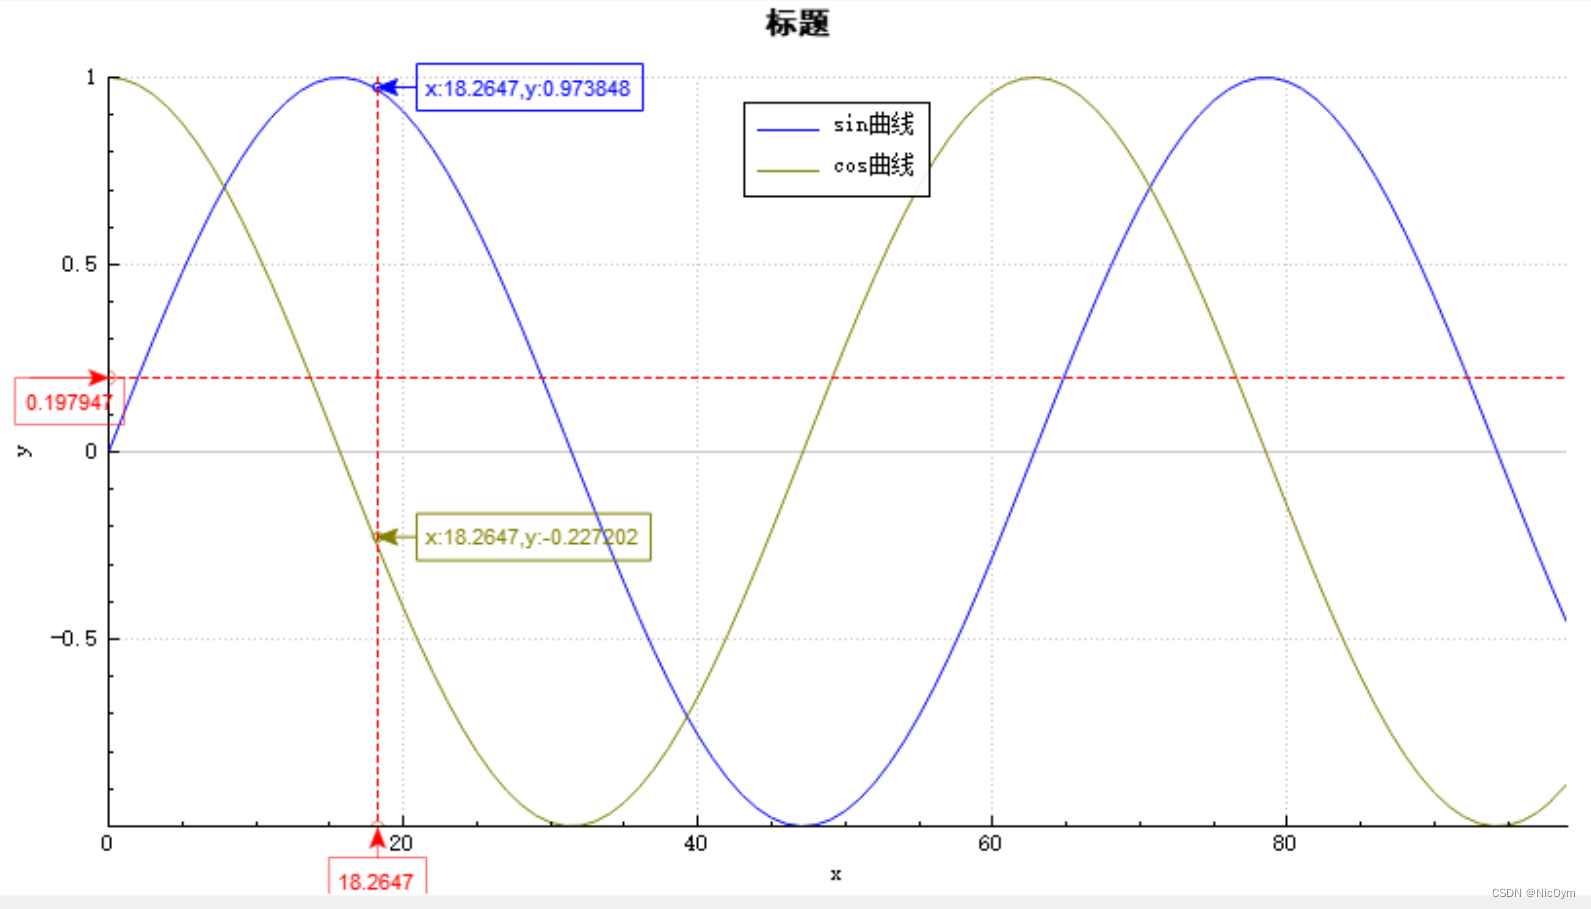
相关文章:
跟随鼠标动态显示线上点的值(基于Qt的开源绘图控件QCustomPlot进行二次开发)
本文为转载 原文链接: 采用Qt快速绘制多条曲线(折线),跟随鼠标动态显示线上点的值(基于Qt的开源绘图控件QCustomPlot进行二次开发) 内容如下 QCustomPlot是一个开源的基于Qt的第三方绘图库,能…...
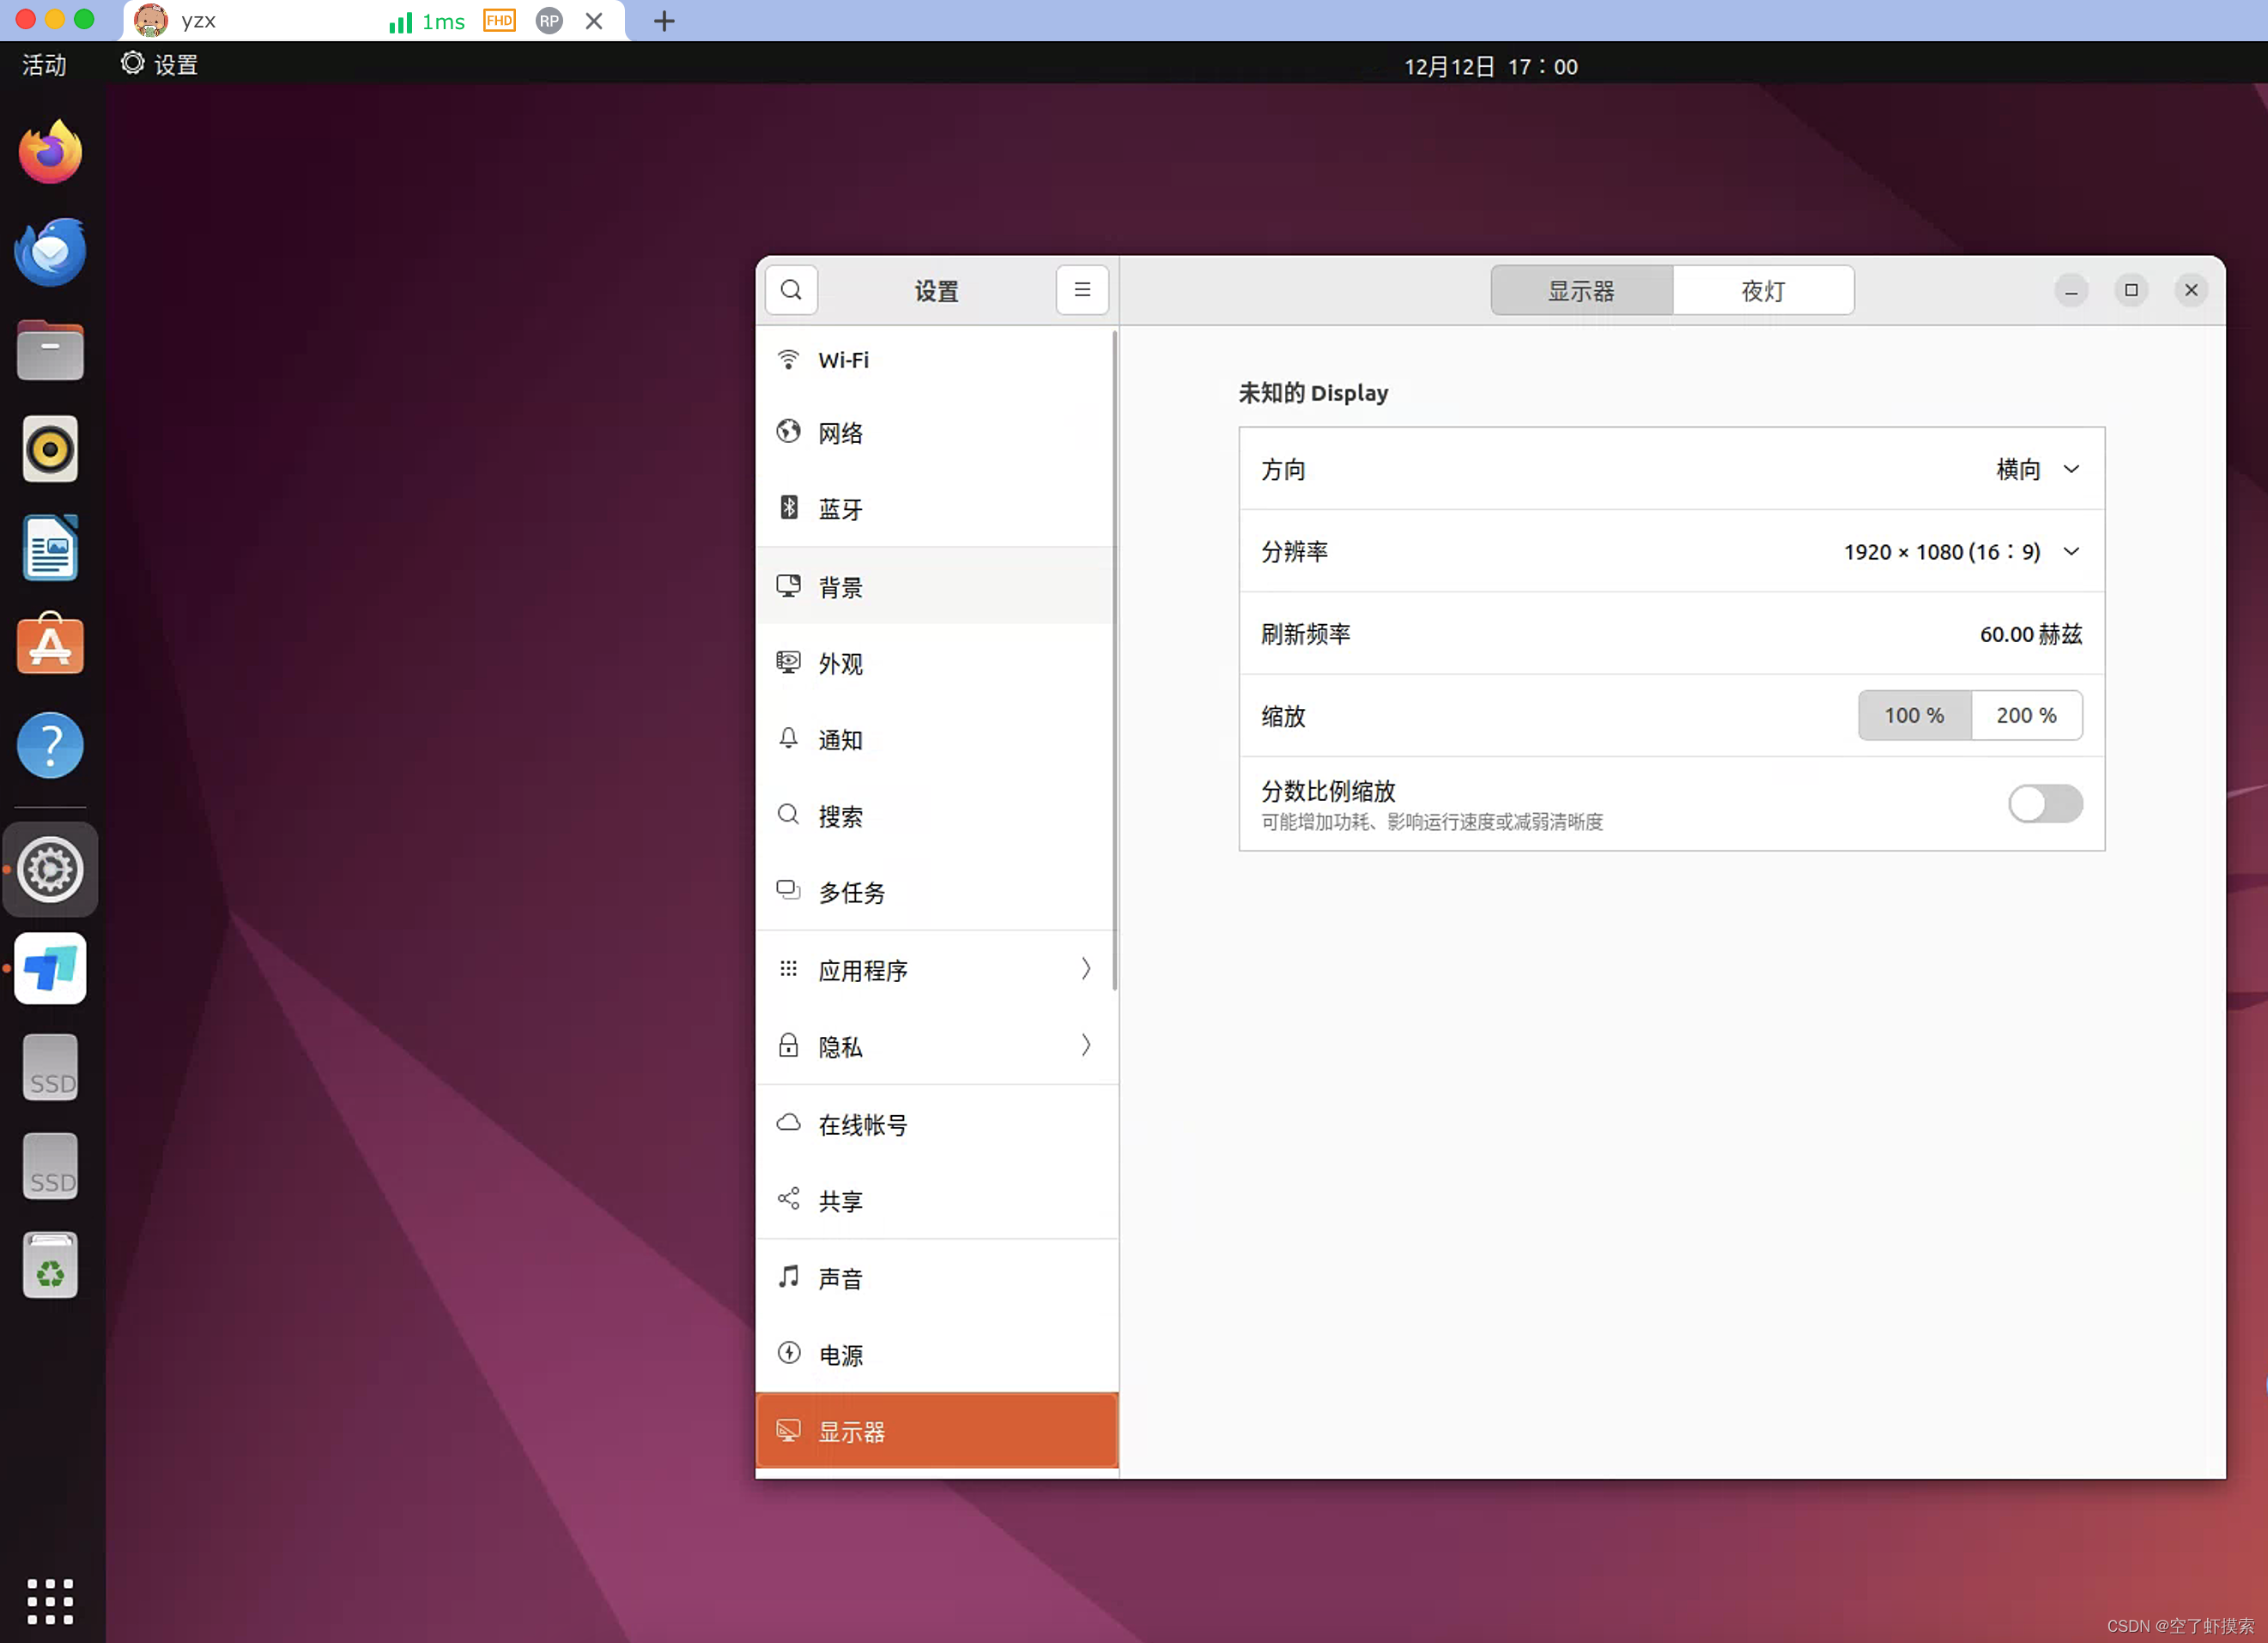
Todesk、向日葵等访问“无显示器”主机黑屏问题解决
我的环境是 ubuntu 22.04 安装 要安装 video dummy,请在终端中运行以下命令: sudo apt install xserver-xorg-video-dummy配置 video dummy 的配置文件请自行搜索 使用任何文本编辑器打开此文件。 我的是 /etc/X11/xorg.conf 默认配置文件包含以下内…...

maven打包插件maven-jar-plugin与spring-boot-maven-plugin
maven几种打包插件介绍 文章目录 🔊1.spring-boot-maven-plugin打包后效果 📕2.maven-jar-plugin打包后效果🖊️最后总结 🔊1.spring-boot-maven-plugin <plugins><plugin><groupId>org.springframework.boot&…...

uniapp微信小程序下载base64图片流或https图片
常规https的图片下载是这样的 const urlPath https://test/logo.png uni.downloadFile({url: urlPath,success(res){// 这时会产生一个临时路径,在应用本次启动期间可以正常使用。if (res.statusCode 200) {// 需要将图片保存到相册uni.saveImageToPhotosAlbum({…...
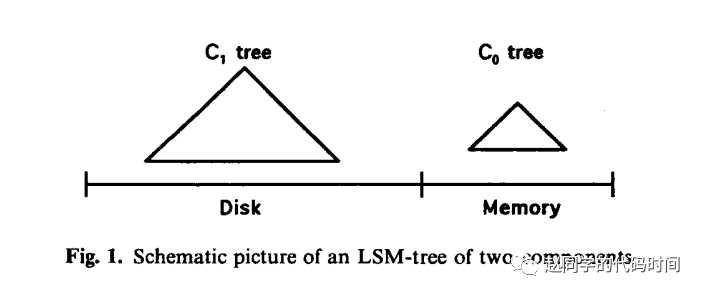
数据结构 | Log-Structured Merge Tree (LSM Tree)
今天介绍LSM Tree这个数据结构,严格意义上来说,他并不像他的名字一样是一棵树型的数据结构,而更多是一种设计思想。 LSM Tree最先在1996年被提出,后来被广泛运用于现代NoSQL(非关系型数据库)系统中…...
)
QEMU源码全解析 —— virtio(9)
接前一篇文章: 上两回讲解了virtio balloon相关类所涉及的realize函数以及大致流程,如下表所示: realize函数parent_dc_realize函数DeviceClassvirtio_pci_dc_realizePCIDeviceClassvirtio_pci_realizeVirtioPCIClassvirtio_balloon_pci_rea…...
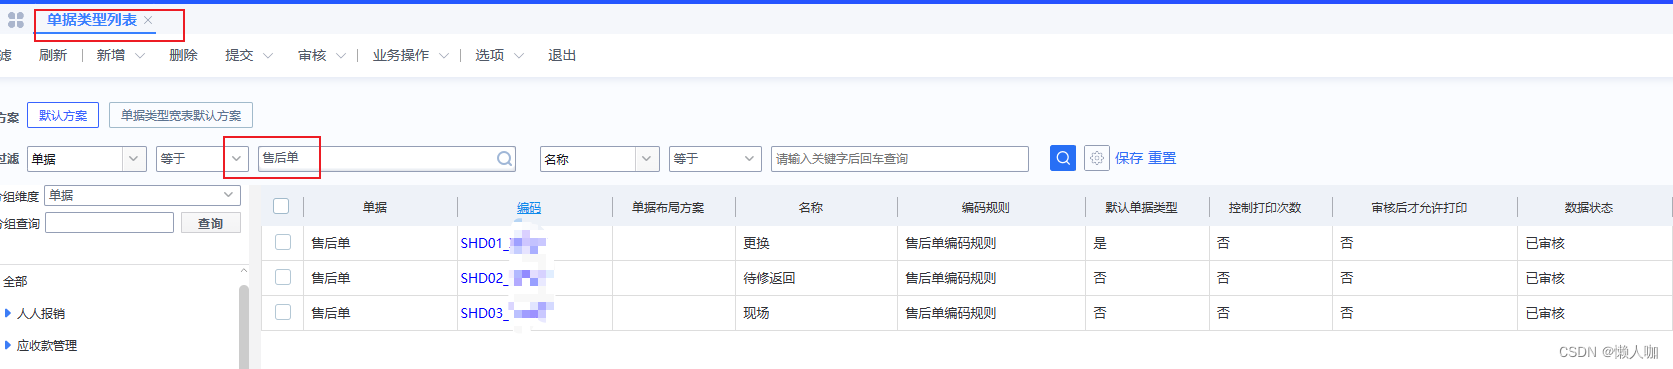
金蝶云星空协同开发环境应用内执行单据类型脚本
文章目录 金蝶云星空协同开发环境应用内执行单据类型脚本业务界面查询单据类型表数据导出数据执行数据库脚本单据类型xml检验是否执行成功检查数据库检查业务数据 金蝶云星空协同开发环境应用内执行单据类型脚本 业务界面 查询单据类型表数据 先使用类型中文在单据类型多语言…...

矩阵理论及其应用邱启荣习题3.5题解
(1) P ( − 1 0 1 − 1 − 1 2 1 1 − 1 ) \begin{pmatrix} -1 & 0&1 \\ -1 & -1&2\\1&1&-1 \end{pmatrix} −1−110−1112−1 A ( 1 0 1 1 1 0 − 1 2 1 ) \begin{pmatrix} 1 & 0&1 \\ 1 & 1&0\\-1&2&1 \end{pmat…...
-------连载(49))
Java面试题(每天10题)-------连载(49)
目录 Tomcat篇 1、Tomcat的缺省端口是多少?怎么修改? 2、Tomcat有哪几种Connector运行模式(优化)? 3、Tomcat有几种部署方式? 4、Tomcat容器时如何创建servlet类实例?用到了什么原理&…...

python——数据类型
数据类型目录 前言一、Number(数字)数字类型转换:二、String(字符串)常用字符串运算符:字符串格式化:三、Tuple(元组)常用运算符四、List(列表)嵌套列表:常用列表操作:五、Dictionary(字典)六、Set(集合)...

hive中如何求取中位数?
目录 中位数的概念代码实现准备数据实现 中位数的概念 中位数(Median)又称中值,统计学中的专有名词,是按顺序排列的一组数据中居于中间位置的数,代表一个样本、种群或概率分布中的一个数值,其可将数值集合…...

在C#中异步编程
在C#中,异步编程是一种编写并发和响应式代码的技术,通过将耗时的操作放在后台线程中执行,以避免阻塞主线程,提高程序的性能和响应性。异步编程使用async和await关键字,结合任务(Task)和异步操作…...

微服务保护--Feign整合Sentinel
限流是一种预防措施,虽然限流可以尽量避免因高并发而引起的服务故障,但服务还会因为其它原因而故障。而要将这些故障控制在一定范围,避免雪崩,就要靠线程隔离(舱壁模式)和熔断降级手段了。 线程隔离之前讲到…...

二进制to十六进制
输入小于等于十六位的二进制数据,输出十六进制数据; #include <stdio.h> #include <stdlib.h> #include <math.h>int main(void) {char arr[16] { 0 }; int array[16] { 0 }; int hex[4] { 0 };int i 0; int num 0;scanf("…...

Logistic 回归算法
Logistic 回归 Logistic 回归算法Logistic 回归简述Sigmoid 函数Logistic 回归模型表达式求解参数 $\theta $梯度上升优化算法 Logistic 回归简单实现使用 sklearn 构建 Logistic 回归分类器Logistic 回归算法的优缺点 Logistic 回归算法 Logistic 回归简述 Logistic 回归是一…...
ubuntu安装详细步骤
一,先下载vmware 1,第一步打开上面链接 下载网址 : https://www.vmware.com/products/workstation-pro/wo rkstation-pro-evaluation.html 许可证 JU090-6039P-08409-8J0QH-2YR7F ZF3R0-FHED2-M80TY-8QYGC-NPKYF FC7D0-D1YDL-M8DXZ-CYPZE-P2AY6 ZC3T…...

力扣5. 最长回文子串
动态规划 思路: 假设 dp[i][j] 为字符串 (i, j) 子串是否为回文的结果;那么 dp[i][j] dp[i 1][j - 1] 且 (s[i] s[j]);长度为1的字符串都是回文; 原字符串长度为1,是回文;原字符串子串长度为1ÿ…...
肆[4],函数VectorToHomMat2d/AffineTransPoint2d
函数VectorToHomMat2d C形式 LIntExport void VectorToHomMat2d( const HTuple& Px, const HTuple& Py, const HTuple& Qx, const HTuple& Qy, HTuple* HomMat2D);//参数1:图像坐标X数组 //参数2:图像坐标Y数组 //参数3:世界坐标X数组 //参数4:世界坐标Y…...

下载文件 后端返回给前端 response header 响应头
当浏览器在请求资源时,会通过http返回头中的content-type决定如何显示/处理将要加载的数据,如果这个类型浏览器能够支持阅览,浏览器就会直接展示该资源,比如png、jpeg、video等格式。在某些下载文件的场景中,服务端可能…...
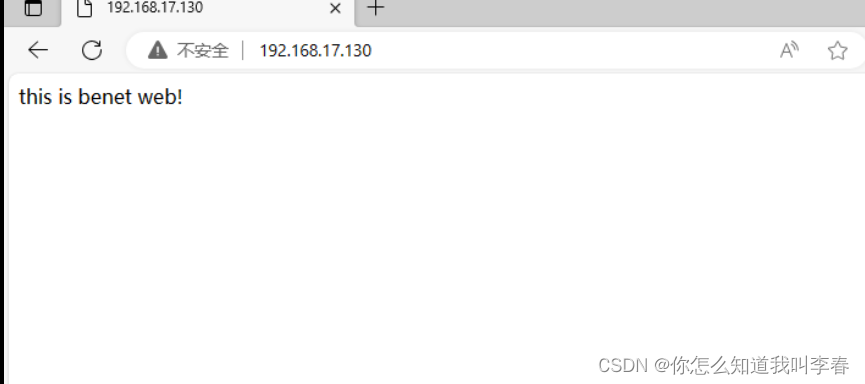
lvs负载均集群
目录 NAT模式 LVS负载均衡群集部署 1.部署共享存储 2.配置节点服务器 192.168.17.130 编辑 192.168.17.133 3.配置负载调度器 4.测试效果 NAT模式 LVS负载均衡群集部署 负载调度器:内网关 ens33:192.168.17.70,外网关 ens36&#x…...

浅谈 React Hooks
React Hooks 是 React 16.8 引入的一组 API,用于在函数组件中使用 state 和其他 React 特性(例如生命周期方法、context 等)。Hooks 通过简洁的函数接口,解决了状态与 UI 的高度解耦,通过函数式编程范式实现更灵活 Rea…...

线程同步:确保多线程程序的安全与高效!
全文目录: 开篇语前序前言第一部分:线程同步的概念与问题1.1 线程同步的概念1.2 线程同步的问题1.3 线程同步的解决方案 第二部分:synchronized关键字的使用2.1 使用 synchronized修饰方法2.2 使用 synchronized修饰代码块 第三部分ÿ…...

Vue2 第一节_Vue2上手_插值表达式{{}}_访问数据和修改数据_Vue开发者工具
文章目录 1.Vue2上手-如何创建一个Vue实例,进行初始化渲染2. 插值表达式{{}}3. 访问数据和修改数据4. vue响应式5. Vue开发者工具--方便调试 1.Vue2上手-如何创建一个Vue实例,进行初始化渲染 准备容器引包创建Vue实例 new Vue()指定配置项 ->渲染数据 准备一个容器,例如: …...
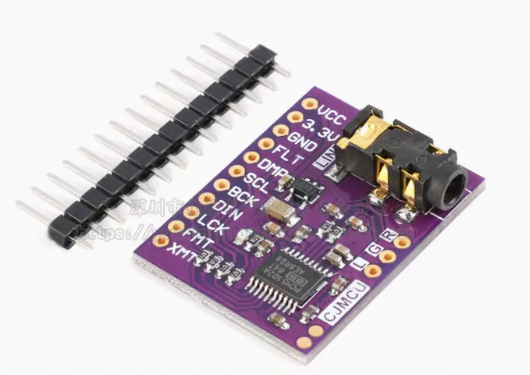
ESP32 I2S音频总线学习笔记(四): INMP441采集音频并实时播放
简介 前面两期文章我们介绍了I2S的读取和写入,一个是通过INMP441麦克风模块采集音频,一个是通过PCM5102A模块播放音频,那如果我们将两者结合起来,将麦克风采集到的音频通过PCM5102A播放,是不是就可以做一个扩音器了呢…...
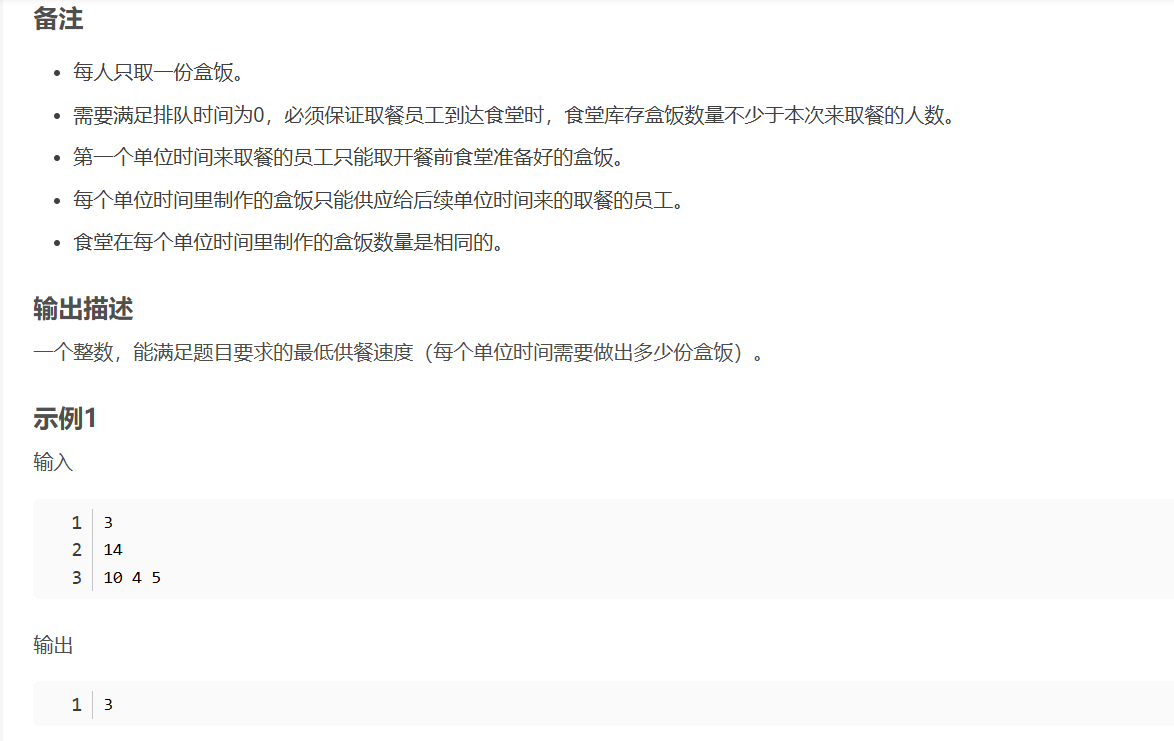
华为OD机试-食堂供餐-二分法
import java.util.Arrays; import java.util.Scanner;public class DemoTest3 {public static void main(String[] args) {Scanner in new Scanner(System.in);// 注意 hasNext 和 hasNextLine 的区别while (in.hasNextLine()) { // 注意 while 处理多个 caseint a in.nextIn…...
指令的指南)
在Ubuntu中设置开机自动运行(sudo)指令的指南
在Ubuntu系统中,有时需要在系统启动时自动执行某些命令,特别是需要 sudo权限的指令。为了实现这一功能,可以使用多种方法,包括编写Systemd服务、配置 rc.local文件或使用 cron任务计划。本文将详细介绍这些方法,并提供…...
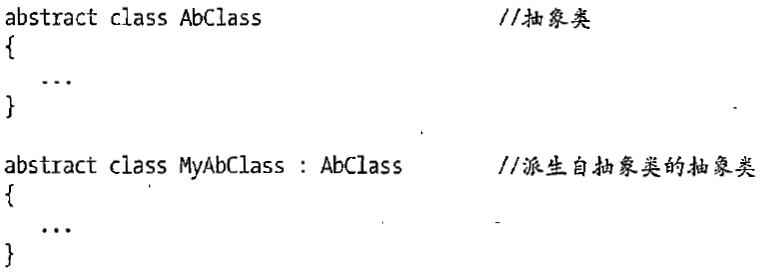
C# 类和继承(抽象类)
抽象类 抽象类是指设计为被继承的类。抽象类只能被用作其他类的基类。 不能创建抽象类的实例。抽象类使用abstract修饰符声明。 抽象类可以包含抽象成员或普通的非抽象成员。抽象类的成员可以是抽象成员和普通带 实现的成员的任意组合。抽象类自己可以派生自另一个抽象类。例…...
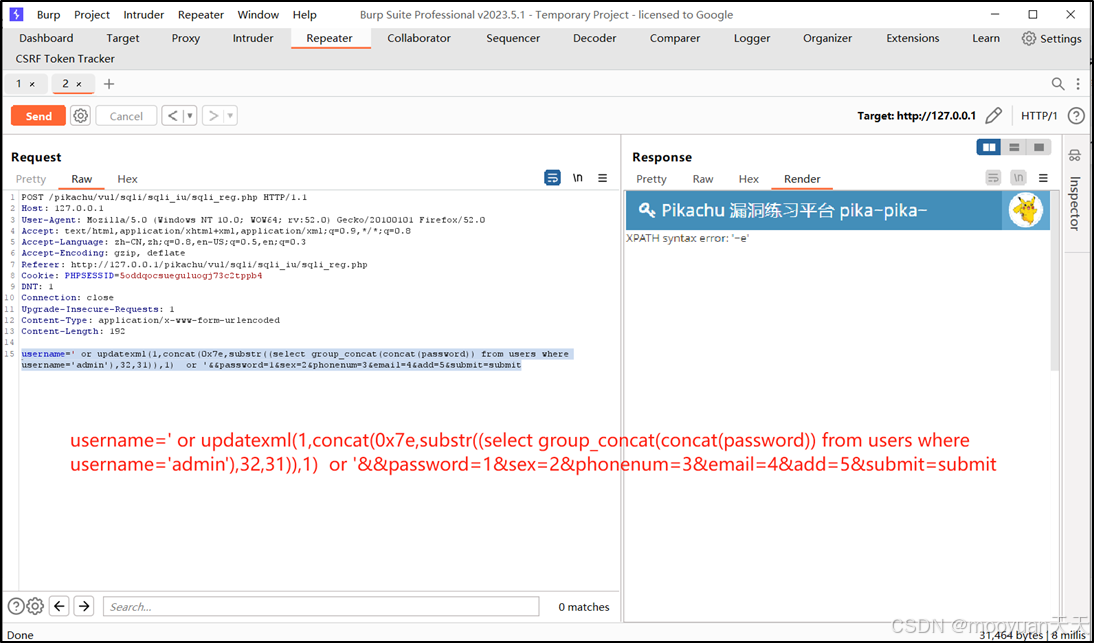
pikachu靶场通关笔记22-1 SQL注入05-1-insert注入(报错法)
目录 一、SQL注入 二、insert注入 三、报错型注入 四、updatexml函数 五、源码审计 六、insert渗透实战 1、渗透准备 2、获取数据库名database 3、获取表名table 4、获取列名column 5、获取字段 本系列为通过《pikachu靶场通关笔记》的SQL注入关卡(共10关࿰…...
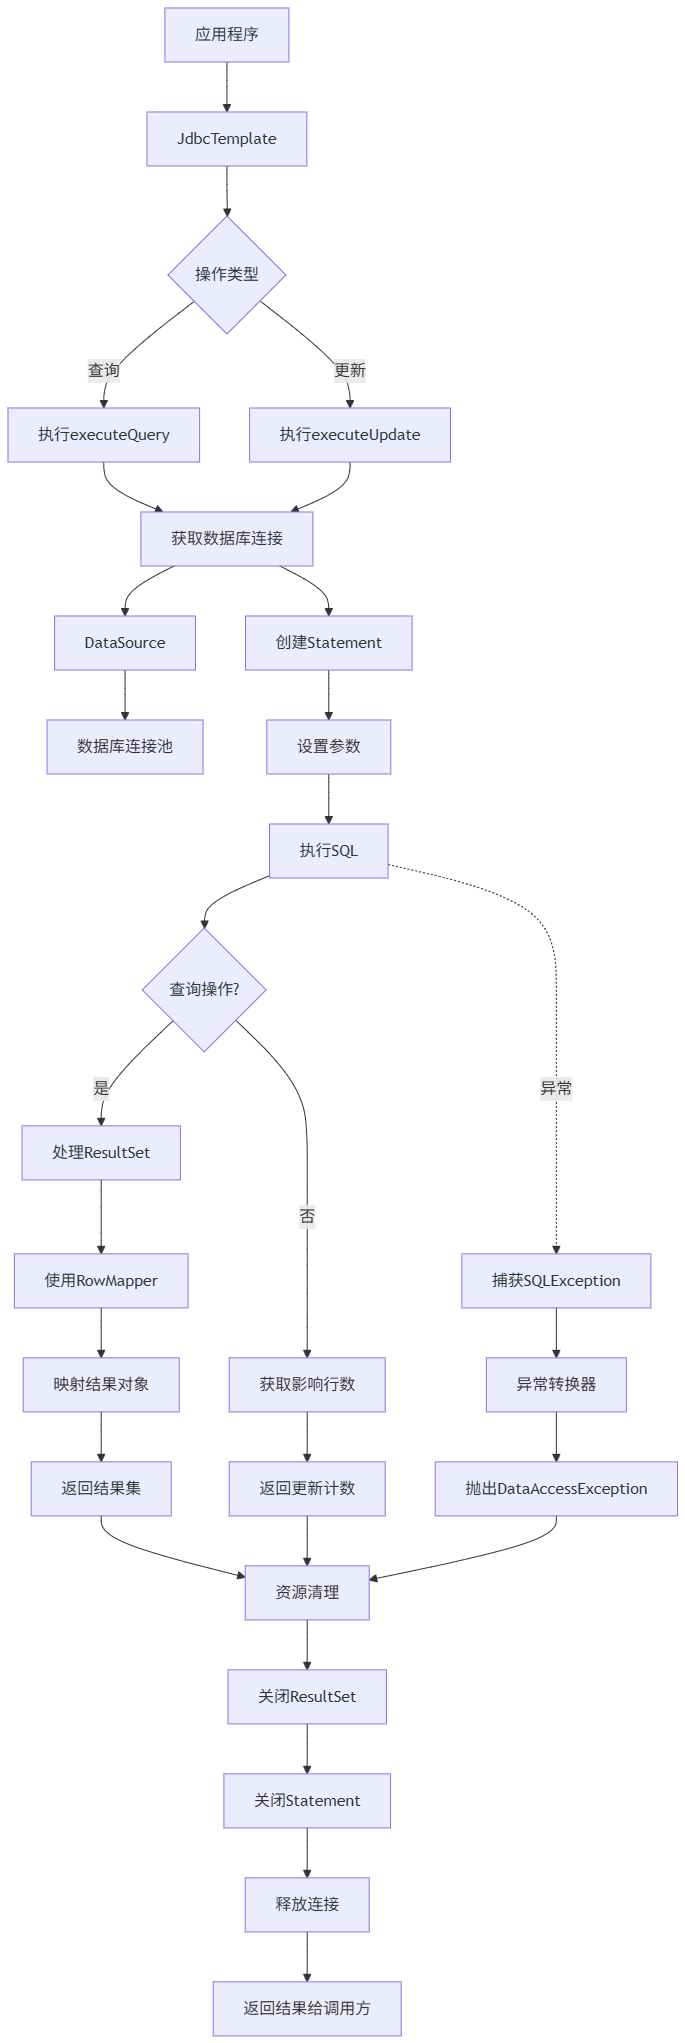
Spring数据访问模块设计
前面我们已经完成了IoC和web模块的设计,聪明的码友立马就知道了,该到数据访问模块了,要不就这俩玩个6啊,查库势在必行,至此,它来了。 一、核心设计理念 1、痛点在哪 应用离不开数据(数据库、No…...

分布式增量爬虫实现方案
之前我们在讨论的是分布式爬虫如何实现增量爬取。增量爬虫的目标是只爬取新产生或发生变化的页面,避免重复抓取,以节省资源和时间。 在分布式环境下,增量爬虫的实现需要考虑多个爬虫节点之间的协调和去重。 另一种思路:将增量判…...