【go语言开发】性能分析工具pprof使用
本文主要介绍如何在项目中使用pprof工具。首先简要介绍pprof工具的作用;然后介绍pprof的应用场景,主要分为工具型应用和服务型应用。最后数据分析项目,先采集项目信息,再可视化查看
文章目录
- 前言
- 应用场景
- 工具型应用
- 服务型应用
- 数据分析
- 命令行查看
- 采集数据
- 查看数据
- top
- Graph
- Flame Graph
- Source
欢迎大家访问个人博客网址:https://www.maogeshuo.com,博主努力更新中…
前言
pprof是Go语言的一个性能分析库,它的名字源于**“Profile”(简称"prof")**一词。该工具最早由Google开发并用于Go语言的性能分析,它可以帮助开发者找出程序中的性能瓶颈。pprof提供了CPU分析、内存分析、阻塞分析等多种性能分析功能。
- CPU分析:
- pprof可以通过采样应用程序的运行状态来分析CPU的使用情况,找出哪些函数占用了大量的CPU时间。
- 提供CPU使用率最高的函数列表和调用关系,帮助定位程序的CPU性能瓶颈。
- 内存分析:
- 支持对应用程序的内存分配和使用情况进行分析,帮助开发人员发现内存泄漏、高内存消耗的函数等问题。
- 提供内存使用最多的函数列表和调用关系,帮助优化内存管理和减少不必要的内存分配。
- 阻塞分析:
- pprof可以分析应用程序中的阻塞情况,识别并发执行过程中可能存在的阻塞问题。
- 提供阻塞最严重的代码段和调用关系,帮助优化并发执行的性能和减少阻塞时间。
- goroutine分析:
- 支持对应用程序中goroutine的跟踪和分析,帮助理解并发执行情况。
- 提供goroutine的数量、状态和调用关系等信息,帮助优化并发编程和避免goroutine泄漏。
- 堆分析:
- pprof可以生成堆内存分配和释放的时间序列图,帮助开发人员了解程序在运行过程中的内存分配情况。
- 提供堆内存使用的趋势和波动情况,帮助优化内存管理和减少内存占用。
除了这些功能外,pprof还提供了对运行时调用图的可视化展示。pprof可以很容易地集成到任何Go程序中,只需在程序中导入net/http/pprof包,并启动一个HTTP服务器,就可以通过Web界面查看性能数据。
应用场景
pprof工具的应用场景主要分为两种:
- 服务型应用:web服务性能分析
- 工具型应用:输入命令行应用等
工具型应用
如果你想在不使用HTTP服务的情况下对应用程序进行性能分析,可以直接使用 runtime/pprof 包中提供的函数来生成性能分析数据。
package mainimport ("log""os""runtime""runtime/pprof""time"
)func main() {Analysis()
}func Analysis() {// 创建 CPU 分析文件cpuProfile, err := os.Create("./profile/cpu.prof")if err != nil {log.Fatal(err)}defer cpuProfile.Close()// 开始 CPU 分析if err := pprof.StartCPUProfile(cpuProfile); err != nil {log.Fatal(err)}defer pprof.StopCPUProfile()// 模拟一些 CPU 密集型工作for i := 0; i < 1000000; i++ {_ = i * i}// 创建内存分析文件memProfile, err := os.Create("./profile/mem.prof")if err != nil {log.Fatal(err)}defer memProfile.Close()// 强制进行垃圾回收,以便获取准确的内存分析数据runtime.GC()// 开始内存分析if err := pprof.WriteHeapProfile(memProfile); err != nil {log.Fatal(err)}// 模拟一些内存使用data := make([]byte, 1024*1024)_ = datatime.Sleep(time.Second) // 等待一段时间以便生成分析数据log.Println("完成性能分析")
}
服务型应用
我们这里使用gin框架,结合https://github.com/gin-contrib/pprof
package mainimport (webpprof "github.com/gin-contrib/pprof""github.com/gin-gonic/gin""log""net/http""os""runtime""runtime/pprof""time"
)const Port = ":10000"func main() {WebAnalysis()
}func WebAnalysis() {g := gin.Default()g.GET("/test", func(c *gin.Context) {c.JSON(http.StatusOK, "测试成功")})webpprof.Register(g) // 注入HandlerFuncsg.Run(Port)}
启动后日志打印如下:

查看github.com/gin-contrib/pprof代码,发现gin.Engine将net/http/pprof的函数封装成标准的HandlerFuncs,也就是将func(w http.ResponseWriter, r *http.Request)格式函数转换为gin.HandlerFunc
package pprofimport ("net/http/pprof""github.com/gin-gonic/gin"
)const (// DefaultPrefix url prefix of pprofDefaultPrefix = "/debug/pprof"
)func getPrefix(prefixOptions ...string) string {prefix := DefaultPrefixif len(prefixOptions) > 0 {prefix = prefixOptions[0]}return prefix
}// Register the standard HandlerFuncs from the net/http/pprof package with
// the provided gin.Engine. prefixOptions is a optional. If not prefixOptions,
// the default path prefix is used, otherwise first prefixOptions will be path prefix.
func Register(r *gin.Engine, prefixOptions ...string) {RouteRegister(&(r.RouterGroup), prefixOptions...)
}// RouteRegister the standard HandlerFuncs from the net/http/pprof package with
// the provided gin.GrouterGroup. prefixOptions is a optional. If not prefixOptions,
// the default path prefix is used, otherwise first prefixOptions will be path prefix.
func RouteRegister(rg *gin.RouterGroup, prefixOptions ...string) {prefix := getPrefix(prefixOptions...)prefixRouter := rg.Group(prefix){prefixRouter.GET("/", gin.WrapF(pprof.Index))prefixRouter.GET("/cmdline", gin.WrapF(pprof.Cmdline))prefixRouter.GET("/profile", gin.WrapF(pprof.Profile))prefixRouter.POST("/symbol", gin.WrapF(pprof.Symbol))prefixRouter.GET("/symbol", gin.WrapF(pprof.Symbol))prefixRouter.GET("/trace", gin.WrapF(pprof.Trace))prefixRouter.GET("/allocs", gin.WrapH(pprof.Handler("allocs")))prefixRouter.GET("/block", gin.WrapH(pprof.Handler("block")))prefixRouter.GET("/goroutine", gin.WrapH(pprof.Handler("goroutine")))prefixRouter.GET("/heap", gin.WrapH(pprof.Handler("heap")))prefixRouter.GET("/mutex", gin.WrapH(pprof.Handler("mutex")))prefixRouter.GET("/threadcreate", gin.WrapH(pprof.Handler("threadcreate")))}
}实际上net/http/pprof库中已初始化的函数有Index等,并在此基础上再wrap了heap、mutex等
// Package pprof serves via its HTTP server runtime profiling data
// in the format expected by the pprof visualization tool.
//
// The package is typically only imported for the side effect of
// registering its HTTP handlers.
// The handled paths all begin with /debug/pprof/.
//
// To use pprof, link this package into your program:
//
//	import _ "net/http/pprof"
//
// If your application is not already running an http server, you
// need to start one. Add "net/http" and "log" to your imports and
// the following code to your main function:
//
//	go func() {
//		log.Println(http.ListenAndServe("localhost:6060", nil))
//	}()
//
// By default, all the profiles listed in [runtime/pprof.Profile] are
// available (via [Handler]), in addition to the [Cmdline], [Profile], [Symbol],
// and [Trace] profiles defined in this package.
// If you are not using DefaultServeMux, you will have to register handlers
// with the mux you are using.
//
// # Usage examples
//
// Use the pprof tool to look at the heap profile:
//
//	go tool pprof http://localhost:6060/debug/pprof/heap
//
// Or to look at a 30-second CPU profile:
//
//	go tool pprof http://localhost:6060/debug/pprof/profile?seconds=30
//
// Or to look at the goroutine blocking profile, after calling
// runtime.SetBlockProfileRate in your program:
//
//	go tool pprof http://localhost:6060/debug/pprof/block
//
// Or to look at the holders of contended mutexes, after calling
// runtime.SetMutexProfileFraction in your program:
//
//	go tool pprof http://localhost:6060/debug/pprof/mutex
//
// The package also exports a handler that serves execution trace data
// for the "go tool trace" command. To collect a 5-second execution trace:
//
//	curl -o trace.out http://localhost:6060/debug/pprof/trace?seconds=5
//	go tool trace trace.out
//
// To view all available profiles, open http://localhost:6060/debug/pprof/
// in your browser.
//
// For a study of the facility in action, visit
//
//	https://blog.golang.org/2011/06/profiling-go-programs.html
package pprofimport ("bufio""bytes""context""fmt""html""internal/profile""io""log""net/http""net/url""os""runtime""runtime/pprof""runtime/trace""sort""strconv""strings""time"
)
func init() {http.HandleFunc("/debug/pprof/", Index)http.HandleFunc("/debug/pprof/cmdline", Cmdline)http.HandleFunc("/debug/pprof/profile", Profile)http.HandleFunc("/debug/pprof/symbol", Symbol)http.HandleFunc("/debug/pprof/trace", Trace)
}
浏览器输入http://localhost:10000/debug/pprof/
pprof能分析9项信息

数据分析
命令行查看
go tool pprof
usage:Produce output in the specified format.pprof <format> [options] [binary] <source> ...Omit the format to get an interactive shell whose commands can be used
to generate various views of a profilepprof [options] [binary] <source> ...Omit the format and provide the "-http" flag to get an interactive web
interface at the specified host:port that can be used to navigate through
various views of a profile.pprof -http [host]:[port] [options] [binary] <source> ...Details:Output formats (select at most one):-callgrind       Outputs a graph in callgrind format-comments        Output all profile comments-disasm          Output assembly listings annotated with samples-dot             Outputs a graph in DOT format-eog             Visualize graph through eog-evince          Visualize graph through evince-gif             Outputs a graph image in GIF format-gv              Visualize graph through gv-kcachegrind     Visualize report in KCachegrind-list            Output annotated source for functions matching regexp-pdf             Outputs a graph in PDF format-peek            Output callers/callees of functions matching regexp-png             Outputs a graph image in PNG format-proto           Outputs the profile in compressed protobuf format-ps              Outputs a graph in PS format-raw             Outputs a text representation of the raw profile-svg             Outputs a graph in SVG format-tags            Outputs all tags in the profile-text            Outputs top entries in text form-top             Outputs top entries in text form-topproto        Outputs top entries in compressed protobuf format-traces          Outputs all profile samples in text form-tree            Outputs a text rendering of call graph-web             Visualize graph through web browser-weblist         Display annotated source in a web browserOptions:-call_tree       Create a context-sensitive call tree-compact_labels  Show minimal headers-divide_by       Ratio to divide all samples before visualization-drop_negative   Ignore negative differences-edgefraction    Hide edges below <f>*total-focus           Restricts to samples going through a node matching regexp-hide            Skips nodes matching regexp-ignore          Skips paths going through any nodes matching regexp-intel_syntax    Show assembly in Intel syntax-mean            Average sample value over first value (count)-nodecount       Max number of nodes to show-nodefraction    Hide nodes below <f>*total-noinlines       Ignore inlines.-normalize       Scales profile based on the base profile.-output          Output filename for file-based outputs-prune_from      Drops any functions below the matched frame.-relative_percentages Show percentages relative to focused subgraph-sample_index    Sample value to report (0-based index or name)-show            Only show nodes matching regexp-show_from       Drops functions above the highest matched frame.-source_path     Search path for source files-tagfocus        Restricts to samples with tags in range or matched by regexp-taghide         Skip tags matching this regexp-tagignore       Discard samples with tags in range or matched by regexp-tagleaf         Adds pseudo stack frames for labels key/value pairs at the callstack leaf.-tagroot         Adds pseudo stack frames for labels key/value pairs at the callstack root.-tagshow         Only consider tags matching this regexp-trim            Honor nodefraction/edgefraction/nodecount defaults-trim_path       Path to trim from source paths before search-unit            Measurement units to displayOption groups (only set one per group):granularity-functions       Aggregate at the function level.-filefunctions   Aggregate at the function level.-files           Aggregate at the file level.-lines           Aggregate at the source code line level.-addresses       Aggregate at the address level.sort-cum             Sort entries based on cumulative weight-flat            Sort entries based on own weightSource options:-seconds              Duration for time-based profile collection-timeout              Timeout in seconds for profile collection-buildid              Override build id for main binary-add_comment          Free-form annotation to add to the profileDisplayed on some reports or with pprof -comments-diff_base source     Source of base profile for comparison-base source          Source of base profile for profile subtractionprofile.pb.gz         Profile in compressed protobuf formatlegacy_profile        Profile in legacy pprof formathttp://host/profile   URL for profile handler to retrieve-symbolize=           Controls source of symbol informationnone                  Do not attempt symbolizationlocal                 Examine only local binariesfastlocal             Only get function names from local binariesremote                Do not examine local binariesforce                 Force re-symbolizationBinary                  Local path or build id of binary for symbolization-tls_cert             TLS client certificate file for fetching profile and symbols-tls_key              TLS private key file for fetching profile and symbols-tls_ca               TLS CA certs file for fetching profile and symbolsMisc options:-http              Provide web interface at host:port.Host is optional and 'localhost' by default.Port is optional and a randomly available port by default.-no_browser        Skip opening a browser for the interactive web UI.-tools             Search path for object toolsLegacy convenience options:-inuse_space           Same as -sample_index=inuse_space-inuse_objects         Same as -sample_index=inuse_objects-alloc_space           Same as -sample_index=alloc_space-alloc_objects         Same as -sample_index=alloc_objects-total_delay           Same as -sample_index=delay-contentions           Same as -sample_index=contentions-mean_delay            Same as -mean -sample_index=delayEnvironment Variables:PPROF_TMPDIR       Location for saved profiles (default $HOME/pprof)PPROF_TOOLS        Search path for object-level toolsPPROF_BINARY_PATH  Search path for local binary filesdefault: $HOME/pprof/binariessearches $buildid/$name, $buildid/*, $path/$buildid,${buildid:0:2}/${buildid:2}.debug, $name, $path* On Windows, %USERPROFILE% is used instead of $HOME
no profile source specified
采集数据
可以将每项数据统一采集下来,再具体分析
go tool pprof http://localhost:10000/debug/pprof/allocs
go tool pprof http://localhost:10000/debug/pprof/block
go tool pprof http://localhost:10000/debug/pprof/cmdline
go tool pprof http://localhost:10000/debug/pprof/heap
go tool pprof http://localhost:10000/debug/pprof/mutex
go tool pprof http://localhost:10000/debug/pprof/profile
go tool pprof http://localhost:10000/debug/pprof/threadcreate
go tool pprof http://localhost:10000/debug/pprof/trace
终端中运行以下命令,性能分析allocs数据:


在进入 pprof 命令行界面后,你可以输入不同的命令来查看不同类型的分析数据,比如 top 查看 CPU 使用最多的函数,list 查看某个函数的详细信息,web 可以在浏览器中打开交互式图形界面等。
查看数据
查看数据,可以选择web形式,可视化效果直观,打开收集好的pb.gz文件
UI显示依赖graphviz库 ,mac安装使用命令为:brew install graphviz
go tool pprof -http:127.0.0.1:port pb.gz路径 //参考截图使用

浏览器输入http://127.0.0.1:8082/ui/,UI上查看各项信息

top
查看CPU/内存占有率最高的接口

Graph

Flame Graph

Source

相关文章:
【go语言开发】性能分析工具pprof使用
本文主要介绍如何在项目中使用pprof工具。首先简要介绍pprof工具的作用;然后介绍pprof的应用场景,主要分为工具型应用和服务型应用。最后数据分析项目,先采集项目信息,再可视化查看 文章目录 前言应用场景工具型应用服务型应用 数…...
ARM_基础之RAS
Reliability, Availability, and Serviceability (RAS), for A-profile architecture 源自 https://developer.arm.com/documentation/102105/latest/ 1 Introduction to RAS 1.1 Faults,Errors,and failures 三个概念的区分: • A failure is the event of devia…...

VScode(1)之内网离线安装开发环境(VirtualBox+ubuntu+VScode)
VScode(1)之内网离线安装开发环境(VirtualBoxubuntuVScode) Author: Once Day Date: 2022年7月18日/2024年3月17日 一位热衷于Linux学习和开发的菜鸟,试图谱写一场冒险之旅,也许终点只是一场白日梦… 漫漫长路,有人对你微笑过嘛… 全系列文…...

Python爬虫与数据可视化源码免费领取
引言 作为一名在软件技术领域深耕多年的专业人士,我不仅在软件开发和项目部署方面积累了丰富的实践经验,更以卓越的技术实力获得了🏅30项软件著作权证书的殊荣。这些成就不仅是对我的技术专长的肯定,也是对我的创新精神和专业承诺…...
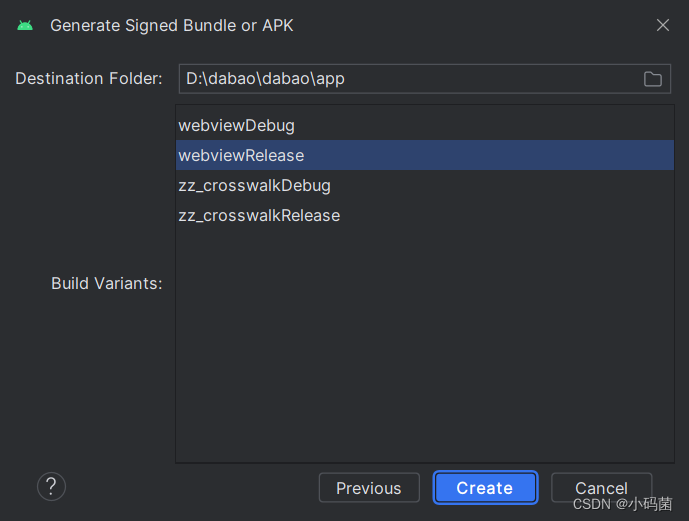
Android Studio 打包 Maker MV apk 详细步骤
一.使用RPG Make MV 部署项目,获取项目文件夹 这步基本都不会有问题: 二.安装Android Studio 安装过程参考教材就行了: https://blog.csdn.net/m0_62491877/article/details/126832118 但是有的版本面板没有Android的选项(勾…...
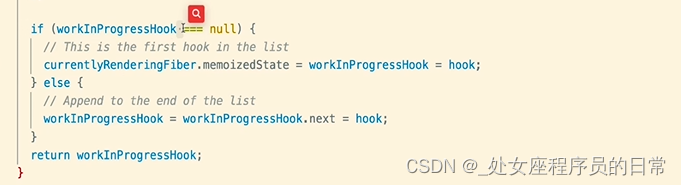
react中hooks使用限制
只能在最顶层使用Hook 不要在循环、条件中调用hook,确保总是在React函数最顶层使用它们 只能React函数中调用Hook 不要在普通的js函数中调用 在React的函数组件中调用Hook 在自定义hook中调用其他hook 原因: 我们每次的状态值或者依赖项存在哪里&…...

2024抖音矩阵云混剪系统源码 短视频矩阵营销系统
2024抖音矩阵云混剪系统源码 短视频矩阵营销系统 矩阵营销系统多平台多账号一站式管理,一键发布作品。智能标题,关键词优化,排名查询,混剪生成原创视频,账号分组,意向客户自动采集,智能回复&am…...
力扣题目训练(22)
2024年2月15日力扣题目训练 2024年2月15日力扣题目训练563. 二叉树的坡度637. 二叉树的层平均值643. 子数组最大平均数 I304. 二维区域和检索 - 矩阵不可变154. 寻找旋转排序数组中的最小值 II 2024年2月15日力扣题目训练 2024年2月15日第二十二天编程训练,今天主要…...

[ROS 系列学习教程] rosbag Python API
ROS 系列学习教程(总目录) 本文目录 1. 构造函数与关闭文件2. 属性值3. 写bag文件内容4. 读bag文件内容5. 将bag文件缓存写入磁盘6. 重建 bag 文件索引7. 获取bag文件的压缩信息8. 获取bag文件的消息数量9. 获取bag文件记录的起止时间10. 获取话题信息与消息类型 rosbag 的 Pyt…...

TCL管理Vivado工程
文章目录 TCL管理Vivado工程1. 项目目录2. 导出脚本文件3. 修改TCL脚本3.1 project.tcl3.2 bd.tcl 4. 工程恢复 TCL管理Vivado工程 工程结构 1. 项目目录 config: 配置文件、coe文件等。doc: 文档fpga: 最后恢复的fpga工程目录ip: ip文件mcs: bit流文件等,方便直接使用src: .…...
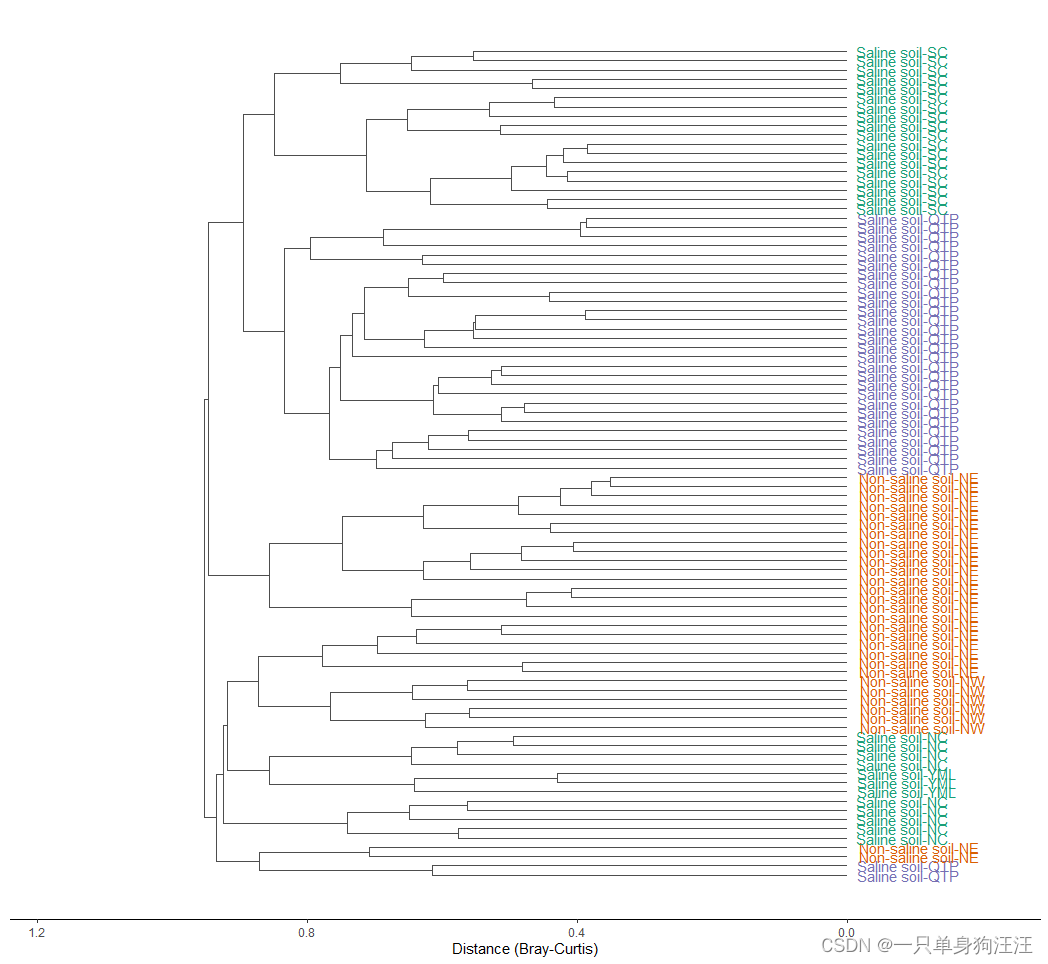
R语言:microeco:一个用于微生物群落生态学数据挖掘的R包,第四:trans_beta class
trans_beta class:利用trans_beta类可以变换和绘制beta分集的距离矩阵。该类中涉及到beta多样性的分析主要包括排序、群距、聚类和方差分析。我们首先使用PCoA显示排序。 > dataset$cal_betadiv() The result is stored in object$beta_diversity ... > t1 &…...
)
Excel文件导入导出,SpringBoot整合EasyExcel批量导入导出,采用的JDBC+EasyExcel(附带整个Demo)
目录 0.为什么mybatis的foreach比JDBC的addBatch慢 1.引入依赖 2.Controller层 3.Service层 4.Utils工具类 5.自定义监听器 6.实体类 7Mapper层 不用Mybatis的原因就是因为在大量数据插入的时候jdbc性能比mybatis好1. 首先分批读取Excel中的数据 这一点EasyExcel有自己…...

Git——本地使用详解
目录 Git1、开始版本控制1.1、初始化Repository1.2、使目录脱离Git控制 2、把文件交给Git管控2.1、创建文件后交给Git2.2、git add之后再次修改文件2.3、git add "--all"与"."参数区别2.4、把暂存区的内容提交到存储库里存档 3、工作区、暂存区与存储库3.1…...
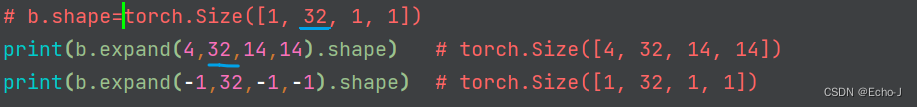
深度学习pytorch——Tensor维度变换(持续更新)
view()打平函数 需要注意的是打平之后的tensor是需要有物理意义的,根据需要进行打平,并且打平后总体的大小是不发生改变的。 并且一定要谨记打平会导致维度的丢失,造成数据污染,如果想要恢复到原来的数据形式,是需要…...
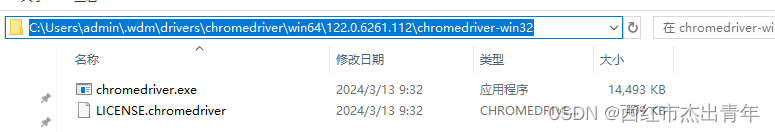
Selenium-webdriver_manager判断是否已经下载过驱动(复用缓存驱动)
1,谷歌浏览器默认位置 2,ChromeDriverManager 下载的驱动位置 其中admin为机器的用户名 def installDriver(self):"""判断是否需要下载driver""""""找到本机谷歌浏览器版本""""""C:\P…...
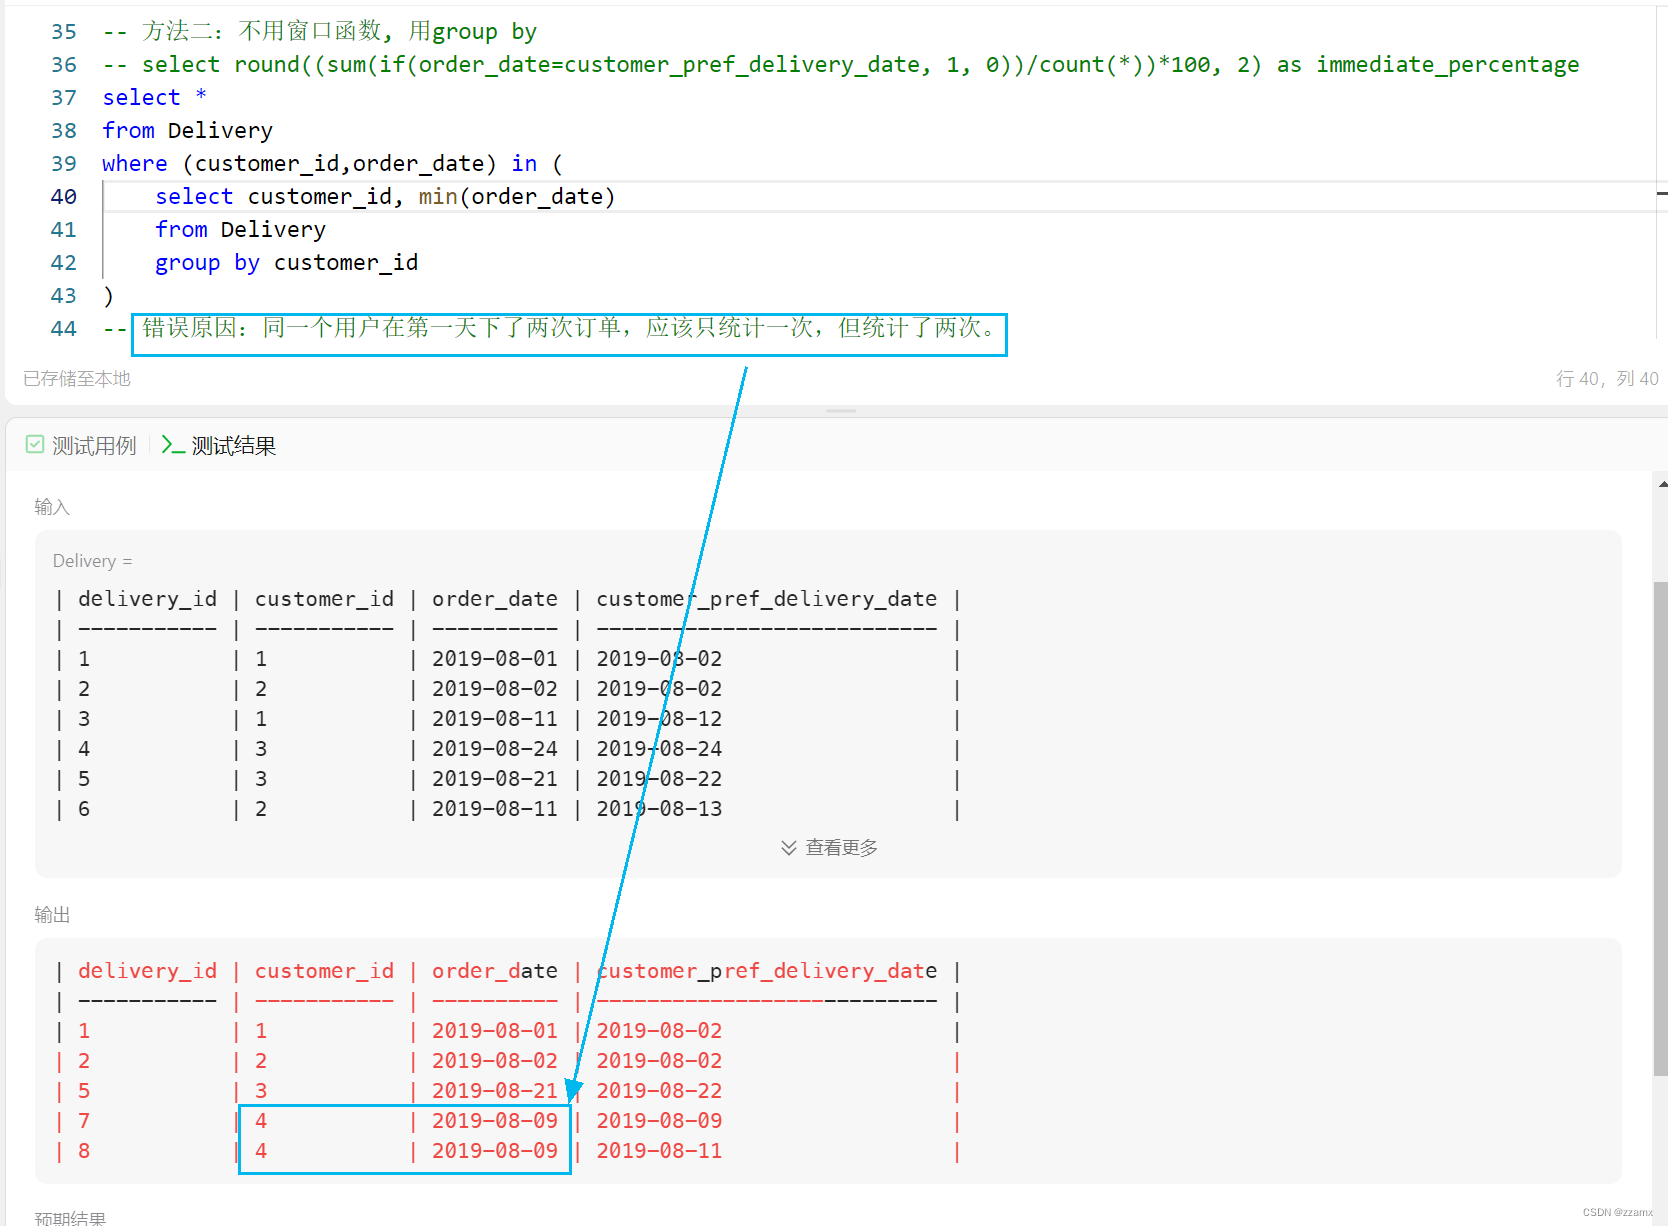
【SQL】1174. 即时食物配送 II (窗口函数row_number; group by写法;对比;定位错因)
前述 推荐学习: 通俗易懂的学会:SQL窗口函数 题目描述 leetcode题目:1174. 即时食物配送 II 写法一:窗口函数 分组排序(以customer_id 分组,按照order_date 排序),窗口函数应用。…...

mvcc介绍
前提:在介绍mvcc之前,先简单介绍一下mysql事务的相关问题,mvcc归根结底是用来解决事务并发问题的,当然这个解决不是全部解决,只是解决了其中的一部分问题! mysql事务 一、事务的基本要素(ACID&a…...
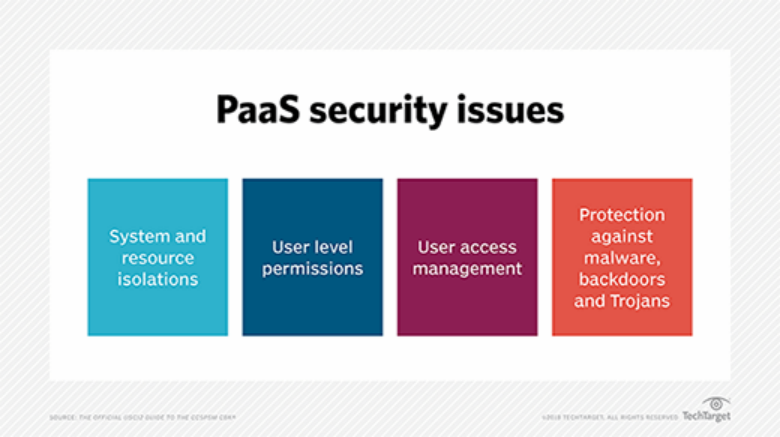
强化PaaS平台应用安全:关键策略与措施
PaaS(平台即服务,Platform-as-a-Service)是一种云计算服务模式,可以为客户提供一个完整的云平台(硬件、软件和基础架构)以用于快捷开发、运行和管理项目,从而降低了企业云计算应用的高成本和复杂…...

K8s 集群高可用master节点ETCD挂掉如何恢复?
写在前面 很常见的集群运维场景,整理分享博文内容为 K8s 集群高可用 master 节点故障如何恢复的过程理解不足小伙伴帮忙指正 不必太纠结于当下,也不必太忧虑未来,当你经历过一些事情的时候,眼前的风景已经和从前不一样了。——村上…...

【Godot 4.2】常见几何图形、网格、刻度线点求取函数及原理总结
概述 本篇为ShapePoints静态函数库的补充和辅助文档。ShapePoints函数库是一个用于生成常见几何图形顶点数据(PackedVector2Array)的静态函数库。生成的数据可用于_draw和Line2D、Polygon2D等进行绘制和显示。因为不断地持续扩展,ShapePoint…...
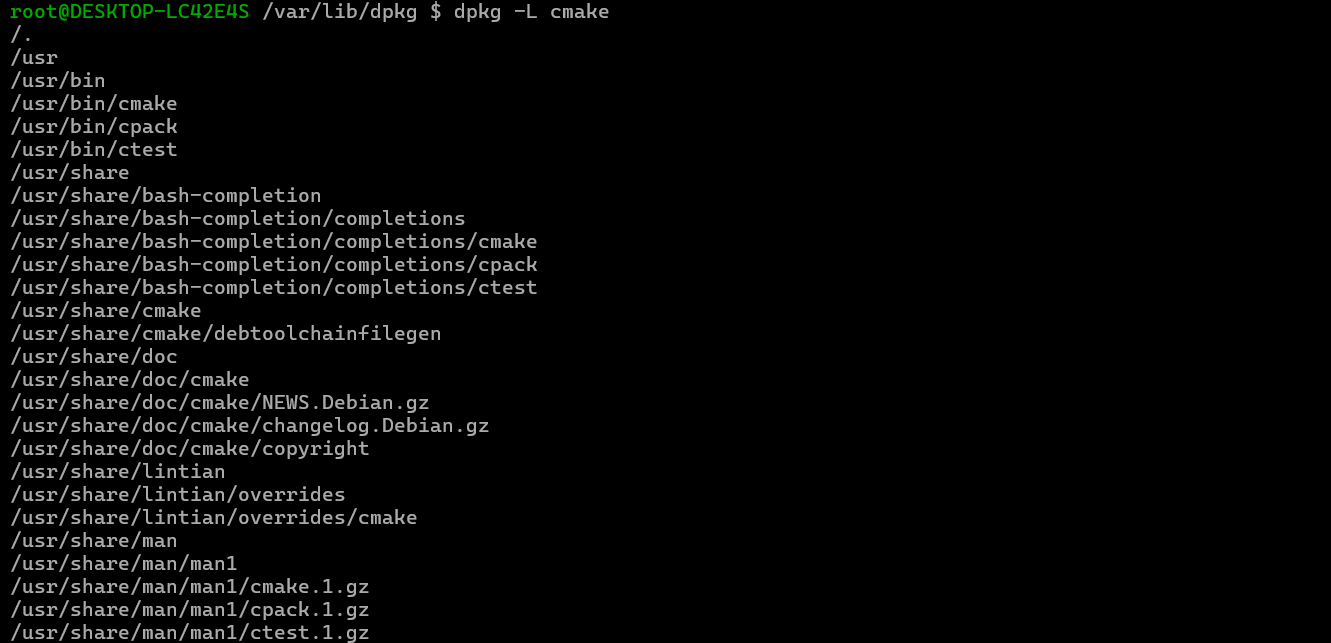
Debian系统简介
目录 Debian系统介绍 Debian版本介绍 Debian软件源介绍 软件包管理工具dpkg dpkg核心指令详解 安装软件包 卸载软件包 查询软件包状态 验证软件包完整性 手动处理依赖关系 dpkg vs apt Debian系统介绍 Debian 和 Ubuntu 都是基于 Debian内核 的 Linux 发行版ÿ…...
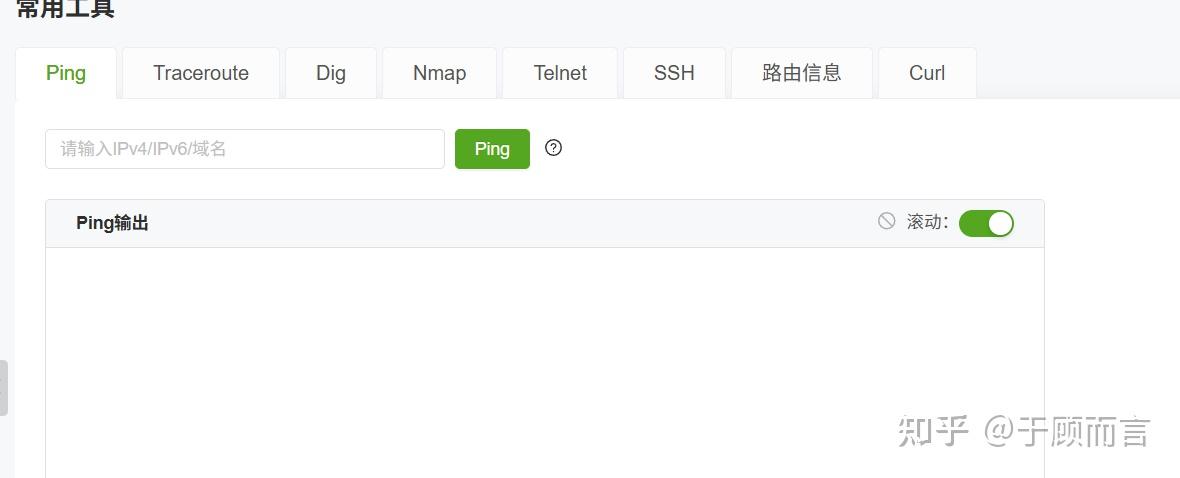
【网络安全产品大调研系列】2. 体验漏洞扫描
前言 2023 年漏洞扫描服务市场规模预计为 3.06(十亿美元)。漏洞扫描服务市场行业预计将从 2024 年的 3.48(十亿美元)增长到 2032 年的 9.54(十亿美元)。预测期内漏洞扫描服务市场 CAGR(增长率&…...
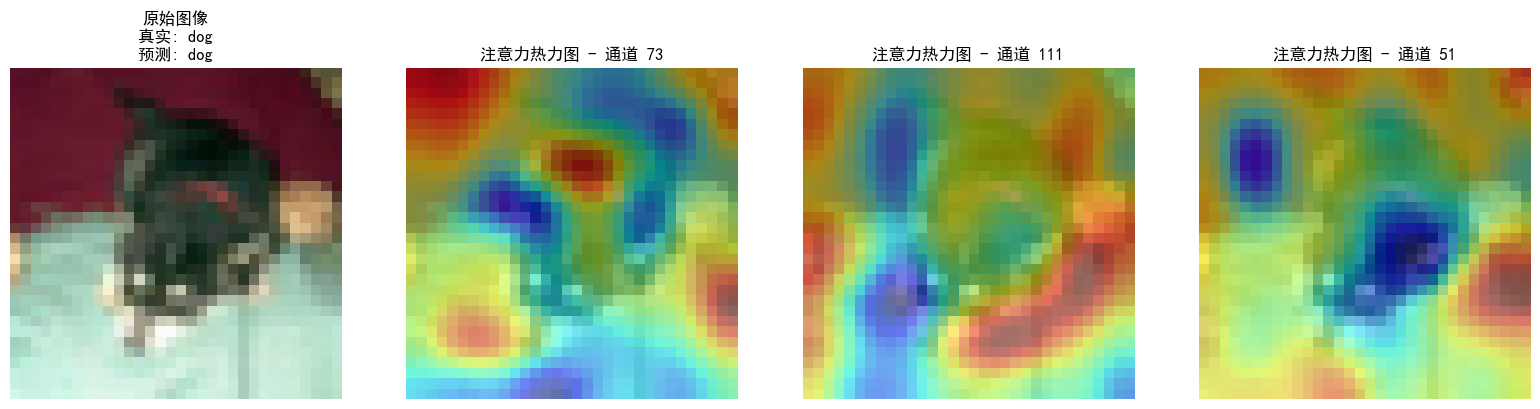
DAY 47
三、通道注意力 3.1 通道注意力的定义 # 新增:通道注意力模块(SE模块) class ChannelAttention(nn.Module):"""通道注意力模块(Squeeze-and-Excitation)"""def __init__(self, in_channels, reduction_rat…...

蓝桥杯 2024 15届国赛 A组 儿童节快乐
P10576 [蓝桥杯 2024 国 A] 儿童节快乐 题目描述 五彩斑斓的气球在蓝天下悠然飘荡,轻快的音乐在耳边持续回荡,小朋友们手牵着手一同畅快欢笑。在这样一片安乐祥和的氛围下,六一来了。 今天是六一儿童节,小蓝老师为了让大家在节…...

测试markdown--肇兴
day1: 1、去程:7:04 --11:32高铁 高铁右转上售票大厅2楼,穿过候车厅下一楼,上大巴车 ¥10/人 **2、到达:**12点多到达寨子,买门票,美团/抖音:¥78人 3、中饭&a…...
-----深度优先搜索(DFS)实现)
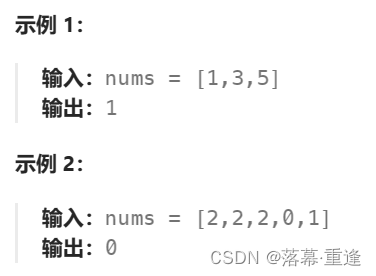
c++ 面试题(1)-----深度优先搜索(DFS)实现
操作系统:ubuntu22.04 IDE:Visual Studio Code 编程语言:C11 题目描述 地上有一个 m 行 n 列的方格,从坐标 [0,0] 起始。一个机器人可以从某一格移动到上下左右四个格子,但不能进入行坐标和列坐标的数位之和大于 k 的格子。 例…...

基于数字孪生的水厂可视化平台建设:架构与实践
分享大纲: 1、数字孪生水厂可视化平台建设背景 2、数字孪生水厂可视化平台建设架构 3、数字孪生水厂可视化平台建设成效 近几年,数字孪生水厂的建设开展的如火如荼。作为提升水厂管理效率、优化资源的调度手段,基于数字孪生的水厂可视化平台的…...

Java 加密常用的各种算法及其选择
在数字化时代,数据安全至关重要,Java 作为广泛应用的编程语言,提供了丰富的加密算法来保障数据的保密性、完整性和真实性。了解这些常用加密算法及其适用场景,有助于开发者在不同的业务需求中做出正确的选择。 一、对称加密算法…...
)
论文解读:交大港大上海AI Lab开源论文 | 宇树机器人多姿态起立控制强化学习框架(一)
宇树机器人多姿态起立控制强化学习框架论文解析 论文解读:交大&港大&上海AI Lab开源论文 | 宇树机器人多姿态起立控制强化学习框架(一) 论文解读:交大&港大&上海AI Lab开源论文 | 宇树机器人多姿态起立控制强化…...

关于 WASM:1. WASM 基础原理
一、WASM 简介 1.1 WebAssembly 是什么? WebAssembly(WASM) 是一种能在现代浏览器中高效运行的二进制指令格式,它不是传统的编程语言,而是一种 低级字节码格式,可由高级语言(如 C、C、Rust&am…...