BPF:BCC工具 funccount 统计内核函数调用(内核函数、跟踪点USDT探针)认知
写在前面
- 博文内容涉及
BCC工具funccount认知 - funccount 可以帮助用户追踪和分析Linux系统上
特定函数、系统探针或USDT探针的运行次数。 - 这对于性能分析、故障排查和系统优化等场景非常有用。
- 理解不足小伙伴帮忙指正 😃,生活加油
不必太纠结于当下,也不必太忧虑未来,当你经历过一些事情的时候,眼前的风景已经和从前不一样了。——村上春树
funccount 是什么?
funccount(8) 是BCC对事件,特别是函数调用进行计数的一个工具,可以使用它回答以下问题:
- 某个
内核态或用户态函数是否被调用过?
┌──[root@liruilongs.github.io]-[~]
└─$funccount tcp_send_fin
Tracing 1 functions for "b'tcp_send_fin'"... Hit Ctrl-C to end.
^C
FUNC                                    COUNT
tcp_send_fin                                8
Detaching...
┌──[root@liruilongs.github.io]-[~]
└─$
这将统计 tcp_send_fin 函数的调用次数。如果输出显示调用次数大于 0,那就说明这个函数确实被调用过。
- 该函数每秒被调用了多少次?
┌──[root@liruilongs.github.io]-[~]
└─$funccount -d 10 tcp_send_fin
Tracing 1 functions for "b'tcp_send_fin'"... Hit Ctrl-C to end.FUNC                                    COUNT
tcp_send_fin                                6
Detaching...
┌──[root@liruilongs.github.io]-[~]
└─$
这将每 10 秒钟输出一次 tcp_send_fin 函数的调用统计信息。从输出中我们可以计算出每秒被调用的次数,这就是该函数的调用频率。
funccount 用于自动执行 ftrace 的简单脚本。它只做一件事:内核函数计数
需要说明的是,并不是所有的函数都可以统计,判断内核函数是否可以被计数,需要检查是否在下面两个文件中。
# 内核函数
$cat /proc/kallsyms
# ftrace 可以跟踪的内容
$cat /sys/kernel/debug/tracing/available_filter_functions
整体上可以分为 三类:
- 动态跟踪的
内核探针和用户探针 - 静态跟踪的
系统探针
常见的应用场景
跟踪 TCP 发送函数的调用次数
观察 TCP 发送相关函数的调用频率,可以通过下面的方式
┌──[root@liruilongs.github.io]-[/usr/share/bcc/tools]
└─$funccount  -i 2  -d 10 "tcp_send_*"
Tracing 13 functions for "b'tcp_send_*'"... Hit Ctrl-C to end.FUNC                                    COUNT
tcp_send_fin                                1
tcp_send_delayed_ack                        1
tcp_send_ack                                2
tcp_send_mss                                3FUNC                                    COUNT
tcp_send_mss                                3FUNC                                    COUNT
tcp_send_fin                                1
tcp_send_delayed_ack                        1
tcp_send_ack                                2
tcp_send_mss                                4FUNC                                    COUNT
tcp_send_ack                                1
tcp_send_mss                                3FUNC                                    COUNT
tcp_send_fin                                2
tcp_send_delayed_ack                        2
tcp_send_ack                                4
tcp_send_mss                                6
Detaching...
┌──[root@liruilongs.github.io]-[/usr/share/bcc/tools]
└─$
tcp_send_fin: 此函数用于发送 TCP 连接终止请求(FIN 包)。当一方完成数据传输并想要关闭连接时,会发送 FIN 包。收到 FIN 包的一方也会发送一个 ACK 确认包,然后可能继续发送剩余的数据,最后发送自己的 FIN 包来关闭连接。
tcp_send_delayed_ack: 此函数用于发送 TCP 延迟确认(ACK)包。在某些情况下,TCP 协议允许在接收到数据包后不立即发送 ACK 确认包,而是等待一段时间(称为“延迟 ACK”)。此函数负责在适当的时机发送这些延迟 ACK。
tcp_send_ack: 此函数用于发送 TCP 确认(ACK)包。当接收到数据包时,TCP 协议要求发送方发送一个 ACK 确认包以通知接收方已成功接收数据。此函数负责发送这些 ACK 确认包。
tcp_send_mss: 此函数用于发送 TCP 最大分段大小(MSS)选项。MSS 是 TCP 分段中可携带的最大有效载荷。在建立连接时,双方会交换 MSS 值,以便在传输过程中选择合适的分段大小。此函数负责在 SYN 包中发送本地系统的 MSS 值。
跟踪文件读写函数的调用次数
┌──[root@liruilongs.github.io]-[~]
└─$funccount  -i 2 -d 5 'vfs_read|vfs_write'
Tracing 2 functions for "b'vfs_read|vfs_write'"... Hit Ctrl-C to end.FUNC                                    COUNT
vfs_write                                 197
vfs_read                                  451FUNC                                    COUNT
vfs_write                                 320
vfs_read                                 3553FUNC                                    COUNT
vfs_read                                   28
vfs_write                                  85
Detaching...
┌──[root@liruilongs.github.io]-[~]
└─$
vfs_read: 此函数负责在内核空间执行文件读取操作。vfs_write: 此函数负责在内核空间执行文件写入操作
跟踪网络套接字创建和销毁函数的调用次数
┌──[root@liruilongs.github.io]-[~]
└─$funccount  -i 25 -d 25  "sock_create|sock_release"
Tracing 2 functions for "b'sock_create|sock_release'"... Hit Ctrl-C to end.FUNC                                    COUNT
Detaching...
跟踪进程创建和退出的函数调用次数
┌──[root@liruilongs.github.io]-[~]
└─$funccount  -i 25 -d 25 'do_fork|do_exit'
Tracing 1 functions for "b'do_fork|do_exit'"... Hit Ctrl-C to end.FUNC                                    COUNT
do_exit                                   141
Detaching...
单行程序
对虚拟文件系统 VFS 内核函数进行计数
funccount 'vfs_*'
对 TCP 内核函数进行计数
funccount "tcp_*"
统计每秒 TCP 发送函数的调用次数
┌──[root@liruilongs.github.io]-[/usr/share/bcc/tools]
└─$funccount  -i 2  -d 4 "tcp_send_*"
Tracing 13 functions for "b'tcp_send_*'"... Hit Ctrl-C to end.FUNC                                    COUNT
tcp_send_mss                                1
tcp_send_ack                                3
tcp_send_delayed_ack                        6FUNC                                    COUNT
tcp_send_fin                                1
tcp_send_delayed_ack                        1
tcp_send_mss                                4
tcp_send_ack                                5
Detaching...
┌──[root@liruilongs.github.io]-[/usr/share/bcc/tools]
└─$
展示每秒块 IO 事件的数量
funccount -i 1 't:block;*
展示每秒新创建的进程数量
┌──[root@liruilongs.github.io]-[/usr/share/bcc/tools]
└─$funccount -i 1 t:sched:sched_process_fork -d 5
Tracing 1 functions for "b't:sched:sched_process_fork'"... Hit Ctrl-C to end.FUNC                                    COUNT
sched:sched_process_fork                    9FUNC                                    COUNT
sched:sched_process_fork                   15FUNC                                    COUNT
sched:sched_process_fork                    2FUNC                                    COUNT
sched:sched_process_fork                    1FUNC                                    COUNT
sched:sched_process_fork                    1
Detaching...
┌──[root@liruilongs.github.io]-[/usr/share/bcc/tools]
└─$
展示每秒 libc中getaddrinfo()(域名解析)函数的调用次数
┌──[root@liruilongs.github.io]-[/usr/share/bcc/tools]
└─$funccount -i 25 -d 25 "c:getaddrinfo"
Tracing 1 functions for "b'c:getaddrinfo'"... Hit Ctrl-C to end.FUNC                                    COUNT
getaddrinfo                                14
Detaching...
┌──[root@liruilongs.github.io]-[/usr/share/bcc/tools]
└─$
对 libc 中 malloc() 调用进行计数:
┌──[root@liruilongs.github.io]-[/usr/share/bcc/tools/doc]
└─$funccount c:malloc
Tracing 1 functions for "b'c:malloc'"... Hit Ctrl-C to end.
^C
FUNC                                    COUNT
malloc                                  18168
Detaching...
funccount 的 Demo
funccount 的语法
funccount(8)的命令行参数包括可以用来改变行为的选项,以及一个描述被插桩事件的字符串:
funccount [opention] eventname
eventname 的语法是:
name或者 p:name:对内核函数 name()进行插桩。lib:name或者 p:1ib:name:对用户态 lib 库中的函数 name()进行插桩。Path:name:对位于path 路径下文件中的用户态函数 name()进行插桩。t:system:name:对名为system:name 的内核跟踪点进行插桩。u:lib:name:对 lib 库中名为name 的 USDT 探针进行插桩。*:用来匹配任意字符的通配符。-r 选项允许使用正则表达式。
func -- probe a kernel functionlib:func -- probe a user-space function in the library 'lib'/path:func -- probe a user-space function in binary '/path'p::func -- same thing as 'func'p:lib:func -- same thing as 'lib:func't:cat:event -- probe a kernel tracepointu:lib:probe -- probe a USDT tracepoint
帮助文档Demo
帮助文档
liruilonger@cloudshell:~/bcc/tools$ cat funccount_example.txt
funccount_example.txt 这个文档描述了 funccount 这个 eBPF/bcc 工具的使用方法和功能。
指定一个模式(正则表达式或*通配符),追踪匹配的 函数/tracepoints 调用
# ./funccount 'vfs_*'
Tracing... Ctrl-C to end.
^C
FUNC                          COUNT
vfs_create                        1
vfs_rename                        1
vfs_fsync_range                   2
vfs_lock_file                    30
vfs_fstatat                     152
vfs_fstat                       154
vfs_write                       166
vfs_getattr_nosec               262
vfs_getattr                     262
vfs_open                        264
vfs_read                        470
Detaching...
上面的输出显示,在跟踪vfsread()函数时调用了 470 次,vfs_open() 264 次等等。
这对于探索内核代码非常有用,可以找出哪些函数正在使用,哪些没有使用。这可以将调查范围缩小到几个功能,这些功能的计数与所调查的工作负载类似。
统计 vfs 函数调用次数
统计所有 tcp 相关函数调用次数
┌──[root@liruilongs.github.io]-[/usr/share/bcc/tools]
└─$./funccount 'tcp_*'
Tracing 397 functions for "b'tcp_*'"... Hit Ctrl-C to end.
^C
FUNC                                    COUNT
tcp_delack_timer_handler                    1
tcp_leave_memory_pressure                   1
tcp_delack_timer                            2
tcp_write_timer                             3
。。。。。。。。。。。。。。。。
tcp_release_cb                            972
tcp_poll                                 1079
tcp_mstamp_refresh                       1414
Detaching...
┌──[root@liruilongs.github.io]-[/usr/share/bcc/tools]
└─
设置统计间隔和最大时间限制,每一秒钟采样,持续时间为5s
┌──[root@liruilongs.github.io]-[/usr/share/bcc/tools]
└─$./funccount -i 1 -d 5 vfs_read
Tracing 1 functions for "b'vfs_read'"... Hit Ctrl-C to end.FUNC                                    COUNT
vfs_read                                  356FUNC                                    COUNT
vfs_read                                   90FUNC                                    COUNT
vfs_read                                   82FUNC                                    COUNT
vfs_read                                 3478
^C
FUNC                                    COUNT
vfs_read                                   13
Detaching...
┌──[root@liruilongs.github.io]-[/usr/share/bcc/tools]
└─$
过滤指定进程 ID 下的函数调用
./funccount -p 1442 contentions:*
使用正则表达式匹配名称
┌──[root@liruilongs.github.io]-[/usr/share/bcc/tools]
└─$./funccount -r 'c:(write|read)$' -d 5
Tracing 2 functions for "b'c:(write|read)$'"... Hit Ctrl-C to end.FUNC                                    COUNT
read                                      233
write                                     388
Detaching...
┌──[root@liruilongs.github.io]-[/usr/share/bcc/tools]
└─$
统计指定内核态 tracepoint 静态跟踪事件调用次数
┌──[root@liruilongs.github.io]-[/usr/share/bcc/tools]
└─$./funccount t:block:*  -d 3
Tracing 21 functions for "b't:block:*'"... Hit Ctrl-C to end.FUNC                                    COUNT
block:block_plug                            6
block:block_unplug                          6
block:block_getrq                          10
block:block_rq_insert                      12
block:block_io_done                        12
block:block_rq_complete                    13
block:block_rq_issue                       13
block:block_io_start                       13
block:block_bio_remap                      20
block:block_bio_backmerge                  23
block:block_bio_queue                      34
block:block_dirty_buffer                  125
block:block_touch_buffer                  145
Detaching...
┌──[root@liruilongs.github.io]-[/usr/share/bcc/tools]
└─$
统计用户态 USDT 探针静态跟踪调用次数
./funccount u:pthread:mutex -p 1442
动态查看指定函数调用变化,每秒统计一次数据信息
./funccount -i 1 'vfs_*'
统计单个函数指定时间内调用次数
./funccount -d 5 vfs_read
过滤指定 CPU 下的函数调用
funccount.py -i 1 -c 1 lapic_next_deadline
funcccount 常见报错
┌──[root@liruilongs.github.io]-[~]
└─$funccount  -i 2 -d 10 'vfs_read,vfs_write'
No functions matched by pattern b'^vfs_read,vfs_write$'
┌──[root@liruilongs.github.io]-[~]
└─$funccount u:pthread:mutex
USDT failed to instrument path b'/lib64/libpthread.so.0'
┌──[root@liruilongs.github.io]-[/usr/share/bcc/tools]
└─$funccount -i 1 't:block;*'
Can't mix strings and bytes in path components
┌──[root@liruilongs.github.io]-[~]
└─$funccount  go:os.*
Can't mix strings and bytes in path components
funccount 源码
执行流程
funccount 脚本的工作原理:
- 解析命令行参数,了解用户想要追踪的函数、系统探点或USDT探针的模式,以及其他设置(如PID、时间间隔等)。
- 根据用户提供的信息,创建一个Probe实例。Probe实例负责处理具体的探针(如内核探针、用户空间探针等)。
- 使用Probe实例的方法,将BPF程序附加到相应的探针上,以便在探针被触发时收集数据。
- 运行一个循环,周期性地收集和显示探针的计数数据。这将持续到用户按下Ctrl-C或达到指定的持续时间。
- 在循环结束时,脚本会从探针上卸载BPF程序并退出。
源码
#!/usr/bin/env python
# @lint-avoid-python-3-compatibility-imports
#
# funccount Count functions, tracepoints, and USDT probes.
#           For Linux, uses BCC, eBPF.
#
# USAGE: funccount [-h] [-p PID] [-i INTERVAL] [-d DURATION] [-T] [-r]
#                  [-c CPU] pattern
#
# The pattern is a string with optional '*' wildcards, similar to file
# globbing. If you'd prefer to use regular expressions, use the -r option.
#
# Copyright (c) 2015 Brendan Gregg.
# Licensed under the Apache License, Version 2.0 (the "License")
#
# 09-Sep-2015   Brendan Gregg       Created this.
# 18-Oct-2016   Sasha Goldshtein    Generalized for uprobes, tracepoints, USDT.from __future__ import print_function
from bcc import ArgString, BPF, USDT
from time import sleep, strftime
import argparse
import re
import signal
import sys
import tracebackdebug = Falsedef verify_limit(num):# 用于检查探测器的数量是否超过了内核的限制probe_limit = BPF.get_probe_limit()if num > probe_limit:raise Exception("maximum of %d probes allowed, attempted %d" %(probe_limit, num))# 实际的观测类
class Probe(object):# 初始化跟踪对象def __init__(self, pattern, use_regex=False, pid=None, cpu=None):"""Init a new probe.Init the probe from the pattern provided by the user. The supportedpatterns mimic the 'trace' and 'argdist' tools, but are simpler becausewe don't have to distinguish between probes and retprobes.func            -- probe a kernel functionlib:func        -- probe a user-space function in the library 'lib'/path:func      -- probe a user-space function in binary '/path'p::func         -- same thing as 'func'p:lib:func      -- same thing as 'lib:func't:cat:event     -- probe a kernel tracepointu:lib:probe     -- probe a USDT tracepoint"""# 跟踪的表达式进行解析,可以看到这里都是字节操作# 基于`分隔符b':'拆分字节串`,得到一个部分列表。parts = bytes(pattern).split(b':')# 如果只有一个部分,意味着缺少类型,因此将类型设置为b"p"(表示“模式”),库设置为空字节串,if len(parts) == 1:# 也就是上面 func ===》 `p::func` 部分parts = [b"p", b"", parts[0]]# 如果有两个切片,将类型设置为b"p",并将第一个部分作为库,第二个部分作为模式    elif len(parts) == 2:#  lib:func    ==》 `p:lib:func`` parts = [b"p", parts[0], parts[1]]#  如果有三个    elif len(parts) == 3:# 第一个切片为 `t` 为内核跟踪点if parts[0] == b"t":parts = [b"t", b"", b"%s:%s" % tuple(parts[1:])]# 如果不为 t p u 那么抛异常if parts[0] not in [b"p", b"t", b"u"]:raise Exception("Type must be 'p', 't', or 'u', but got %s" %parts[0])else:# 不在上面的范围,抛异常raise Exception("Too many ':'-separated components in pattern %s" %pattern)# 从 parts 中解构 三个变量(self.type, self.library, self.pattern) = parts# use_regex 为初始化方法参数,是否使用正则,如果不使用,use_regex为False,需要转化为正则if not use_regex:self.pattern = self.pattern.replace(b'*', b'.*')self.pattern = b'^' + self.pattern + b'$'# 如果类型是b"p"且指定了库,或者类型是b"u",# 尝试使用BPF.find_library()方法找到库路径。如果找不到,# 尝试使用BPF.find_exe()方法找到可执行文件if (self.type == b"p" and self.library) or self.type == b"u":libpath = BPF.find_library(self.library)if libpath is None:# This might be an executable (e.g. 'bash')libpath = BPF.find_exe(str(self.library))if libpath is None or len(libpath) == 0:raise Exception("unable to find library %s" % self.library)self.library = libpathself.pid = pidself.cpu = cpuself.matched = 0self.trace_functions = {}   # map location number to function name# 是否为内核探针def is_kernel_probe(self):return self.type == b"t" or (self.type == b"p" and self.library == b"")def attach(self):#self.type表示要附加的探针类型# p(内核探针)# t(系统探针)# u(用户探针)if self.type == b"p" and not self.library:# 动态跟踪# 为self.trace_functions中的每个函数附加一个内核探针。# 使用self.bpf.attach_kprobe()方法将BPF程序附加到内核探针事件。for index, function in self.trace_functions.items():self.bpf.attach_kprobe(event=function,fn_name="trace_count_%d" % index)elif self.type == b"p" and self.library:# 动态跟踪# 为self.trace_functions中的每个函数附加一个用户空间探针。# 使用self.bpf.attach_uprobe()方法将BPF程序附加到用户空间探针事件。for index, function in self.trace_functions.items():self.bpf.attach_uprobe(name=self.library,sym=function,fn_name="trace_count_%d" % index,pid=self.pid or -1)elif self.type == b"t":# 静态跟踪# 为self.trace_functions中的每个函数附加一个系统探针。# 使用self.bpf.attach_tracepoint()方法将BPF程序附加到系统探针事件for index, function in self.trace_functions.items():self.bpf.attach_tracepoint(tp=function,fn_name="trace_count_%d" % index)elif self.type == b"u":# 如果self.type为u(用户探针),则不执行任何操作,因为在load方法中已经附加了用户探针。pass    # Nothing to do -- attach already happened in `load`def _add_function(self, template, probe_name):#  表示要添加到bpf程序中的内核探针函数的名称。# 根据给定的模板和探针名称生成新的BPF函数,并将这些函数添加到bpf程序中new_func = b"trace_count_%d" % self.matchedtext = template.replace(b"PROBE_FUNCTION", new_func)text = text.replace(b"LOCATION", b"%d" % self.matched)self.trace_functions[self.matched] = probe_nameself.matched += 1return textdef _generate_functions(self, template):# template 为上面拼接的字符串,即C代码self.usdt = Nonetext = b""if self.type == b"p" and not self.library:# get_kprobe_functions 函数接收一个模式字符串,并返回与该模式匹配的所有内核探针函数的列表functions = BPF.get_kprobe_functions(self.pattern)# 校验跟踪的内核探针函数数量verify_limit(len(functions))for function in functions:text += self._add_function(template, function)elif self.type == b"p" and self.library:# uprobes are tricky because the same function may have multiple# addresses, and the same address may be mapped to multiple# functions. We aren't allowed to create more than one uprobe# per address, so track unique addresses and ignore functions that# map to an address that we've already seen. Also ignore functions# that may repeat multiple times with different addresses.addresses, functions = (set(), set())functions_and_addresses = BPF.get_user_functions_and_addresses(self.library, self.pattern)verify_limit(len(functions_and_addresses))for function, address in functions_and_addresses:if address in addresses or function in functions:continueaddresses.add(address)functions.add(function)text += self._add_function(template, function)elif self.type == b"t":tracepoints = BPF.get_tracepoints(self.pattern)verify_limit(len(tracepoints))for tracepoint in tracepoints:text += self._add_function(template, tracepoint)elif self.type == b"u":self.usdt = USDT(path=str(self.library), pid=self.pid)matches = []for probe in self.usdt.enumerate_probes():if not self.pid and (probe.bin_path != self.library):continueif re.match(self.pattern, probe.name):matches.append(probe.name)verify_limit(len(matches))for match in matches:new_func = b"trace_count_%d" % self.matchedtext += self._add_function(template, match)self.usdt.enable_probe(match, new_func)if debug:print(self.usdt.get_text())return textdef load(self):"""@Desc    :   更具给定的探针配置加载 eBPF 程序"""trace_count_text = b"""
int PROBE_FUNCTION(void *ctx) {FILTERPIDFILTERCPUint loc = LOCATION;counts.atomic_increment(loc);return 0;
}"""bpf_text = b"""#include <uapi/linux/ptrace.h>BPF_ARRAY(counts, u64, NUMLOCATIONS);"""# We really mean the tgid from the kernel's perspective, which is in# the top 32 bits of bpf_get_current_pid_tgid().if self.pid:trace_count_text = trace_count_text.replace(b'FILTERPID',b"""u32 pid = bpf_get_current_pid_tgid() >> 32;if (pid != %d) { return 0; }""" % self.pid)else:trace_count_text = trace_count_text.replace(b'FILTERPID', b'')if self.cpu:trace_count_text = trace_count_text.replace(b'FILTERCPU',b"""u32 cpu = bpf_get_smp_processor_id();if (cpu != %d) { return 0; }""" % int(self.cpu))else:trace_count_text = trace_count_text.replace(b'FILTERCPU', b'')bpf_text += self._generate_functions(trace_count_text)bpf_text = bpf_text.replace(b"NUMLOCATIONS",b"%d" % len(self.trace_functions))if debug:print(bpf_text)if self.matched == 0:raise Exception("No functions matched by pattern %s" %self.pattern)self.bpf = BPF(text=bpf_text,usdt_contexts=[self.usdt] if self.usdt else [])self.clear()    # Initialize all array items to zerodef counts(self):return self.bpf["counts"]def clear(self):counts = self.bpf["counts"]for location, _ in list(self.trace_functions.items()):counts[counts.Key(location)] = counts.Leaf()class Tool(object):def __init__(self) -> None:# 工具的使用 Demo 说明examples = """examples:./funccount 'vfs_*'             # count kernel fns starting with "vfs"./funccount -r '^vfs.*'         # same as above, using regular expressions./funccount -Ti 5 'vfs_*'       # output every 5 seconds, with timestamps./funccount -d 10 'vfs_*'       # trace for 10 seconds only./funccount -p 185 'vfs_*'      # count vfs calls for PID 181 only./funccount t:sched:sched_fork  # count calls to the sched_fork tracepoint./funccount -p 185 u:node:gc*   # count all GC USDT probes in node, PID 185./funccount c:malloc            # count all malloc() calls in libc./funccount go:os.*             # count all "os.*" calls in libgo./funccount -p 185 go:os.*      # count all "os.*" calls in libgo, PID 185./funccount ./test:read*        # count "read*" calls in the ./test binary./funccount -c 1 'vfs_*'        # count vfs calls on CPU 1 only"""#argparse 用于帮助输出,以及参数解析parser = argparse.ArgumentParser(description="Count functions, tracepoints, and USDT probes",formatter_class=argparse.RawDescriptionHelpFormatter,epilog=examples)parser.add_argument("-p", "--pid", type=int,help="trace this PID only")parser.add_argument("-i", "--interval",help="summary interval, seconds")parser.add_argument("-d", "--duration",help="total duration of trace, seconds")parser.add_argument("-T", "--timestamp", action="store_true",help="include timestamp on output")parser.add_argument("-r", "--regexp", action="store_true",help="use regular expressions. Default is \"*\" wildcards only.")parser.add_argument("-D", "--debug", action="store_true",help="print BPF program before starting (for debugging purposes)")parser.add_argument("-c", "--cpu",help="trace this CPU only")parser.add_argument("pattern",type=ArgString,help="search expression for events")# 获取到解析的参数self.args = parser.parse_args()global debugdebug = self.args.debug# 初始化跟踪对象,跟踪对象用于执行实际的 BPF 操作self.probe = Probe(self.args.pattern, self.args.regexp, self.args.pid,self.args.cpu)# 这里可以看到获得到的命令行参数包括 跟踪的表达式,正则匹配式,进程ID 已经 CPU 编号# 如果 有 -d 没有 -i 。那么 -i 配置成 -d 的纸  if self.args.duration and not self.args.interval:self.args.interval = self.args.duration# 如果 -i 没有设置,默认是 99999999if not self.args.interval:self.args.interval = 99999999@staticmethoddef _signal_ignore(signal, frame):print()def run(self):# 调用self.probe.load()方法加载eBPF程序self.probe.load()# 调用self.probe.attach()方法将eBPF程序附加到相应的目标上。self.probe.attach()print("Tracing %d functions for \"%s\"... Hit Ctrl-C to end." %(self.probe.matched, bytes(self.args.pattern)))# 初始化exiting变量以控制程序的退出exiting = 0 if self.args.interval else 1# 初始化seconds变量为0,用于跟踪程序的运行时间seconds = 0# 进入无限循环,直到exiting变量变为1:while True:try:sleep(int(self.args.interval))seconds += int(self.args.interval)except KeyboardInterrupt:exiting = 1# as cleanup can take many seconds, trap Ctrl-C:signal.signal(signal.SIGINT, Tool._signal_ignore) # type: ignoreif self.args.duration and seconds >= int(self.args.duration):exiting = 1print()if self.args.timestamp:print("%-8s\n" % strftime("%H:%M:%S"), end="")print("%-36s %8s" % ("FUNC", "COUNT"))counts = self.probe.counts()for k, v in sorted(counts.items(),key=lambda counts: counts[1].value):if v.value == 0:continueprint("%-36s %8d" %(self.probe.trace_functions[k.value].decode('utf-8', 'replace'), v.value))if exiting:print("Detaching...")exit()else:self.probe.clear()if __name__ == "__main__":try:Tool().run()except Exception:if debug:traceback.print_exc()elif sys.exc_info()[0] is not SystemExit:print(sys.exc_info()[1])
对源码进行简单分析
方法和类说明
Probe 类提供了用于创建、配置和附加 eBPF 探测对象的方法。
-
__init__:初始化一个新的探测对象。解析用户提供的模式、PID 和 CPU 参数。根据模式类型(内核函数、用户空间函数、跟踪点或 USDT 探针),设置探测对象的属性。 -
is_kernel_probe:检查探测对象是否为内核探测。如果探测类型为t(跟踪点)或者是类型为p(用户空间或内核函数)且库名称为空(表示内核函数),则返回True。 -
attach:将探测对象附加到目标上。根据探测类型(内核函数、用户空间函数、跟踪点或 USDT 探针),使用 BCC 库将 BPF 程序附加到相应的目标上。 -
_add_function:向 BPF 程序模板中添加新的探测函数。这个方法根据给定的模板和探测名称生成一个新的探测函数,并将其添加到 BPF 程序文本中。同时,将新函数的索引和名称添加到trace_functions字典中。 -
_generate_functions:根据探测类型和模式生成 BPF 程序文本。这个方法根据探测类型(内核函数、用户空间函数、跟踪点或 USDT 探针)和模式,生成相应的 BPF 程序文本。对于用户空间函数和 USDT 探针,还需要处理多个地址和重复函数的问题。 -
load:加载 BPF 程序。这个方法首先定义了一个基本的 BPF 程序模板,然后根据探测类型和模式生成具体的 BPF 程序文本。接着,使用 BCC 库将 BPF 程序加载到内核中。最后,初始化所有计数器数组项为零。 -
counts:返回BPF 程序的计数器数组。这个方法返回一个字典,其中键是探测位置的索引,值是对应的计数值。 -
clear:清除所有计数器数组项。这个方法遍历trace_functions字典,将所有计数器数组项的值重置为零。
Tool 类是 funccount 脚本的主体部分,它负责解析命令行参数、创建探测对象、加载 BPF 程序、附加探测并定期输出计数结果
-
__init__:初始化Tool对象。设置命令行参数和示例,使用argparse解析命令行参数,如目标进程的 PID、采样间隔、持续时间、是否使用正则表达式匹配函数名等。然后,根据解析得到的参数创建一个Probe对象。 -
_signal_ignore:静态方法,用于忽略 Ctrl+C 信号。这在脚本运行期间捕获 Ctrl+C 时很有用,因为它允许脚本在退出前完成清理工作。 -
run:运行funccount工具。首先,调用probe.load()加载 BPF 程序,然后调用probe.attach()将探测附加到目标上。接着,进入一个循环,定期输出当前的计数结果。循环将持续到达到指定的持续时间或用户按下 Ctrl+C。在循环中,根据参数设置,输出计数结果,包括时间戳、函数名和调用次数。如果达到持续时间或用户按下 Ctrl+C,脚本将停止统计,卸载 BPF 程序,并输出最后一次的计数结果。
Tool 类提供了运行 funccount 工具所需的主要功能。
可以通过 dubg 的方式看到生成的 C 代码,通过代码可以看到,总共跟踪了 17 个内核函数,
┌──[root@liruilongs.github.io]-[/usr/share/bcc/tools]
└─$funccount  'tcp_*_send*' -D > test.cpp
counts.atomic_increment(loc) 将counts数组中索引为loc的元素的值加1。这样,每当发生与loc相关联的探针或事件时,counts数组中相应的计数就会递增。
#include <uapi/linux/ptrace.h>BPF_ARRAY(counts, u64, 17);int trace_count_0(void *ctx)
{int loc = 0;counts.atomic_increment(loc);return 0;
}int trace_count_1(void *ctx)
{int loc = 1;counts.atomic_increment(loc);return 0;
}int trace_count_2(void *ctx)
{int loc = 2;counts.atomic_increment(loc);return 0;
}
..........................
博文部分内容参考
© 文中涉及参考链接内容版权归原作者所有,如有侵权请告知 😃
《BPF Performance Tools》
© 2018-2024 liruilonger@gmail.com, 保持署名-非商用-相同方式共享(CC BY-NC-SA 4.0)
相关文章:
认知)
BPF:BCC工具 funccount 统计内核函数调用(内核函数、跟踪点USDT探针)认知
写在前面 博文内容涉及BCC工具 funccount 认知funccount 可以帮助用户追踪和分析Linux系统上特定函数、系统探针或USDT探针的运行次数。这对于性能分析、故障排查和系统优化等场景非常有用。理解不足小伙伴帮忙指正 😃,生活加油 不必太纠结于当下,也不必…...

DPO算法推导
DPO 核心思想:直接使用偏好数据进行策略优化,省去 reward 模型策略优化。 技术背景知识: 首先给定prompt x,生成两个答案 ( y 1 , y 2 ) Π S F T ( y ∣ x ) (y_1,y_2)~\Pi^{SFT}(y|x) (y1,y2) ΠSFT(y∣x) ,并通…...
Qt源码分析:窗体绘制与响应
作为一套开源跨平台的UI代码库,窗体绘制与响应自然是最为基本的功能。在前面的博文中,已就Qt中的元对象系统(反射机制)、事件循环等基础内容进行了分析,并捎带阐述了窗体响应相关的内容。因此,本文着重分析Qt中窗体绘制相关的内容…...

docker 安装 禅道
docker pull hub.zentao.net/app/zentao:20.1.1 sudo docker network create --subnet172.172.172.0/24 zentaonet 使用 8087端口号访问 使用禅道mysql 映射到3307 sudo docker run \ --name zentao2 \ -p 8087:80 \ -p 3307:3306 \ --networkzentaonet \ --ip 172.172.172.…...

【简要说说】make 增量编译的原理
make 增量编译的原理 make是一个工具,它可以根据依赖关系和时间戳来自动执行编译命令。 当您修改了源代码文件后,make会检查它们的修改时间是否比目标文件(如可执行文件或目标文件)新,如果是,就会重新编译…...
DETRs Beat YOLOs on Real-time Object Detection论文翻译
cvpr 2024 论文名称 DETRs在实时目标检测上击败YOLO 地址 https://arxiv.longhoe.net/abs/2304.08069 代码 https://github.com/lyuwenyu/RT-DETR 目录 摘要 1介绍 2.相关工作 2.1实时目标探测器 2.2.端到端物体探测器 3.检测器的端到端速度 3.1.NMS分析 3.2.端到端速度…...
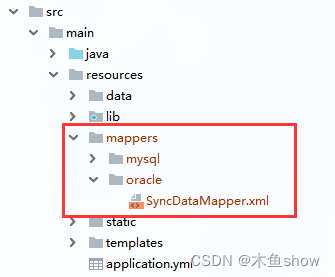
SpringBoot 多数据源配置
目录 一. 引入maven依赖包 二. 配置yml 三、创建 xml 分组文件 四、切换数据源 一. 引入maven依赖包 <dependency><groupId>com.baomidou</groupId><artifactId>dynamic-datasource-spring-boot-starter</artifactId><version>3.6.1&…...

RK3568驱动指南|第十六篇 SPI-第192章 mcp2515驱动编写:完善write和read函数
瑞芯微RK3568芯片是一款定位中高端的通用型SOC,采用22nm制程工艺,搭载一颗四核Cortex-A55处理器和Mali G52 2EE 图形处理器。RK3568 支持4K 解码和 1080P 编码,支持SATA/PCIE/USB3.0 外围接口。RK3568内置独立NPU,可用于轻量级人工…...

#BI建模与数仓建模有什么区别?指标体系由谁来搭建?
问题1: 指标体系是我们数仓来搭建还是分析师来做,如何去推动? 问题2:BI建模与数仓建模有什么区别? 指标体系要想做好,其实是分两块内容的,一块是顶层设计阶段,业务指标体系的搭建&am…...
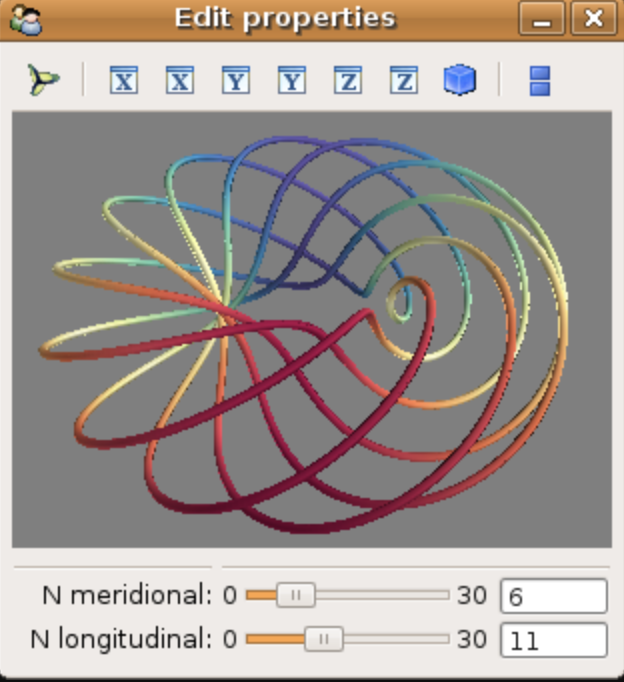
如何用Python实现三维可视化?
Python拥有很多优秀的三维图像可视化工具,主要基于图形处理库WebGL、OpenGL或者VTK。 这些工具主要用于大规模空间标量数据、向量场数据、张量场数据等等的可视化,实际运用场景主要在海洋大气建模、飞机模型设计、桥梁设计、电磁场分析等等。 本文简单…...
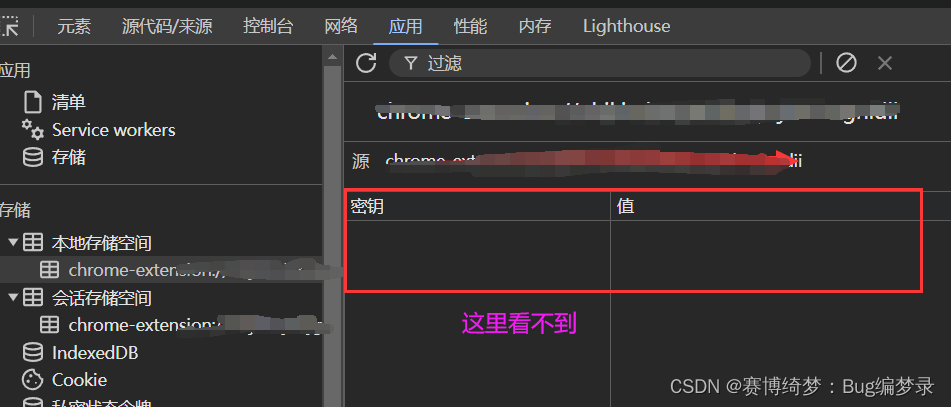
chrome.storage.local.set 未生效
之前chrome.storage.local.set 和 get 一直不起作用 使用以下代码运行成功。 chrome.storage.local.set({ pageState: "main" }).then(() > {console.log("Value is set");});chrome.storage.local.get(["pageState"]).then((result) > …...
泛微开发修炼之旅--30 linux-Ecology服务器运维脚本
文章链接:30 linux-ecology服务器运维脚本...

LeetCode 全排列
思路:这是一道暴力搜索问题,我们需要列出答案的所有可能组合。 题目给我们一个数组,我们很容易想到的做法是将数组中的元素进行排列,如何区分已选中和未选中的元素,容易想到的是建立一个标记数组,已经选中的…...

python实现支付宝异步回调验签
说明 python实现支付宝异步回调验签,示例中使用Django框架。 此方案使用了支付宝的pythonSDK,请一定装最新版本的,支付宝官网文档不知道多久没更新了,之前的版本pip安装会报一些c库不存在的错误; pip install alipay-…...
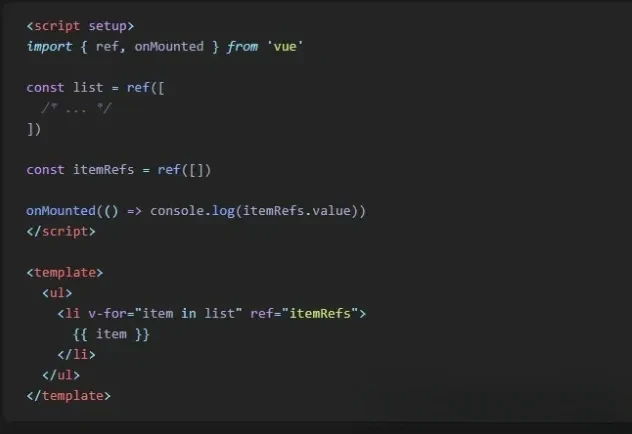
注意!Vue.js 或 Nuxt.js 中请停止使用.value
大家好,我是CodeQi! 一位热衷于技术分享的码仔。 当您在代码中使用.value时,必须每次都检查变量是否存在并且是引用。 这可能很麻烦,因为在运行时使用.value可能会导致错误。然而,有一个简单的解决方法,即使用unref()而不是.value。 unref()会检查变量是否是引用,并自…...

Java:JDK、JRE和JVM 三者关系
文章目录 一、JDK是什么二、JRE是什么三、JDK、JRE和JVM的关系 一、JDK是什么 JDK(Java Development Kit):Java开发工具包 JRE:Java运行时环境开发工具:javac(编译工具)、java(运行…...

Radio专业术语笔记
在收音机的 RDS (Radio Data System) 功能中,CT 代表 “Clock Time”。RDS 是一种数字广播标准,用于在调频广播中传输辅助数据,如电台名称、节目类型、交通信息等。CT 功能是其中的一部分,用于同步和显示广播电台发送的当前时间。…...

cocosCreator找出未用到的图片
最近整理项目的时候发现有些资源文件夹有点轮乱(一些历史原因导致的),而且有很多图片都是没用了的,但是没有被删除掉,还一直放在项目中,导致项目的资源文件夹比较大,而且还冗余。于是今天想着整理一下。 公开免费链接 找出未使用的图片 有好几种方法可以找出未使用的图片…...

一览 Anoma 上的有趣应用概念
撰文:Tia,Techub News 本文来源香港Web3媒体:Techub News Anoma 的目标是为应用提供通用的意图机器接口,这意味着使用 Anoma,开发人员可以根据意图和分布式意图机编写应用,而不是根据事务和特定状态机进行…...

Spring Boot集成fastjson2快速入门Demo
1.什么是fastjson2? fastjson2是阿里巴巴开发的一个高性能的Java JSON处理库,它支持将Java对象转换成JSON格式,同时也支持将JSON字符串解析成Java对象。本文将介绍fastjson2的常见用法,包括JSON对象、JSON数组的创建、取值、遍历…...

逻辑回归:给不确定性划界的分类大师
想象你是一名医生。面对患者的检查报告(肿瘤大小、血液指标),你需要做出一个**决定性判断**:恶性还是良性?这种“非黑即白”的抉择,正是**逻辑回归(Logistic Regression)** 的战场&a…...
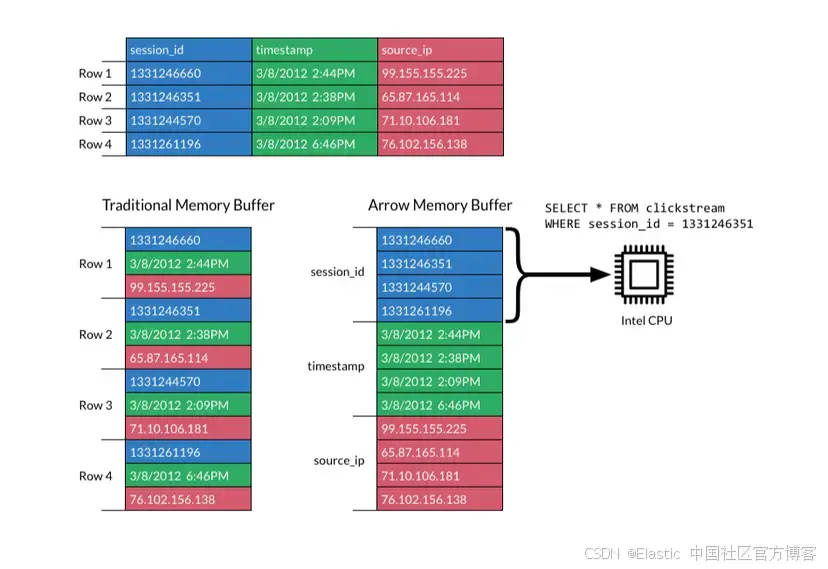
JavaScript 中的 ES|QL:利用 Apache Arrow 工具
作者:来自 Elastic Jeffrey Rengifo 学习如何将 ES|QL 与 JavaScript 的 Apache Arrow 客户端工具一起使用。 想获得 Elastic 认证吗?了解下一期 Elasticsearch Engineer 培训的时间吧! Elasticsearch 拥有众多新功能,助你为自己…...

在HarmonyOS ArkTS ArkUI-X 5.0及以上版本中,手势开发全攻略:
在 HarmonyOS 应用开发中,手势交互是连接用户与设备的核心纽带。ArkTS 框架提供了丰富的手势处理能力,既支持点击、长按、拖拽等基础单一手势的精细控制,也能通过多种绑定策略解决父子组件的手势竞争问题。本文将结合官方开发文档,…...

条件运算符
C中的三目运算符(也称条件运算符,英文:ternary operator)是一种简洁的条件选择语句,语法如下: 条件表达式 ? 表达式1 : 表达式2• 如果“条件表达式”为true,则整个表达式的结果为“表达式1”…...

智能在线客服平台:数字化时代企业连接用户的 AI 中枢
随着互联网技术的飞速发展,消费者期望能够随时随地与企业进行交流。在线客服平台作为连接企业与客户的重要桥梁,不仅优化了客户体验,还提升了企业的服务效率和市场竞争力。本文将探讨在线客服平台的重要性、技术进展、实际应用,并…...

CSS设置元素的宽度根据其内容自动调整
width: fit-content 是 CSS 中的一个属性值,用于设置元素的宽度根据其内容自动调整,确保宽度刚好容纳内容而不会超出。 效果对比 默认情况(width: auto): 块级元素(如 <div>)会占满父容器…...

HarmonyOS运动开发:如何用mpchart绘制运动配速图表
##鸿蒙核心技术##运动开发##Sensor Service Kit(传感器服务)# 前言 在运动类应用中,运动数据的可视化是提升用户体验的重要环节。通过直观的图表展示运动过程中的关键数据,如配速、距离、卡路里消耗等,用户可以更清晰…...
安装docker)
Linux离线(zip方式)安装docker
目录 基础信息操作系统信息docker信息 安装实例安装步骤示例 遇到的问题问题1:修改默认工作路径启动失败问题2 找不到对应组 基础信息 操作系统信息 OS版本:CentOS 7 64位 内核版本:3.10.0 相关命令: uname -rcat /etc/os-rele…...
Netty从入门到进阶(二)
二、Netty入门 1. 概述 1.1 Netty是什么 Netty is an asynchronous event-driven network application framework for rapid development of maintainable high performance protocol servers & clients. Netty是一个异步的、基于事件驱动的网络应用框架,用于…...
深度学习水论文:mamba+图像增强
🧀当前视觉领域对高效长序列建模需求激增,对Mamba图像增强这方向的研究自然也逐渐火热。原因在于其高效长程建模,以及动态计算优势,在图像质量提升和细节恢复方面有难以替代的作用。 🧀因此短时间内,就有不…...